Understanding tourist behaviour in terms of activeness and
intra-destination movement patterns for managing
tourism experience
A dissertation presented by
Judit Zoltan
Submitted to the
Faculty of Economics
Università della Svizzera italiana
for the degree of
Ph.D. in Economics
Thesis Committee:
Prof. Rico Maggi, supervisor, Università della Svizzera italiana
Prof. Massimo Filippini, internal examiner, Università della Svizzera italiana
Prof. Pietro Beritelli, external examiner, University of St. Gallen
Acknowledgments
This work could not have been realized without the support of my supervisor, Prof. Rico Maggi. Thank you for believing in me and offering the opportunity to pursue this PhD. You have directed and motivated me to take this path and grow in it.
I am very grateful to Prof. Massimo Filippini and Prof. Pietro Beritelli for having agreed to be part of my thesis committee. Your feedbacks are very important to me.
Thanks to the Swiss National Science Foundation, I had the opportunity to spend one year at the School of Hotel and Tourism Management at the Hong Kong Polytechnic University. During this stay I had the possibility to work with Prof. Bob McKercher, whose guidance and contribution to my work is greatly appreciated.
Ticino Turismo had a significant role in my thesis. The initial research on destination card was requested by them. I feel honored that I could lead that project and thanks to them investigate an under-researched topic.
I am very thankful to my friends at IRE and USI, particularly Natalia, for all the discussions and just being there for me. I enjoyed working in such a team, and looking forward to our future collaborations from wherever life is taking us.
Finally, and most importantly I would like to dedicate this thesis to my family, especially to my husband. His encouragement meant the most to not just finish my work but to aim as high as I can with it. You taught me more than you think. Moreover, I would love to thank my little son, Jonathan, who understood that finishing this work was important to me and supported me with his regular nap times.
Table of Contents
Introduction ... 9
Chapter One ... 19
The relation between push motivation and activity consumption at the destination within the framework of a destination card ... 19
1.1. Introduction ... 20
1.2. Literature review ... 21
1.3. Data and methodology ... 24
1.3.1. Data collection and sample ... 24
1.3.2. Methodology and hypotheses ... 28
1.4. Results and discussion ... 31
1.5. Implications ... 37
1.6. Conclusion ... 38
References ... 40
Chapter Two ... 44
Tourists intra-destination visits and transport mode: a bivariate probit model ... 44
2.1. Introduction ... 45
2.2. Tourist behavior in relation to intra-destination movement patterns and transport mode selection 46 2.2.1. Individual characteristics of tourists in relation to movement patterns ... 47
2.2.2. Mode of transport within destination ... 48
2.2.3. Intra-destination movement patters and transport mode choice ... 48
2.3. Data and method ... 50
2.4. Results ... 55
2.5. Conclusion ... 59
2.5.1. Managerial Implications ... 61
2.5.2. Limitations and Further research ... 63
References ... 64
Chapter Three ... 68
Analysing intra-destination movements and activity participation of tourists through destination card consumption ... 68
3.1. Introduction ... 70
3.2. Factors Influencing Intra-destination Movement Patterns... 72
3.3. Data and Method ... 74
3.4. Results ... 78
3.5. Discussion and Conclusions ... 82
References ... 88
Chapter Four ... 92
Tourist Flows and Spatial Behavior ... 92
4.1. Modeling Interdestination Tourist Movements ... 93
4.2. Modeling Intradestination Movements ... 96
4.3. Intervening Factors ... 100
4.3.1. Distance Decay and Market Access ... 101
4.3.2. Time and Financial Budgets ... 104
4.3.3. Trip and Personal Characteristics ... 105
4.4. Conclusion ... 105
9
Introduction
The dissertation is a collection of empirical and theoretical articles in the field of tourism behaviour. It is divided into four chapters and refers to four research articles; three of them are published in refereed journals and one of them is presented in an edited book.
The thesis focuses on the demand side of tourism, in particular on tourists’ consumption of a destination and on the conceptualization of their decision process during visitation. Tourists are visiting destinations in different ways. Their behaviour is related to and motivated by several factors, and the analysis of these factors allows a better understanding of tourists’ movements and activity participation. This information can be used for creating customized tourism products, such as itineraries or packages, which bring additional benefits to the tourists and the destination. In this context, destination cards are well-recognized, integrated products that facilitate tourists in their consumption by offering public transport usage and access to activities and attractions at the destination. This thesis investigates tourists’ mobility and activity participation in the framework of destination card usage, and therefore, combines two fields of research: tourists’ behaviour at the destination and integrated tourism product development.
Tourists’ movement patterns can be defined by the spatial changes in the location of activity consumption. On the global level they are analysed between the origin and the destination regions, while on the local level from one activity to another (Leiper, 1979). Furthermore, on the local level inter- and intra-destination movements can be distinguished (Dejbakhsh, Arrowsmith & Jackson, 2011; Lau & McKercher, 2007), depending whether multi- or single destination is visited. The analysis of these movements has high importance for a destination, especially in transport planning and product development (Lew & McKercher, 2006); therefore it is crucial to examine their influencing factors.
According to Lau and McKercher (2007), these factors can be categorized as human, trip related and physical. Human factors are identified by the tourist himself. Socio-demographic variables such as origin or cultural background (Dejbakhsh et al., 2011; Flognfeldt, 1999; Smallwood, Beckley, & Moore, 2012), or even psychographic characteristics, the so-called “Venturesomeness” (Plog 1974, 2002; Debbage, 1991) can influence tourists in the intensity and spatial extent of their movements. Trip factors are specific to the travel under investigation, including the length of stay (Pearce, 1990;
10
Shoval & Raveh, 2004), special interest (Fennel, 1996), familiarity with the destination (McKercher, Shoval, Ng, & Birenboim, 2012) or travel party composition (Decrop, 2005). As Oppermann (1997) demonstrated, greater time budget leads to more extensive visit of the destination. The interests of domestic and international tourists are also different: while domestic tourists are often on a repeat visit, they are more inclined to participate in social activities, while international tourists are rather first and only time visitors, who are interested in the main attractions (Lau & McKercher, 2007). They also have less knowledge about the destination, and are, therefore, less willing to explore more remote areas. Furthermore, the time spent and the intensity of pursuing different activities at the destination are highly influenced by travelling in groups or with children (Thornton, Shaw, & Williams, 1997).
The physical influencing elements characterize the destination itself, such as configuration (Lew & McKercher, 2006), transport network (Becken & Schiff, 2011), accommodation (Shoval, McKercher, Ng, & Birenboim, 2011) and attraction nodes (Dredge, 1999). Tourists spend significant amount of time in the surroundings of the hotel and attraction visitation is more likely to cluster in tourism nodes. Indeed, the concept of distance decay is significant also at the destination level, hence the demand for activities varies inversely with the distance travelled or with greater budget of time, money, or effort required to reach a place (McKercher & Lew, 2003).Regarding the relation between transport and tourism behaviour at the destination, Prideaux (2000) found that it received lower attention in the literature in comparison to transport between the origin and the destination, even though the considerations of tourist flows and the identification of their influencing factors are important for urban transportation planning and itinerary modelling (Lew & McKercher, 2006).
In this context, transport mode choice plays an important role. Exploring a destination by car provides not only the highest flexibility in terms of itineraries and time schedules (Taplin & Qiu, 1997), but also increases the likelihood of multi-destination visits (Tideswell & Faulkner, 1999). Moreover, tourism in rural areas often relies on private car usage (Dickinson & Robbins, 2008), although it would be crucial to promote sustainable transport development in the surroundings of natural attractions. Le-Klähn and Hall (2014) reviewed the literature of public transport use at the destination and found that the motivation of mode choice differs in urban and rural territories. While in urban areas traffic avoidance can be the main reason for using collective transport, studies analysing rural context reported scenic rides, environmental concerns, social contacts and trip purposes to be influential. Nevertheless, non-utilization of public transport in both urban and rural
11
environments is mainly motivated by inconvenience, lack of information and difficulty of usage (Le-Klähn, Gerike, & Hall, 2014). Additionally, as Hough and Hassanien (2010) suggested, the investigation of the effects of activities on transport choice could be a scope of future research.
Consequently, the usage of public transport services affects the overall experience and destination satisfaction (Thompson & Schofield, 2007). Collaboration among several stakeholders at the destination is the key for a successful public transport management; however, as Le-Klähn and Hall (2014) identified, a research gap exists in the policies for motivating public transport use by tourists. Malhado and Rothfuss (2013) proposed packaging public transport with attraction for promoting sustainable mobility. In this context, integrated tourism products are good examples and provide extensive data for the investigation of tourists’ movement patterns, activity consumption and transport network usage. Indeed, Lumsdon, Downward and Rhoden (2006) profiled the users of a multi-modal ticket, which aimed to encourage countryside visitation from urban territories. They suggested that the likelihood of transport modal shift is higher if an integrated offer is in place, motivated by the convenience of a prepaid option, value for money and environmental factors. However, in their research it remains unanswered whether tourists derive their utility from the usage of public transport or from the combination of it with tourism products. Similarly, destination cards are a good example of combining core attractions and public transport in order to assist tourists in the production of their experience (Pechlaner & Abfalter, 2005), especially in urban destinations (Russo & Van der Borg, 2002). Regional destination cards have more complex structures (Pechlaner & Zehrer, 2005), particularly when the region accommodates urban and rural areas and heterogeneous types of tourists consuming different services. Destination cards are commonly issued by destination management organizations in collaboration with tourism stakeholders at the destination (Martelloni, 2007). Although integration in tourism marketing and management is often discussed in the literature, destination cards have received relatively low attention, being used primarily to conduct aggregate supply side studies (Beritelli & Humm, 2005).
Furthermore, recognizing the importance of activity consumption, movement patterns and their influencing factors at the destination enables service providers to better cater for the needs of tourists and develop more tailor-made products for them. Destination cards are primarily created for promoting the destination and its products; however, they can serve also as a source of data for analysing tourism behaviour and deriving marketing implications. Moreover, in order to profile the users of destination cards, activity consumption and motivation of the holiday should be also investigated. Indeed, Lee, O’Leary, Lee and Morrison (2002) confirmed that awareness of the
12
tourists’ motivation provides the base for a sound marketing strategy, as it is related to travel behaviour and activity pursuit at the destination. The distinction between pull and push motivations have been examined in several tourism contexts (Bieger & Laesser, 2002). Push motivation is the internal force, which represents the benefits sought by the tourists for going on a holiday or taking alternative activities, while pull motivation is related to the destination choice itself (Yoon & Uysal, 2005). Therefore, push is antecedent of pull factor in terms of logic and time, and although activity participation can be explained by a mix of push and pull factors, it seems to be more related to the former construct (Lee et al., 2002). The relation between motivation and activity pursuit has been widely examined in the literature; however, the intensity of the consumption has been rarely addressed (Dolnicar & Laesser, 2007), despite its importance for product development.
By summarizing the literature, the following gaps have been identified. (1) There is a lack of research analysing destination cards from the demand side perspective, in spite of their worldwide availability. In particular, a little attempt has been undertaken to profile tourists who are buying integrated tourism products; their motivations, requirements and the activities they participate in are under-researched. (2) The operationalization of activity consumption is present in the literature diversely; however, intensity of consumption, length of stay of tourists and typology of their activities are hardly evaluated in its measurement and there are no studies considering them all together. (3) Besides activities, transport usage is the core element of integrated tourism products, but whether tourists purchase these products mainly for the usage of public transport or for its combination with the tourism experience has not been addressed yet. (4) The evaluation of the activities undertaken at the destination and transport choice are directly linked to spatial consumption. In this context, the conceptualization of the decision process at intra-destination level needs further research. (5) Whether the spatial or the product structure of the destination plays a greater influence on behaviour has not been identified so far. (6) Tourists’ choices related to spatial movements and transport mode have not been treated in model estimation as correlated decisions yet. Both the area visited and the mode of transport used are influenced by tourist and trip profiles; however, (7) the effects of motivation and (8) type of activities in this context have not been analyzed before. Especially, the involvement of motivation can be important in order to better understand the decision-making process of tourist’s mobility.
This dissertation aims to contribute to the current literature by addressing these gaps. Statistical methods, such as regression (ordinary least square, ordered logit and bivariate probit), principal component, cluster and discriminant analyses are employed to model the relationship among the
13
constructs of travel behaviour. Data for the empirical applications has been collected in the Canton of Ticino in the South part of Switzerland.
The first two articles are based on a survey conducted with tourists visiting Ticino. In particular, the first article investigates the relation among motivation, activeness indicators and destination card requirements, where the last two variables are introduced for the first time in this study. Activity indicators measure the type and intensity of activity consumption normalized to the length of stay, while destination card requirements refer to the characteristics of these cards interest the tourists. In addition, this article attempts to identify the consumer profile of destination cards. According to the results of trip characteristics, a tourist is more likely to purchase a destination card, when he visits the destination for the first time and has a lower-middle range holiday budget. Regarding motivation, a ‘Safe getaway’ from home and ‘Nature and relax’ are most desired by the target of destination cards. Moreover, as the information on novelties was found to be the most valued card requirement, this aspect needs to be emphasized in marketing campaigns, for example, by accompanying the product with informative brochures and freely downloadable mobile applications. In line with the results on consumption patterns, cards should be based on cultural and natural activities. Furthermore, as the consumption of social activities is mainly practiced by domestic tourists on a repeated visit, the inclusion of those activities in destination cards could build up destination loyalty, and eventually encourage first timers for their multiple visits.
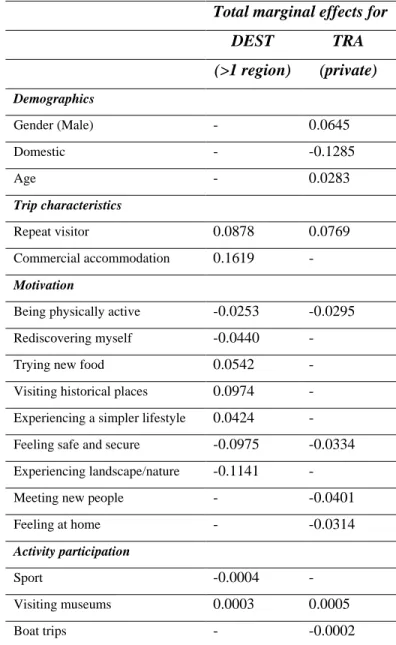
The second paper contributes to the current body of literature on tourist intra-destination movement patterns by analysing the influencing factors of both the spatial extent of the destination visited and the transport mode selected. Furthermore, a theoretical contribution is provided by recognizing the correlation between individual choices on movement patterns and mode of transport at the destination level, and appropriately estimating a bivariate probit model. The research concludes that the two variables under investigation are explained by a different combination of independent variables:, wherein the transport mode choice is influenced by demographics, whereas movement patterns are described by trip characteristics. This is further enhanced by the introduction of variables reflecting motivation and activity participation as explanatory factors of the two correlated choices. Finally, marginal effects are derived to quantify the impacts and draw policy implications providing useful information for destination marketing and policy planning, particularly on how to increase the extent of the area visited, the use of public transport and eventually also tourist length of stay and expenditure.
14
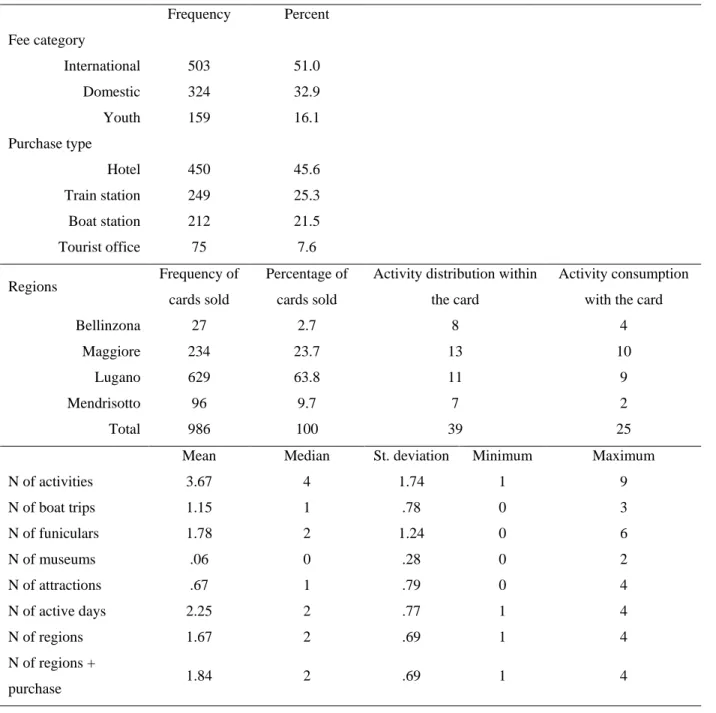
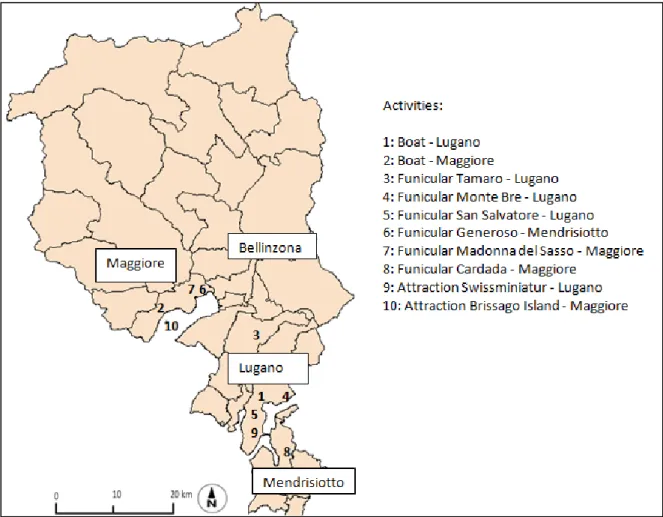
The thesis further examines behaviour tracked by the usage of destination cards. In the third article the dataset is derived from destination cards sold in Ticino; it reports the activity consumption and spatial movements of 1000 tourists. The article investigates the existence of spatial or product clustering in consumption and looks for the discriminating factors among the clusters. The results allow conceptualizing tourists’ decision process at the destination, where spatial structure weights more than product structure. In fact, three out of the four groups emerged from the analysis demonstrate consumption within the same tourism node, while the largest group mainly purchase the card for the transport usage. The results identify three main discriminating variables among the clusters. First, the place of purchase of the card classifies the group, which suggests that tourists mainly visit attraction in the surroundings of their accommodation. Second, the degree of participation in different activities distinguishes among the cluster membership of tourists. Third, the number of active days within the usage of the card discriminates among the clusters, which is related to the different length of stay of the tourists.
Finally, the chapter on tourist flows and spatial behaviour provides an extensive review of the literature on movement patterns. Regarding research on inter-destination movements, the chapter summarizes and categorizes studies on itinerary types according to the transit and destination touring components of the trips taken. Then, the chapter gives a deeper concentration on the current research stream on intra-destination movement patterns. Indeed, intra-destination research emerged recently, due to technological developments. These studies require more precise data, often tracked by new devices and analysed by more sophisticated software. Several theories are discussed in detail, such as the intensity-specificity of touring, rhythm of mobility and sequence of visitation. Furthermore, the chapter reviews the intervening factors of spatial movement patterns. First, from the geographical outlook, distance decay and market access represent the main theoretical concepts influencing tourist’s movements. Second, the limitations of temporal and financial budgets are examined from the different research views. Third, the effects of trip and personal characteristics on movement patterns are outlined. As a conclusion, the chapter opens new research opportunities by adding to, or re-examining existing tourism concepts from geographical and temporal perspectives.
In terms of implications, the thesis is beneficial for destination marketing organizations, regional transport authorities and tourism operators, as it proposes ideas for managing tourists’ mobility and consumption within the destination. Especially in the area of marketing, several ideas are derived from the results, which can bring financial benefits to the destination and enhance the tourists’ experience, hence, increase their satisfaction.
15
References
Becken, S., & Schiff, A. (2011). Distance models for New Zealand International tourists and the role of transport prices. Journal of Travel Research, 50(3), 303-320.
Beritelli, P., & Humm, C. (2005). Einsatz von intelligenten Gastekarten in Turismusdestinationen— Ein Ruckblick nach Euphorie. In: H. Pechlaner., & A. Zehrer (Eds.), Destination Card Systeme.
Entwicklung – Management –Kundenbindung. Band 11 in der Schriftenreihe Management und Unternehmenskultur (pp. 89–100). Wien: LindeVerlag.
Bieger, T., & Laesser, C. (2002). Market segmentation by motivation: the case of Switzerland.
Journal of Travel Research, 41(1), 68–76.
Debbage, K. (1991). Spatial behavior in a Bahamian resort. Annals of Tourism Research, 18(2), 251-268.
Decrop, A. (2005). Group processes in vacation decision-making. Journal of Travel & Tourism
Marketing, 18(3), 23-36.
Dejbakhsh, S., Arrowsmith, C., & Jackson, M. (2011). Cultural influence on spatial behavior.
Tourism Geographies, 13(1), 91-111.
Dickinson, J. E., & Robbins, D. (2008). Representations of tourism transport problems in a rural destination. Tourism Management, 29(6), 1110–1121.
Dolnicar, S., & Laesser, C. (2007). Travel agency marketing strategy: insights from Switzerland.
Journal of Travel Research, 46(2), 133–146.
Dredge, D. (1999). Destination place and planning. Annals of Tourism Research, 26(4), 772–779.
Fennell, D. (1996). A Tourist space-time budget in the Shetland Islands. Annals of Tourism
16
Flognfeldt, T. (1999). Traveler geographic origin and market segmentation: The multi trips destination case. Journal of Travel and Tourism Marketing, 8(1), 111-124.
Hough, G., & Hassanien, A. (2010). Transport choice behaviour of Chinese and Australian tourists in Scotland. Research in Transportation Economics, 26, 54–65.
Lau, G., & McKercher, B. (2007). Understanding tourist movement patterns in a destination: a GIS approach. Tourism and Hospitality Research, 7(1), 39-49.
Lee, G., O’Leary, J., Lee, S. H., & Morrison, A. (2002). Comparison and contrast of push and pull motivational effects on trip behavior an application of a multinomial logistic regression model.
Tourism Analysis, 7(2), 89–104.
Leiper, N. (1979). The Framework of Tourism: Towards a definition of tourism, tourists and the tourist industry. Annals of Tourism Research, 6(4), 390-407.
Le-Klähn, D. T., Gerike, R., & Michael Hall, C. (2014). Visitor users vs. non-users of public transport: The case of Munich, Germany. Journal of Destination Marketing & Management. DOI: 10.1016/j.jdmm.2013.12.005
Le-Klähn, D. T., & Hall, C. M. (2014). Tourist use of public transport at destinations–a review.
Current Issues in Tourism, (ahead-of-print), 1-19.
Lew, A., & McKercher, B. (2006). Modeling tourist movements: a local destination analysis.
Annals of Tourism Research, 33(2), 403-423.
Lumsdon, L., Downward, P., & Rhoden, S. (2006). Transport for tourism: can public transport encourage a modal shift in the day visitor market? Journal of Sustainable Tourism, 14(2), 139-156.
Malhado, A. C. M., & Rothfuss, R. (2013). Transporting 2014 FIFA World Cup to sustainability: exploring residents’ and tourists’ attitudes and behaviours. Journal of Policy Research in Tourism,
17
Martelloni, R. (2007). Nuoviterritori. Riflessioni e azioni per lo sviluppo e la comunicazione del
turismo culturale. Angeli: Milano.
McKercher, B. & Lew, A. (2003). Distance decay and the impact of effective tourism exclusion zones on in international travel flows. Journal of Travel Research, 42(2), 159–165.
McKercher, B., Shoval, N., Ng, E., & Birenboim, A. (2012). First and repeat visitor behaviour: GPS tracking and GIS analysis in Hong Kong. Tourism Geographies, 14(1), 147-161.
Oppermann, M. (1997). Length of stay and travel patterns. In CAUTHE 1997: Tourism research:
Building a better industry; Proceedings from the Australian Tourism and Hospitality Research Conference, 1997 (p. 471). Bureau of Tourism Research.
Pearce, D. G. (1990). Tourism, the regions and reconstructing in New Zeeland. Journal of Tourism
Studies, 1(2), 33-42.
Pechlaner, H., & Abfalter, D. (2005). Cultural tourism packages: the role of smartcards in the Alps. In: M. Sigala, & D. Leslie (Eds.), International cultural tourism: management, implications and
cases (pp. 40–50). Oxford: Elsevier Butterworth-Heinemann.
Pechlaner, H., & Zehrer, A. (2005). Destination Card Systeme. Entwicklung –Management –
Kundenbindung. Band 11 in der Schriftenreihe Management und Unternehmenskultur. Wien:
LindeVerlag.
Plog, S. C. (1974). Why destination areas rise and fall in popularity. The Cornell Hotel and
Restaurant Administration Quarterly, 14(4), 55-58.
Plog, S. C. (2002). The power of psychographics and the concept of venturesomeness. Journal of
Travel Research, 40(3), 244-251.
Prideaux, B. (2000). The role of the transport system in destination development. Tourism
18
Russo, A. P., & Van der Borg, J. (2002). Planning considerations for cultural tourism: a case study of four European cities. Tourism Management, 23(6), 631–637.
Shoval, N., McKercher, B., Ng, E., & Birenboim, A. (2011). Hotel location and tourist activity in cities. Annals of Tourism Research, 38(4), 1594–1612.
Shoval, N., & Raveh, A. (2004). Categorization of tourist attractions and the modeling of tourist cities: based on the co-plot method of multivariate analysis. Tourism Management, 25(6), 741–750.
Smallwood, C. B., Beckley, L. E., & Moore, S. A. (2012). An analysis of visitor movement patterns using travel networks in a large marine park, north-western Australia. Tourism Management, 33(3), 517-528.
Taplin, J. H. E., & Qui, M. (1997). Car trip attraction and route choice in Australia. Annals of
Tourism Research, 24(3), 624-637.
Thompson, K., & Schofield, P. (2007). An investigation of the relationship between public transport performance and destination satisfaction. Journal of Transport Geography, 15(2), 136-144.
Thornton, P. R., Shaw, G., & Williams, A. M. (1997). Tourist group holiday decision-making and behaviour: the influence of children. Tourism Management, 18(5), 287–297.
Tideswell, C., & Faulkner, B. (1999). Multidestination travel patterns of international visitors to Queensland. Journal of Travel Research, 37(4), 364–374.
Yoon, Y., & Uysal, M. (2005). An examination of the effects of motivation and satisfaction on destination loyalty: a structural model. Tourism Management, 26(1), 45-56.
19
Chapter One
The relation between push motivation and activity consumption at the
destination within the framework of a destination card
Judit Zoltan Lorenzo Masiero
Published: Journal of Destination Marketing & Management 1 (2012) 84–93
Abstract
This research analyses the influence of tourist’ psychological motivation visiting a destination on their actual travel behaviour and the use of this information for bundling tourism attractions and services in a destination card. The relation between push motivation and activity consumption at the destination is recognized in the literature. The paper extends this evidence by introducing activeness indicators measured according to the amount and type of activity participation normalized to the length of stay. Regarding destination cards the paper investigates, through the use of ordered logistic regressions, four requirements (monetary, timesaving, informational and customization), defined as the benefits of a card tourists may find important. The model results show a significant relation between card requirements and both activeness and motivation, suggesting that destination cards need to be based on natural and cultural attractions, whereas entertainment, sport and social activities can be only additional benefits on discounted price. The data has been collected in the Ticino region, Switzerland. The sample refers to 586 face to face interviews with tourists visiting the area.
20
1.1. Introduction
Integration between destination marketing and management has been the focus point of a wide range of literature in tourism (Buhalis, 2000). Being on holiday, tourists are consuming a bundle of services, they perceive the destination as an integrated product. Therefore, implementing strategies to attract tourists cannot be realized by a single actor, but rather by means of common efforts of Destination Management Organizations (DMOs) and local operators. The importance of collaboration and the stakeholders’ involvement in policy making is frequently mentioned in the literature (Palmer &Bejou, 1995; Bramwell &Sharman, 1999; Wang &Xiang, 2007; Wang, 2008; Haugland, Ness, Gronseth, &Aarstad, 2011). Different forms of tourism marketing alliances between the private and the public sectors are mutually beneficial for both; attracting more tourists can improve the financial results of private operators and can bring social enhancements to the public ones (Palmer &Bejou, 1995). Due to the variety of products involved in tourism and the differences in competences, implementing collaborations within a destination is a complex issue. The role of DMOs is to set strategic objectives for the operators at a destination and help to achieve their common goals (Buhalis, 2000). DMOs are increasingly involved in retailing function at a destination (Buhalis, 2000), however they usually do not promote individual products, but rather assist the interaction between the tourist and the suppliers. Destination cards are a good example of public–private initiatives in destination marketing and management, used as a marketing tool worldwide, at destinations of any size, with the aim of facilitating the visit of tourists in the production and consumption of their experience and therefore increase the usage of tourist services at a destination. In most cases, destination cards are dedicated to cities and include public transport and major attractions, while regional destination cards have more complex structures, especially when the region accommodates heterogeneous types of tourists, consuming different services. Destination cards are commonly issued by DMOs in collaboration with tourism stakeholders at the destination. Although integration in tourism marketing and management is often discussed in the literature, little research effort has so far been directed towards analysing their practical implication in terms of destination cards. The topic is investigated and described mainly in the German and Italian speaking context by Pechlaner and Zehrer (2005) and Martelloni (2007).
This paper, being a part of the research project aimed to design a new destination card for canton Ticino, Switzerland, proposes an exploratory study of the topic. In particular, the objective is to profile tourists who can be interested in purchasing a regional destination card by investigating their purpose of visit and the activities they are undertaking at the destination. In order to reach this aim,
21
multivariate statistical methods are proposed to analyse the destination cards in relation to motivation and activity consumption. Therefore, before looking at the effects on the card itself, the first topic to be tackled is the influence of psychological motivation of tourists to go on a specific holiday on their actual travel behaviour. A further aspect to be tackled is the understanding whether the tourist motivation, other than the socio-demographic profile, can help to define targeted services at the destination. Hence the relation between the motivation of taking a holiday and the involvement in holiday activities needs to be explored. The relation between push motivation and activities undertaken at the destination is recognized in the literature (Lee, O’Leary, Lee, & Morrison, 2002). This research aims to extend this evidence by introducing activeness indicators measured according to amount and frequency of participation, incorporating the length of stay. By analysing the level of activeness of tourists through their actual usage, we can better understand their engagement in activities available at the destination. Further on, knowing the intensity of usage of tourist activities during a holiday is very important to study destination cards. Hence the indicator of activeness is developed, tested with motivation components and used to reach the main objective of this research. Indeed, the main contribution to the tourism literature and practice is expected regarding the following aspects of destination cards: What are the most important requirements of regional destination cards? Which type of tourists value more important the different benefits derived from a destination card? What kind of attractions can be included in a destination card? Through exploratory factor analysis, ordinary least square and ordered logit regression techniques a survey dataset is analysed to answer these questions within the case of canton Ticino, Switzerland.
The paper is organized as follows. In Section 2 the literature concerning destination cards and the relation between motivation and activities is provided. Description of the data and method used are then outlined in Section 3, whereas results and the implications are proposed in Section 4. Finally, Section 5 presents the conclusions of the research.
1.2. Literature review
Pechlaner, Abfalter and Raich (2002) explain the phenomenon of destination cards through the resource based view, as the task of card managers is to combine the core competences in the area and to integrate the different branches into one offer. By analysing empirical and theoretical studies on destination cards by Pechlaner and Zehrer (2005), the following objectives of developing a destination card can be identified: (1) to add value to the experience of visitors, (2) to increase the
22
usage of tourism products and services in the region, (3) to valorise minor, less visited attractions, (4) to redistribute tourist flows, (5) to meliorate the organization of the tourism experience, (6) to improve the perception of the destination brand, (7) to promote the region; as a destination card is an integrated marketing product, it increases tourists’ awareness of the attractions and activities in the region, (8) to monitor the tourist experience: the microchip used in smartcards can collect different tourist data, such as the way of moving around in the region, the services used and the expenditure. Additional objectives of a destination card might also include the possibility: (1) to increase the length of stay of tourists, as the higher awareness of activities and their presence in the cards, as well as cheaper card fees for longer stay can lead to extension of stay, (2) to increase tourist expenditure in the region, (3) to increase the use of public transport and therefore reduce the pollution from private transport use, as in most cases unlimited usage of public transport is included during the validity of destination cards, (4) to reach new segments of visitors through more targeted marketing. Examples of these cards are present worldwide with differences regarding the mode of usage, the type of offer, the validity and price. Pechlaner and Abfalter (2005) propose an empirical research on the design of destination cards with only cultural services. Beritelli and Humm (2005) asked the card providers of the destinations, analysing also the attractions and activities included in the cards. Russo and Van der Borg (2002) mention destination cards among best practices while testing ‘‘visitor-friendliness’’ in urban destinations for cultural tourism.
The review of the literature continues with studies on motivation and activity participation at the destination, as they are crucial for consideration in the case of a new destination card. Motivation has been often used for tourism marketing purposes and product development (Bansal & Eiselt, 2004; Zhang & Marcussen, 2007), in fact Lee et al. (2002) confirm that awareness of the tourists’ motivation provides the base for a sound marketing strategy, as it is related to travel behaviour and activity pursuit at the destination. As destination cards are tools for engaging in activity consumption, not only the type of activities tourist would be interested in, but also their motivation for taking a trip should be also investigated. The distinction between pull and push motivations have been examined in several tourism contexts (Bieger & Laesser, 2002; Crompton, 1979; Dann, 1977; Pearce, 2005; Uysal & Jurowski, 1994). Push motivation is the internal force, which represents the benefits sought by the tourists for going on a holiday or taking alternative activities, while pull motivation is related to the destination choice itself. Therefore, push motivation is antecedent of pull factor in terms of logic and time, and although activity participation can be explained by a mix of push and pull factors, it seemed to be more motivated by the former construct (Lee et al., 2002). This relation between motivation (mostly push factors) and tourist activities
23
consumed at the destination has been examined by different measures in the literature. While motivation is mostly measured on a Likert scale ranging from not at all important to very important (Gitelson & Kerstetter, 1990; Yoon & Uysal, 2005), the measurement of activities is not as standard. In particular, Brey and Lehto (2007) are examining whether tourists are involved in the same activities in their everyday life as in the holiday. While they measure daily activities on a four-point Likert scale according to frequency, tourist activities are recorded with binary, yes or no possibilities. Zhang and Marcussen (2007) find that activities have effect on satisfaction; less active tourists are less satisfied with the destination. They measure level of participation in an activity according to a five-point scale with no-low-high interpretation. Lehto, O’Leary and Morrison (2004) find that prior visit to the same destination has a higher effect on activity participation than age. They measure activity breadth by adding up the number of factors in which any of the activities are practiced by the respondents. Repeaters become specialists in terms of activities; they participate in fewer activities but more profoundly. Another way to measure activities is to perform it in terms of involvement, as behavioural differences can be linked to the degree of engagement. From the 1980s activity involvement is widely researched through Consumer Involvement Profile (CIP) from a marketing study of Laurent and Kapferer (1985), Havitz and Dimanche (1979) and Gursoy and Gavcar (2003). Tang, Manthiou, Morrison, Shin and Chiang (2012) acknowledge that ‘‘activity’’ is often investigated through factor analyses and used for tourist segmentation in the literature. They explore activity preference on a five-point Likert scale stating importance and analysing them through a second-order factor model. Dolnicar and Laesser (2007) measure activities pursued during the trip in terms of intensity, by dividing the number of days when the activity is undertaken by the overall length of stay, suggesting that length of stay is a useful variable to be analysed in relation to activity consumption. Regarding the combination of different activities, Dellaert, Borgersand and Timmermans (1995) conduct a conjoint analysis of the evaluation of activity packages in an urban context. Lee et al.(2002) propose the development of motivation-activity typology. With ordinary least square regression techniques they examine the amount and type of activity participation in three thematic sets as dependent variables and two kinds of motivation factors as explanatory variables. They find the length of stay to be a significant predictor. Gitelson and Kerstetter (1990) investigate the relationship between socio-demographic variables, the benefits vacation travellers seek for and travel behaviour. They report that the social and relaxation dimensions receive more importance with the increase of the length of stay. Furthermore they find a significant relationship between the types of activity tourists are engaged in and benefits sought. A positive relation between cultural motivation and quantity of activity engagement is shown by
24
Gomez-Jacinto, Martin-Garcia and Bertiche-Haud’Huyze (1999) modelling the amount of tourist activity as a dependent variable.
1.3. Data and methodology
As derived from the literature review, analysing push motivation gives good insight for a new product development—in this case for a destination card. Destination cards are facilitating activity consumption within a given time validity of the card, therefore the intensity of activity consumption normalized to the length of stay needs to be investigated. Moreover, in the literature, push motivation is effecting the type of activity consumption, however this relation needs to be tested also using the activeness indicator proposed in this article. Hence, in order to address the objectives of the empirical research, three hypotheses are formulated and analysed in the following sections. First of all, the influence of push motivation on the indicator of activeness is tested, to check if the results are coinciding with existing literature also when using a new measure of activity consumption. Afterwards, in the second and third hypotheses the effects on tourists’ requirements of a destination card are investigated, in relation to push motivation and to activeness, respectively. More detailed description of the hypotheses is presented after the description of the sample and variables used.
1.3.1. Data collection and sample
For assessing the aims of the study, a survey research has been conducted, as the investigation of motivation and travel behaviour is mainly assessed through survey analysis in the literature (Hsu, Cai, & Li, 2011). The data has been collected during the summer of 2010, in Ticino, Switzerland. Nine touristic locations within the regional territory have been chosen under the guidance of the Tourism Office of Ticino. In order to gather the data, three interviewers selected among bachelor students have been randomly assigned to the dates and locations of the data collection. The survey has been created in the three main languages of tourists visiting Ticino, German, Italian and English. After a pilot survey, 586 valid responses have been collected through the initial questionnaire.
The survey design is based on an extensive literature review conducted in the first phase of the project. The first part of the questionnaire contains variables on demographic profile, such as gender, age and nationality, and on trip characteristic variables, such as prior visit, length of stay,
25
accommodation, travel company, holiday budget excluding accommodation and previous experience with destination cards in terms of purchase. The sample is composed of 58% female and 42% male respondents (Table 1.1). Regarding the age of the respondents, the most represented age group lies between 41 and 50, followed by tourists from 21 to 30 years old. The larger share of respondents (61%) are domestic tourists (hence from Switzerland), while among the rest of the source markets, none of them reached more than 10% share. This result is in line with the official guest night statistics of the canton. Therefore, a dummy variable is applied for assessing origin, with domestic and international distinction. The majority of the tourists are repeaters (72%). Concerning accommodation, we can note that 66% of respondents have paid for the accommodation at the destination, while the rest either stayed with friends/family or own vacation house or made only a one-day excursion to the destination. The average budget only for activities at the destination is 293 CHF, whereas the average length of stay is 5.2 nights. Finally, 8% of the respondents reported previous purchase of destination cards.
Table 1.1 Sample descriptive statistics for variables under investigation
Mean Median Std. dev. Min Max Demographics
Gender (Male) 0.42 - 0.49 0 1
Age group 3.36 4 1.42 1 7
Trip characteristics
Domestic (Swiss) 0.61 - 0.48 0 1
Travel companion (with children) 0.37 - 0.48 0 1
Repeat visitor (repeaters) 0.72 - 0.45 0 1
Commercial Accommodation (commercial) 0.66 - 0.48 0 1
Holiday budget 292.67 200 279.37 10 2500
Number of nights 5.18 5 4.99 0 60
Previous purchase of a destination card 0.08 - 0.26 0 1
The second part of the survey refers to the operationalization of the three constructs, namely motivation, activity consumption and destination card requirements, which are measured through several questions. First, push motivation is measured through 17 statements, taken from the literature mainly by Yoon and Uysal (2005) and for adapting to the Swiss case by Bieger and Laesser (2002). The questions rely on categorical scale variables where respondents were asked to state their importance of a statement for going on holiday from one (not at all important) to four (very important). Second, the frequencies of 11 holiday activities available at the destination,
26
identified in collaboration with the Tourism office of Ticino are measured. In the questionnaire, tourists were stating for each listed activity whether they undertake it: never, once, few times or every day.
Table 1.2 Principal component analysis of push motivations
Push motivation factors Factor loading Explained variance
Factor 1: Safe getaway 16.813
Feeling safe and secure .733
Feeling at home away from home .696
Experiencing a simpler lifestyle .681
Being free to act how I feel .623
Rediscovering myself .445
Factor 2: Nature and relax 12.140
Experiencing landscape and nature .718
Getting rest and relaxation .664
Going to a sunny place .527
Factor 3: Novelty 10.453
Trying new food .783
Visiting historical places .750
Experiencing new/different lifestyles .623
Factor 4: Excitement 10.148
Finding thrills and excitement .802
Being physically active .731
Meeting new people .442
Factor 5: Togetherness and fun 7.422
Being entertained and having fun .669
Being together with partner/family/friends .665
Total Variance explained 56.976
Kaiser-Meyer-Olkin Measure of Sampling Adequacy .770. Bartlett's Test of Sphericity p< .000 Cronbach alpha for the overall scale 0.747. 1 - not at all important, 4 - very important
Following the descriptive analysis of the data, an exploratory factor analysis is carried out. Indeed, factor analysis has been widely used in the literature for analysing respondents’ answers to motivation and activity participation statements (Sarigöllü & Huang, 2005). The method of principal component analysis is utilized with varimax rotation to extract the underlying dimensions of motivation and activity consumption. First of all, exploratory factor analysis is conducted on the
27
motivation variables, by extracting five factors, each containing at least two variables (Table 1.2), labelled as ‘Safe getaway’, ‘Nature and Relax’, ‘Novelty’, ‘Excitement’ and ‘Togetherness and fun’. The most variables (5) are loading on the ‘Safe getaway’ factor, explaining almost 17% of the variance. The only item removed from further analysis is ‘Visiting friends and relatives’ as it has a lower loading than 0.4, and is not displayed on any factors. The total variance explained by the five push motivation factors is 57%, many of them containing the same or very similar elements to those in the literature analysed (Yoon & Uysal, 2005), and the reliability test for internal consistency of the scale is 0.747.
The second principal component analysis is performed on the frequencies of activities consumed by the tourists. Table 1.3 shows the three factors extracted, the first one – including the most activities – is related to culture and nature, the second contains activities connected to sport and entertainment, while the third one is linked to social activities, such as going to lido, experience nightlife or events and festivals.
Table 1.3 Principal component analysis of activities
Activities Factor loading Explained variance
Factor 1: Culture-nature 20.227
Using cable cars .768
Visiting museums and/or historical buildings .647
Eating in typical restaurants .624
Natural and botanical parks .594
Boat trip on the lake .550
Factor 2: Entertainment-sport 15.493
Using wellness facilities .724
Sports and renting equipment .674
Entertainment parks .633
Factor 3: Social 14.985
Lido .705
Nightlife .686
Events and festivals .551
Total Variance explained 50.705
Kaiser-Meyer-Olkin Measure of Sampling Adequacy .717. Bartlett's Test of Sphericity p< .000 1 – activity never undertaken, 4 – activity every day undertaken
28
Thirdly, as for developing a new product it is crucial to define customer requirements (Callahan & Lasry, 2004), i.e., the necessary conditions customers want from a product, we aim to explore why tourists would buy a destination card and which attributes of it are the most important. Therefore from a previous benchmark analysis of existing regional destination cards and from the empirical study of Pechlaner and Abfalter (2005), four statements about destination cards have been selected for measuring what tourists require from this product. In particular, they are explored in terms of customization (It contains only those activities in which I am interested), monetary aspect (I can obtain good discounts with it), timesaving (I can save time) and information on novelties at the destination (I can get new ideas what to visit) stating importance on a four-point Likert scale. As Table 1.4 shows, the most relevant requirement of destination cards is the information on novelty at the destination, 55% of the tourists evaluated this very important. A similar, but slightly lower, relevance is recorded for receiving discounts on tourist activities. Interestingly, the other two requirements investigated, namely customization and timesaving, show a lower importance where the latter results to be the least important feature. This can be explained by the destination itself as Ticino is not characterized by long queues to access the attractions.
Table 1.4 Destination card requirements
Mean Median St.dev Min Max
Customization 3.04 3.00 .892 1 4
Monetary aspect 3.35 3.00 .767 1 4
Timesaving 2.95 3.00 .978 1 4
Information on novelty 3.42 4.00 .772 1 4
1.3.2. Methodology and hypotheses
As introduced in Section 2, the measurement of activity at the destination is performed in different ways within the literature. In this context, our empirical application starts with defining a new indicator for measuring activity participation. In particular, the indicator of activeness I(A) for respondent i is created as follows:
(
)
(
( ) ( ) ( ))
( )i ji every day i ji few times 1 i / 4 ji once i
j
29
where, Li is the length of stay for respondent i defined in terms of number of days spent at the destination while variables Aji(every day), Aji(few times) and Aji(once) take value one if the activity j is partaken by tourist i every day, a few times and once during his stay, respectively. For activities partaken a few times during the stay, the indicator assumes that the tourist practiced the activity in the quarter of the overall stay, 1 plus one in order to assure that it takes a higher value compared to an activity practiced only once. In line with the activity measures of Dolnicar and Laesser (2007), the indicator is then standardized by the length of stay in order to allow for comparison among respondents. This way of creating the indicator allows us to actually measure the average overall activeness of tourists, which indeed is an important aspect for bundling activities within a destination card. A further aspect to be considered in creating tailor-made destination cards regards the activeness registered for different types of activities. In this context, the overall activeness indicator can be divided into three activity-specific indicators which are calculated according to the factors identified in the principal component analysis of activities, presented in Table 1.3. Formally, the overall activeness indicator is a summation of the three types of indicators and is structured as follows:
( ) ( ) ( ) ( )
( )i overall ( )i culture nature ( )i entertainment sport ( )i social
I A =I A − +I A − +I A
(2)
where the three activity-specific indicators are calculated according to the approach introduced in Eq. (1) and considering exclusively culture and nature activities (I(A)i(culture-nature)), entertainment and sport activities (I(A)i(entertainment-sport)) and social activities (I(A)i(social)), respectively. In order to test and extend the recognized relation between push motivation and activities undertaken at the destination, the activeness indicators identified are investigated by proposing the following hypothesis:
H.1. The activeness of tourists is influenced by their push motivation.
This first hypothesis is tested by performing the following ordinary least square regression on the overall activeness indicator as well as on the three activity-specific activeness indicators:
( )
i i i
i m m m d d d t t t
I A = +α
∑
β ×Motivation +∑
β ×Demographics +∑
β ×Trip characteristics (3)where, the m motivation variables reflect the five factors identified by the principal component analysis of push motivations (reported in Table 1.2) and are calculated by weighting the importance stated by respondent i for motivation m to the associated factor loading, whereas demographics and
30
trip characteristics (presented in Table 1.1) are used as supporting variables. Consecutively, the application aims to investigate the four destination card requirements analysed in the questionnaire, namely customization, monetary aspect, timesaving and information on novelty. In particular, the different rating stated by respondents for the destination card requirements can be influenced by not only demographics and trip characteristics but also by push motivation. Indeed, as tourists are often segmented by motivation, the introduction of these variables could show us what segments evaluate certain statements as important and applying them for creating and marketing a destination card. Furthermore, this could indicate for which purpose of stay destination cards can be promoted. In this line, we propose the following hypothesis:
H.2. A direct relation exists between push motivation of tourists and their requirements from a
destination card.
This second hypothesis is tested by performing the following ordered logistic regression on the importance rating stated for the four destination card requirements (CR):
(4)
where, the m motivation variables are as defined for Eq. (3) and demographics and trip characteristics (presented in Table 1.1) are used as supporting variables. Although motivation can be assumed to be an important driver for particular destination card requirements, the type of activeness of tourists within a day can also result to be important since destination cards are actually incentivizing higher level of activeness of tourists by mostly including unlimited usage of attractions at the destination. Therefore, a third hypothesis to be tested is the following:
H.3. A direct relation exists between the type of activeness of tourists and their requirements from a
destination card.
Indeed, it is expected that the type and amount of activity consumed define what is more required from a card by a tourist. In order to test this hypothesis, the rating of the card requirements is explained by the activity-specific activeness indicators along with demographics and trip characteristics through the following ordered logistic regression:
( )a ( ) i i i
i a I A a d d d t t t
CR = +α
∑
β ×I A +∑
β ×Demographics +∑
β ×Trip characteristics (5)i i i
i m m m d d d t t t
31
where, the a activity-specific activeness indicators are explained in Eqs. (1) and (2). In this context, the model expresses in Eq. (5) does not integrate the model stated in Eq. (4) for hypothesis H.2, since the two sets of variables, namely motivation and activeness, are correlated to each other.
The use of logistic regression for the hypotheses H.2 and H.3 is caused by the fact that the dependent variables in the regression are measured on Likert scale, hence are ordinal. Using maximum likelihood, the models are predicting the probability for triggering the observed dependent variables (Winship &Mare, 1984).For the three sets of models identified in Eqs. (3)–(5), backward selection of the variables was applied in order to keep only significant parameters in the final estimation. In particular, the models in Eq. (3) are performed on the full sample of 586respondents (with listwise deletion for missing values) while models in Eqs. (4) and (5) are performed on a subset of 583 respondents due to missing values of the dependent variables.
1.4. Results and discussion
Four ordinary least square regressions (Table 1.6) and eight ordered logistic regressions (Table 1.7) have been estimated in order to test the three hypotheses formulated, H.1, H.2 and H.3, respectively. The same supporting variables, in terms of demographics (gender and age) and trip characteristics (domestic holiday, repeated visits, staying at commercial accommodation, travelling with children, overnight stays and budget) have been introduced for investigation in every model in order to capture their influence adequately. An additional dummy variable capturing previous purchase of destination cards has been introduced in the estimation for testing hypotheses H.2 and H.3. The bottom part of the tables reports the model fit for each model under investigation. Using backward selection, only significant parameters are kept in the final model estimation.
The indicators measuring the level of activeness of tourists have been used as dependent variables of the ordinary least square regressions and as independent variables for a subset of the ordered logistic regressions. By definition (please refer to Eq. (1)), the overall activeness indicator can take values between zero and eleven since in our application we measure the participation in eleven activities. As the indicator is normalized to the length of stay, the maximum score in terms of overall activeness can occur if a tourist practices each activity every day during his holiday in the region. In the same line, the maximum score associated with the indicator for culture-nature activeness is five while for the indicators of entertainment-sport and social activeness is three
32
(please refer to Table 1.3 for the number of activities within each category). The descriptive statistics for the overall and three type of activeness are presented in Table 1.5.
Table 1.5 Sample descriptive statistics for activeness indicators
Mean Median Std. dev. Min Max
Overall activeness 1.83 1.50 1.24 0 11
Culture-nature activeness 1.05 0.85 0.82 0 5
Entertainment-sport activeness 0.18 0.00 0.36 0 3
Social activeness 0.60 0.50 0.55 0 3
Notably, the maximum score registered in the sample coincides with the maximum value that the indicators can take as well as the minimum score registered in the sample captures tourists with no activity participation at the destination. On average, the overall activeness indicates that almost two activities per day are practiced. However, looking at the three types of activeness that compose the overall indicator, it is interesting to note a high concentration of participation in culture-nature activities which are, on average, undertaken every day. On the contrary, activities reflecting entertainment-sport are rarely practiced (as indicated by the median), on average once in five days, while the social activeness indicator shows a considerable consumption of these activities.
The first hypothesis (H.1) is tested using the overall activeness and the three different types of activeness indicators. The results are presented in Table 1.6, where the first column presents the results of the overall activeness indicator, whereas the second, third and forth columns refer to the type of indicators, correspondingly. The first part of the table reports the effect on the variables reflecting motivations, then followed by the relation with demographics and trip characteristics. Regarding the importance rated for motivations, the component ‘Excitement’ has a significant and positive impact on every activeness indicator investigated whereas motivations associated with ‘Novelty’ result being positive and significant in all the activeness indicators but the one referring to entertainment-sport. The component grouping the motivations reflecting on ‘Togetherness and fun’ is only significant for the social activeness indicator and coherently shows a positive sign, meaning that the more importance tourists give to these statements, the more social activities they consume daily. In line with the expectations, ‘Nature and relax’ component has a positive relation with the culture-nature activeness indicator while negative with entertainment-sport and social activeness indicators. The factor ‘Safe getaway’ is related positively to overall activeness as well as
33
to culture-nature and entertainment-sport activeness indicators, and negatively to the indicator reflecting the consumption of social activities.
Table 1.6 H.1 – OLS model results
Overall activeness Culture-nature
activeness
Entertainment-sport activeness
Social activeness
Coeff. (t-ratio) Coeff. (t-ratio) Coeff. (t-ratio) Coeff. (t-ratio)
Constant 0.255 (1.21) -0.954 (-4.33) a 0.023 (0.28) 0.659 (3.50) a
Motivations
Safe getaway 0.043 (2.09) b 0.033 (2.20) b 0.015 (2.12) b -0.023 (-2.06) b
Nature and relax - - 0.154 (6.30) a -0.026 (-2.19) b -0.093 (-5.11) a
Novelty 0.123 (4.30) a 0.110 (5.88) a - - 0.026 (1.87) c
Excitement 0.158 (4.91) a 0.041 (1.88) c 0.048 (4.64) a 0.068 (4.34) a
Togetherness and fun - - - - - - 0.070 (2.72) a
Demographics Gender (Male) - - - - - - - -Age - - 0.079 (3.71) a - - -0.074 (-4.60) a Trip characteristics Domestic - - - - - - 0.113 (2.38) b Family - - - - - - -0.085 (-1.91) c Overnight stay -0.045 (-4.45) a -0.032 (-4.95) a -0.007 (-2.36) b - -Repeater - - -0.108 (-1.69) c - - 0.126 (2.49) b Comm. Acc. - - - - - - - -Budget 0.005 (2.76) a 0.002 (1.91) c 0.001 (2.70) a - -Model fit R2 0.135 0.267 0.077 0.221 Adj.R2 0.127 0.257 0.069 0.209
a=prob<1%; b=prob<5%; c=prob<10%; "-" = not significant
In terms of demographics, gender has no effect on the amount and type of activities consumed. Age has no influence on overall activeness; however, it distinguishes among the respondents with high consumption of cultural activities versus social activities. In particular, younger tourists consume more social activities, whereas with the increase of age more cultural and natural activities are practiced. As for trip characteristics, with the rise of length of stay, the activeness (measured on a daily basis) diminishes, except for tourists consuming social activities. The overall budget without including accommodation is significantly influencing every type of activeness per day, apart from social activeness. Regarding travel companion, those travelling with their family are consuming more social activities. Turning to the variables on destination familiarity, cultural activities are more
34
consumed by first time visitors while repeaters prefer social activities, as they are already familiar with the destination. Further on this point, interestingly, also domestic tourists are consuming significantly more social activities than international one. Whether tourist are paying to stay in a commercial accommodation or are staying in their own second home or with friends/relatives (without additional expenditure on accommodation) has no effect on the activity consumption according to the results. In general, most of the motivation components analysed show a significant relationship with the activeness indicators investigated resulting in a higher model fit for the culture-nature and social activeness indicators. Hence, the hypothesis H.1 is accepted, a relation exists between motivation components and activeness indicators especially for social and culture-nature activeness indicators.
In order to test the second (H.2) and the third (H.3) hypotheses, the destination card requirements are used as dependent variables. The results of the analysis, modelling separately the relationship among the four destination card requirements and both push motivation factors and activeness indicators, are shown in Table 1.7. In particular, for each destination card requirement two models are proposed in order to test either hypothesis H.2 or H.3, where the model for H.2 reports the relation with the motivation factors while the model for H.3 reports the relation with the activeness indicators. The same demographics and trip characteristics are used in the two models as supporting variables. At the bottom part of the table, each pair of models show the model fit which allows for a direct comparison of the model including motivation factors with the model including activeness indicators.
Regarding demographics and trip characteristics, from the two models proposed we find that the monetary aspect of destination cards (discounts) is more important for tourists with lower budget and for female tourists. Furthermore, both models estimated for the customization requirement suggest that domestic tourists are less in favour of having included in the card only those activities they are interested in. Interestingly, both models indicate that tourists visiting the destination for the first time give higher importance to timesaving aspect of the card. For both models, no effects are found on any requirement for the variables such as prior purchase of destination cards, length of stay and travel companion (with family). Other significant effects are registered for only one of the two models estimated suggesting a weaker interpretation of the associated results. In particular, younger age groups are more inclined to requirements such as customization, discounts and new ideas whereas tourists staying in commercial accommodation are less likely to find important such features of a destination card as customization and information on novelty.