http://palaeo-electronica.org
PE Article Number: 12.3.14A
Copyright: Paleontological Association December 2009 Submission: 9 January 2009. Acceptance: 13 October 2009
Bates, Karl T., Falkingham, Peter L., Breithaupt, Brent H., Hodgetts, David, Sellers, William I., and Manning, Phillip L., 2009. How Big Was ‘Big Al’? Quantifying the effect of soft tissue and osteological unknowns on mass predictions for Allosaurus
(Dinosauria:Theropoda). Palaeontologia Electronica Vol. 12, Issue 3; 14A: 33p;
HOW BIG WAS ‘BIG AL’? QUANTIFYING THE EFFECT OF SOFT
TISSUE AND OSTEOLOGICAL UNKNOWNS ON MASS PREDICTIONS
FOR ALLOSAURUS (DINOSAURIA:THEROPODA)
Karl T. Bates, Peter L. Falkingham, Brent H. Breithaupt, David Hodgetts,
William I. Sellers, and Phillip L. Manning
ABSTRACT
MOR693, nicknamed ‘Big Al,’ is the most complete skeleton of the non-avian
theropod Allosaurus and therefore provides the best opportunity to investigate the
mass properties of this important Jurassic theropod through accurate physical or digital
volumetric models. In this study, laser scanning and computer modelling software have
been used to construct volumetric models of MOR693. A long-range laser scanner has
been used to digitize the mounted cast of MOR693, allowing the reconstruction of body
volumes and respiratory structures around and within the three-dimensional (3D)
skel-etal model. The digital medium offered the facility to modify model properties
non-destructively in a detailed sensitivity analysis to quantify the effects of the many
unknown parameters involved in such reconstructions. In addition to varying the
vol-umes of body segments and respiratory structures, we also extend the sensitivity
anal-ysis to include uncertainties regarding osteological articulations in non-avian
dinosaurs, including effects of inter-vertebral spacing and the orientation or ‘flare’ of the
rib cage in MOR693. Results suggest body mass and inertial values are extremely
uncertain and show a wide range in plausible values, whilst the CM (centre of mass)
position is well constrained immediately in front and below the hip joint in MOR693,
consistent with similar reconstructions of non-avian theropods.
Karl T. Bates. Adaptive Organismal Biology Research Group, Faculty of Life Sciences, University of
Manchester, Stopford Building, Oxford Road, Manchester, M13 9PL United Kingdom,
[email protected].
Peter L. Falkingham. School of Earth, Atmospheric and Environmental Science, University of Manchester,
Williamson Building, Oxford Road, Manchester, M13 9PL, United Kingdom,
[email protected].
Brent H. Breithaupt. Geological Museum, University of Wyoming, Laramie, WY 82071, USA,
[email protected].
David Hodgetts. School of Earth, Atmospheric and Environmental Science, University of Manchester,
Williamson Building, Oxford Road, Manchester, M13 9PL, United Kingdom,
[email protected].
Manchester, Stopford Building, Oxford Road, Manchester, M13 9PL United Kingdom,
[email protected].
Phillip L. Manning. The Manchester Museum, University of Manchester, Oxford Road, Manchester, M13
9PL, United Kingdom, and School of Earth, Atmospheric and Environmental Science, University of
Manchester, Williamson Building, Oxford Road, Manchester, M13 9PL, United Kingdom,
[email protected].
Key words: Allosaurus; ‘Big Al’; body mass; centre of mass; inertia; LiDAR; modeling
INTRODUCTION
In 1991, the most complete dinosaur known
from Wyoming was excavated from the Upper
Jurassic Morrison Formation in the eastern Bighorn
Basin near the town of Shell (Breithaupt 2001).
Although the theropod Allosaurus has been known
for over 100 years, this specimen (nicknamed ‘Big
Al’) had one of the most complete skulls and
skele-tons of this genus yet to be found. This specimen is
particularly important as it represents a partially
articulated, 95% complete, pathologic (i.e., with
broken, fractured, and infected bones) skeleton of
a sub-adult Allosaurus fragilis (although it may
rep-resent a new species). Consequently, MOR 693
has gained international recognition, as the
scenar-ios of its painful life, early death, and rapid burial
have been determined through various
paleonto-logical analyses. The Museum of the Rockies
molded MOR 693 and provided a permanent
dis-play cast to the University of Wyoming Geological
Museum.
Such complete skeletons provide an
opportu-nity to investigate the mass properties of extinct
animals by allowing accurate physical or digital
vol-umetric models to be produced (Colbert 1962;
Alexander 1985, 1989; Farlow et al. 1995;
Hender-son 1999; HutchinHender-son et al. 2007; Bates et al.
2009). These models can be used to characterize
the mass, centre of mass (CM) and inertial
proper-ties of body segments, providing information
nec-essary for numerical biomechanical assessments
of functional morphology (e.g., Hutchinson et al.
2007). Bates et al. (2009) used laser scanning and
computer modelling software to construct
volumet-ric models of five specimens of non-avian
dino-saurs. A long-range laser (LiDAR) scanner was
used to digitize mounted skeletons allowing the
reconstruction of body volumes and respiratory
structures around and within the 3D skeletal
model. The digital medium offered the facility to
modify model properties non-destructively, such
that a detailed sensitivity analysis could be
con-ducted to quantify the effect of the many unknown
parameters involved in such reconstructions. By
varying the volume of body segments and
respira-tory structures, it was possible to constrain the
maximum plausible range of mass set values
within broad limits. In this study the same approach
is used to constrain the maximum plausible range
in mass values for Allosaurus MOR 693 and by
inference specimens of similar skeletal
propor-tions. Sensitivity analyses have only recently
begun to be applied in dinosaur body volumetric
reconstructions and the few previous studies
(Hen-derson and Snively 2003; Hutchinson et al. 2007;
Bates et al. 2009) have not directly addressed the
affects of ambiguities in the articulation or
mount-ing of dinosaur skeletons on volumetric
reconstruc-tions. In this study the sensitivity analysis is
extended to include additional uncertainties
regarding osteological articulations in non-avian
dinosaurs, with specific focus on the effects of
inter-vertebral spacing (i.e., the unknown volume of
inter-vertebral discs) and the orientation or ‘flare’ of
the rib cage in MOR 693.
MATERIALS AND METHODS
A RIEGL LMS-Z420i 3D terrestrial Light
Detection and Range (LiDAR) scanner was used to
digitize the University of Wyoming (UW) Geological
Museum’s mounted cast of MOR 693 (Figures 1.1,
1.2). The CAD package Maya
(www.autodesk.com/maya) was used to construct
body outlines around the digital skeletal model,
fol-lowing the approach of Bates et al. (2009; figures
1.3, 1.4). The skull of MOR 693 was mediolaterally
distorted during post-mortem burial and so was
re-inflated by 20% prior to head volume
reconstruc-tion, based on observations of published
descrip-tions of A. fragilis (Madsen 1976). Each
reconstructed body segment was given a density
of 1000 kg m
-3, in accordance with previous
stud-ies (Alexander 1985, 1989; Henderson 1999;
Hutchinson et al. 2007).
After producing a ‘best estimate model’ (see
discussion below) a sensitivity analysis was
con-ducted to investigate the effects of initial
assump-tions and estimate a realistic range of mass set
values for MOR 693. Mass properties were
calcu-lated for a single gracile (minus 7.5%) and two
larger models (+ 7.5% and +15%), by changing the
diameter of the NURBs circles that defined the
neck, thoracic, sacral, tail and hind limb segments
(thigh, shank and metatarsal). Bates et al. (2009)
found that the + 15% models far exceeded the
likely maximum body segment volumes for the five
animals studied. In an attempt to better constrain
the likely maximum mass set values for MOR 693
an additional + 11.25% model was constructed. To
investigate uncertainties regarding the relative
pro-portions of body segments, a series of trunk and
leg segments from the respective models were
interchanged. In addition to segment volumes, the
effects of having larger and smaller zero density
respiratory structures in our thoracic and neck
seg-ments were also tested.
Even near-complete specimens suffer from
uncertainties about precise articulation of the
skel-eton, yet no physical or digital mass reconstruction
to-date has tested for the effects of these
unknowns on mass set predictions (Bates et al.
2009). As a first step towards quantifying
uncer-tainties in mass predictions related to the mounting
of dinosaur skeletons additional models were
pro-duced in which the articulation of trunk elements
were varied. Specifically, the effects of two
uncer-tainties in dinosaur skeletal reconstructions are
tested; the medio-lateral angulation or flare of the
ribcage and relative spacing of individual vertebrae
(i.e., inter-vertebral disc length). First, the best
esti-mate thoracic volume was adjusted after
increas-ing and decreasincreas-ing the orientation or flare of the rib
cage +/- 10 degrees. Second, the best estimate
reconstruction was modified by increasing the
sep-aration between vertebrae and their associated
NURBs outline by 0.005 m to mimic an enlarged
inter-vertebral disc cavity. The original spacing of
vertebrae from the dorsal and caudal series in the
casted skeleton can be found in the appendix
(Table 26).
RESULTS
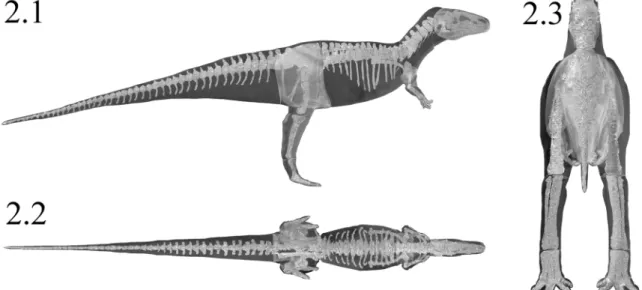
The best estimate mass model of MOR 693
(Figure 2, Animations 1-2) has a total body mass of
1500.91 kg, with the whole body CM positioned
0.184 m and 0.141 m in front and below the
acetabulum. Table 1 summarizes the mass data for
each of the initial gracile and larger models
pro-duced in the sensitivity analysis, a suite of which
FIGURE 1. (1) Cast of ‘Big Al’ (MOR 693) at the University of Wyoming Geological Museum. (2) Raw LiDAR point
cloud of the specimen and surroundings. (3) Triangulated skeletal model of upper body area, surrounded by
Non-Uni-form Rational B-Spline (NURBs) circles. (4) Surface lofted through NURBs circles to produce body volume.
can be seen in the accompanying animations
(Ani-mations 3-10). The largest model (Figure 3.4)
rep-resented an increase of 31.7% (457.94 kg) in total
body mass over the best estimate prediction, while
the smallest model (Figure 3.1, Animations 3-4)
was 12.9% (193.22 kg) lighter than initial
predic-tions (Table 1). Best estimate centre of mass
posi-tions were most affected by altering the
combinations of body segment volumes; the
com-bination of large thoracic and neck segments with
reduced tail segments resulted in the most cranial
CM positions (0.375 m in front of the acetabulum),
while enlarged tails and reduced anterior body
seg-ments brought the CM closest to the acetabulum
(0.05 m in front of the joint). However, the CM
remained in front and below the hip joint in all
mod-els. The full mass set results for the model
gener-ated can be found in the appendix (Appendix:
Tables 2-25).
DISCUSSION
The reconstructions presented here provide
the first comprehensive mass set values for
Allo-saurus, based on the single most complete
speci-men currently known and thus providing a firm
basis to constrain the likely maximum range in
mass properties for this dinosaur. As in a previous
study (Bates et al. 2009), reconstruction of best
estimate body segment and respiratory volumes
was guided by the anatomy of the skeletal model
and information from extant archosaurs. It was
ensured that the ventral outline of the sarcral
seg-ment passed close to the pelvis (ischium and
FIGURE 2. Best estimate reconstruction of MOR 693 in (1) right lateral; (2) dorsal; and (3) cranial views (not to
scale, respiratory structures not shown). See also Animation 1 & 2.
Animation 1. Animation of initial best guess
recon-struction of MOR 693 body volumes. (For animations,
see web site, palae-electronica.org/2009_3/
index.html.)
Animation 2. Animation of best guess reconstruction
of MOR 693 body volumes. Body volume translucent
to allow view of size of reconstruction around skeleton.
Table 1. Summary of results for volumetric models of MOR 693.
Model Net Density (kg m-3) Volume (kg m2) Mass (kg) CM (x,y,z) (m) Best estimate 933.983 1.607 1500.91 0.214, 1.696, 0 Minus 7.5% 910.648 1.436 1307.69 0.215, 1.704, 0 + 7.5% 922.644 1.849 1705.97 0.211, 1.689, 0 + 11.25% 928.18 1.973 1831.3 0.21, 1.687, 0 + 15% 932.916 2.119 1976.85 0.213, 1.686, 0Expanded rib cage 933.983 1.713 1564.44 0.248, 1.7, 0 Contracted rib cage 949.792 1.487 1412.34 0.17, 1.691, 0 Inter-vertebral spacing
+0.005m
928.021 1.657 1537.73 0.228, 1.698, 0
FIGURE 3. Right lateral and dorsal of body outline
smaller and larger models of MOR 693. (1) -7.5% from
best estimate; (2) +7.5%; (3) +11.25%; and (4) +15%.
See also Animations 3-10.
Animation 4. Animation of minus 7.5% reconstruction
of MOR 693 body volumes. Body volume translucent
to allow view of size of reconstruction around
skele-ton.
Animation 3. Animation of minus 7.5% reconstruction of
pubis) based on consideration of pelvic limb
mus-culature (Hutchinson 2001) and the impressions of
the pubic boot in trace fossils (Gierlinski et al.
2005). The lateral profile around the pectoral girdle
has to pass under scapula-coracoids and is
unlikely to extend below the level of the arms,
which would severely restrict the range of
move-ment. The gastralia form a shallow convexity
link-ing the pubis and sternum in non-avian theropods,
so the belly outline was constructed with a
conser-vative amount of flesh beneath this plane, based
on the relationship between the gastralia and the
abdominal wall in extant crocodilians (Perry 1983;
Claessens 2004). The amount of flesh
recon-structed on the dorsal surface of the animal was
likely to be of moderate depth based on the
anat-omy of extant archosaurs, though the dorsal
out-line of the anterior neck is expanded near its
insertion on head segment to account for the
mus-culature in the nuchal crest region, notably M.
transversospinalis capitis (Snively and Russell
2007). The mediolateral expansion of trunk cavities
is generally considered to be the most uncertain
dimension in trunk reconstructions of non-avian
dinosaurs (Henderson 1999). The best estimate
Animation 5. Animation of plus 7.5% reconstruction of
MOR 693 body volumes.
Animation 6. Animation of plus 7.5% reconstruction of
MOR 693 body volumes. Body volume translucent to
allow view of size of reconstruction around skeleton.
Animation 7. Animation of plus 11.25% reconstruction
of MOR 693 body volumes.
Animation 8. Animation of plus 11.25% reconstruction
of MOR 693 body volumes. Body volume translucent
to allow view of size of reconstruction around skeleton.
Animation 10. Animation of plus 15% reconstruction of
MOR 693 body volumes. Body volume translucent to
allow view of size of reconstruction around skeleton.
Animation 9. Animation of plus 15% reconstruction of
reconstruction of MOR 693 had around 35-40 mm
of soft tissue between the proximal end of the ribs
and the wall of the thoracic cavity, which
repre-sents 12% of the mediolateral width of one side of
the reconstructed body volume.
The most gracile model has a total mass of
1307.69 kg (1280 kg with enlarged air sacs) but is
highly emaciated, particularly in the torso (Figure
3.1, Animations 3-4). When the gracile model was
subjected to the full volume reduction it resulted in
the body outline moving within the rib cage, and
this was manually adjusted (i.e., re-inflated) prior to
mass calculations until the ribs were enclosed
within the thoracic cavity. The largest model
pro-duced a mass estimate of 1976.85 kg (2000.03 kg
with reduced air sacs), but was unrealistic in many
areas and contained an excessive amount of flesh
around the neck, torso, sacrum and proximal tail
(Figure 3.4, Animation 9-10). However, all
ments in the + 7.5% model and many of the
seg-ments in the + 11.25% model still appeared
reasonable given the inherent levels of uncertainty
(Figures 3.2-3.3, Animations 5-8). Both the
medio-lateral and dorso-ventral extent of the proximal
parts of the neck and tail appear excessively large
in the + 11.25% model, and the ventral outline of
the body extended well below the level of the
gas-tral basket (Figure 3.3, Animations 7-8). These
considerations suggest that the model represents a
close approximation to the likely maximum total
body mass for MOR 693 given the current level of
uncertainty surrounding body volumes in non-avian
dinosaurs. It is therefore suggested that the total
body mass of MOR 693 is constrained within
1350-1850 kg.
It is now clear from a number of independent
studies that precise values chosen for volumes of
respiratory structures have relatively little effect on
body mass predictions in dinosaurs (Alexander
2006; Hutchinson et al. 2007; Bates et al. 2009),
and the results in this study are consistent with this
conclusion. The initial respiratory structures
calcu-lated for this study amounted to 8.8% of the total
best estimate body volume and 11.5% for the
Head-Arms-and-Trunk (HAT) volume (Appendix:
Tables 2, 25, and Animation 11). Larger body air
sacs increased this volume to 10.5% total body
vol-ume (13.6% HAT volvol-ume) when placed in the best
estimate model, while smaller air sacs were
equiv-alent to just 7.2% total volume or 9.4% HAT volume
(Appendix: Tables 3-4, 25). Even changing air sac
volumes in the largest and smallest models to
exaggerate mass effects had less than +/-2.1%
effect on total body mass in these models
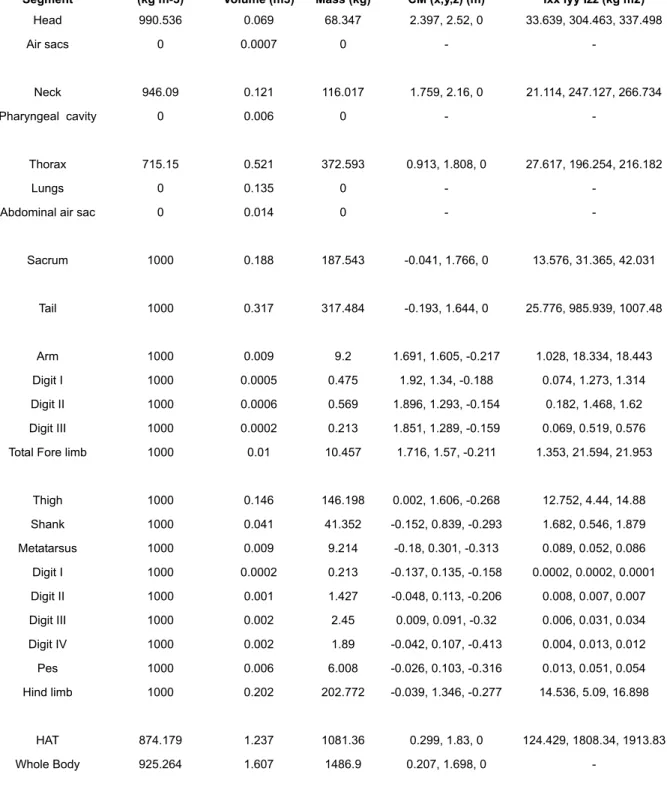
(Appen-dix: Tables 9, 14, 25). Addition of an abdominal air
sac to the best estimate model had a modest affect
on mass predictions, reducing total body by 0.93%
(Appendix: Table 5), and so the current ambiguity
surrounding the presence of this structure in
non-avian theropods (see O’Connor and Claessens
2005 for discussion) does not greatly affect mass
set predictions (Bates et al. 2009; Hutchinson et al.
2007).
The sensitivity analysis undertaken on rib
cage orientation and inter-vertebral spacing
pro-vides the first insight to the effect of ambiguities in
dinosaur joint articulation on mass set predictions.
Manual adjustments of the best estimate thoracic
cavity after increasing the mediolateral flare of the
rib cage by 10 degrees resulted in a 20.3% (0.106
kg m
-3) increase in thoracic volume, similar to the
23% (0.12 kg m
-3) decrease incurred by
contract-ing the rib cage by 10 degrees (Appendix: Tables
20-21; Fig. 4.1). However, expansion and
contrac-tion of the rib cage necessitates parallel changes to
the thoracic air sac, which reduced the actual
change in thoracic mass to +16.4% (63.53 kg) and
-22.9% (88.57 kg) in the respective models (Figure
4.1). Whilst this represents a significant change to
the mass and volume of the thoracic segment, the
overall effect on total body mass is modest (Table
1). Increasing inter-vertebral spacing between
cau-dal, dorsal and cervical vertebrae by 0.005 m
effec-tively increased the length of our best estimate
reconstruction by approximately 0.35 m and total
body volume by 0.05 m
3. However, once again the
necessity of increasing air sac volume to maintain
plausible respiratory anatomy (O’Connor and
Claessens 2005) reduced the actual body mass
increase to just 36.82 kg or 2.5% (Appendix: Table
22; Figure 4.2).
The sensitivity analysis strongly suggests that
the trunk CM must lie well in front and below the
Animation 11.
Animation of skeleton of MOR 693
showing size and position of reconstructed respiratory
structures.
acetabulum in Allosaurus (Figure 5; Table 1, 23).
Even in models with significantly enlarged tails and
reduced thoracic and neck segments, the CM
remained comfortably in front of the hip joint. The
same remained true in sensitivity analyses
con-ducted on volumetric models of Tyrannosaurus,
Acrocanthosaurus, Struthiomimus and
Edmonto-saurus in previous studies (Hutchinson et al. 2007;
Bates et al. 2009). Varying the volume of thoracic
and pharyngeal air sacs had a relatively modest
effect on CM positions, shifting the CM by just
+/-0.02 m along x (horizontal) and y (vertical) axes
(Appendix). Similarly, the changes made to skeletal
articulation (rib cage flare and inter-vertebral
spac-ing) failed to shift the CM by more than 0.045 m
(Table 1, Appendix: Table 23). Overall, the
posi-tions of the Head-Arms-and-Trunk CM and the total
body CM from the models of MOR 693 are similar
to those calculated for Acrocanthosaurus, rather
than Tyrannosaurus (Hutchinson et al. 2007; Bates
et al. 2009), consistent with the relative
phyloge-netic placement of these taxa within the Theropoda
and the relatively larger tails and smaller heads in
allosauroids. These results suggest that even with
the significant soft tissue and osteological
unknowns, it may be possible to test hypotheses
regarding phylogenetic trends in CM positions,
such as the gradual cranial migration of CM within
Theropoda on the on-line to crown-group birds
(Gatesy 1990, 1995).
Mass and inertial properties also underpin
bio-mechanical assessments of absolute and relative
performance in both extant and extinct taxa (Winter
1990). For example, Sellers and Manning (2007)
used estimated mass properties to conduct a
for-ward simulation of locomotion with the aim of
pre-dicting the maximum running speed of Allosaurus.
A subsequent sensitivity analysis tested for the
effect of these estimated mass properties on
pre-dicted running speed by individually substituting
initial values for numbers sampled from the range
of published estimates for Allosaurus, in addition to
data from extant vertebrates (Bates et al. in press).
The volumetric reconstructions and sensitivity
analysis presented here suggest the range of mass
values tested in this former study far exceed the
plausible range for an Allosaurus of the skeletal
dimensions used. Of particular significance are the
leg-to-trunk volume ratios obtained here for
Allo-saurus (Appendix: Table 24), which support earlier
inferences that medium to large non-avian
thero-pods are likely to have a lower proportion of total
body mass as hind limb muscle than extant avian
bipeds (Hutchinson et al. 2007; Bates et al. 2009;
see Paul 1998, 2008 for contrary arguments).
Bates et al. (in press) tested muscle force values
FIGURE 4. Sensitivity analysis of osteological articulations in MOR 693. (1) Schematic diagrams of the reconstructed
thoracic outline and respiratory structure around the seventh dorsal rib with the mediolateral orientation of the rib
cage reduced (left) and increased (right) by 10 degrees relative to the skeletal mount of MOR 693 (centre). (2) Trunk
volume reconstruction with inter-vertebral spacing increased by 5 mm (grey) with the best estimate reconstruction
(black) shown for comparison.
equivalent to values for the muscle mass of a
sin-gle hind limb between 11.93 – 33.78% total body
mass for Allosaurus. Although the minimum value
falls close to that suggested in this study, the
maxi-mum value far exceeds the plausible ratio based
on volumetric reconstructions (Appendix: Table
24). Reconstructing MOR 693 with the largest leg
volumes (plus 15%) and smallest trunk volume
(minus 7.5%) yields a hind limb volume equivalent
to 17.79% total body mass, the highest value
pos-sible using the reconstructions presented here.
This significantly reduces the uncertainty in running
performance in Allosaurus resulting from unknown
muscle mass values. Although an increase in
sophistication and anatomical realism of these
‘evolutionary robotic’ models may yield predictions
of higher locomotor performance for dinosaurs, the
results presented here cast doubt on speeds
above 8 m/s for Allosaurus based on current
simu-lations (but see Bates et al. in press for discussion
of uncertainty resulting from unknown physiological
factors).
CONCLUSIONS
This study confirms yet expands upon the
results of the few previous sensitivity analyses
per-formed on volumetric reconstructions of non-avian
dinosaurs; body mass and inertial values are highly
uncertain and show a wide range in plausible
val-ues, whilst the CM position is well constrained
immediately in front and below the hip joint
(Hen-derson 1999; Hutchinson et al. 2007; Bates et al.
2009). This analysis is the first to demonstrate the
relatively modest effect of re-articulating poorly
constrained osteological articulations on mass
pre-dictions. Increasing inter-vertebral spacing had a
modest effect on total body mass and similarly little
effect on CM position (as spacing anterior and
pos-terior to the CM were increased), while the impact
of altering the mediolateral orientation of the rib
cage was largely negated by the necessary
con-comitant changes to the size of respiratory
struc-tures.
In addition to highlighting the importance of
sensitivity analyses in soft tissue reconstructions of
extinct taxa, these studies also provide the
numeri-cal data necessary for more robust evaluation of
dinosaur anatomy. For example, whilst it is
possi-ble to postulate very large body masses for
non-avian dinosaurs from volumetric reconstructions,
these are only plausible if the skeleton is strong
enough to withstand the forces generated during
minimal locomotor exertion (e.g., walking, standing
up). Although beyond the scope of this study, data
generated from sensitivity analyses such as that
reported here must subsequently be assessed in a
functional context to further constrain plausible
mass properties of non-avian dinosaurs.
ACKNOWLEDGMENTS
This research was funded by PhD
student-ships from the Natural Environment Research
FIGURE 5. Whole body CM positions for all models of MOR 693 produced in the sensitivity analysis . The CM
posi-tions of all models are closely clustered together in a region in front and below the hip joint. The most anterior CM is
where tail reconstruction is smallest (-7.5%) and thoracic/neck reconstructions are maximum (+15%), and the most
posterior CM is where the tail reconstruction is largest (+15%), and torso reconstructions are smallest (-7.5%).
Council (UK) to KTB (NER/S/A/2006/14101) and
PLF (NER/S/A/2006/14033), with additional
fund-ing to KTB from the Jurassic Foundation and the
Palaeontological Association Sylvester-Bradley
Award. The Museum of the Rockies and the
Bureau of Land Management are thanked for their
help excavating and casting Big Al. The authors
thank the editors, particularly Mark Purnell, and
two anonymous reviewers for their comments,
which greatly improved the final manuscript.
REFERENCES
Alexander, R.M. 1985. Mechanics of gait and posture of
some large dinosaurs, Zoological Journal of the
Lin-nean Society, 83:1-25.
Alexander, R.M. 1989. Dynamics of Dinosaurs and Other
Extinct Giants. Columbia University Press, New York.
Alexander, R.M. 2006. Dinosaur biomechanics,
Pro-ceedings of the Royal Society of London B,
273:1849-1855.
Bates K.T., Manning, P.L., Hodgetts, D., and Sellers,
W.I. 2009. Estimating the mass properties of
dino-saurs using laser imaging and 3D computer
model-ing, PLoS ONE 4(2):e4532 doi:10.1371.
Bates, K.T., Manning, P.L., Margetts, L., and Sellers, W.I.
In press. Sensitivity analysis in evolutionary robotic
simulations of bipedal dinosaur running. Journal of
Vertebrate Paleontology 30(1).
Breithaupt,B.H. (2001) The case of "Big Al" the
Allosau-rus: a study in paleodetective partnerships, p. 95-106
In Santucci, V.L. andMcClelland, L. (eds.)
Proceed-ings of the 6th Fossil Resource Conference (National
Park Service, U.S. Department of the Interior,
Geo-logic Resources Division Technical Report (NPS/
NRGRD/GRDTR-01/01) p. 226.
Claessens, L.P.A.M. 2004. Dinosaur gastralia: Origin,
morphology, and function, Journal of Vertebrate
Paleontology, 24:90-106.
Colbert, E.H. 1962. The weights of dinosaurs, American.
Mus. Novit., 2181:1-24.
Farlow, J.O., Smith, M.B., and Robinson, J.M. 1995.
Body mass, bone ‘strength indicator’ and cursorial
potential of Tyrannosaurus rex, Journal of Vertebrate
Paleontology, 15:713-725.
Gatesy, S.M. 1990. Caudofemoralis musculature and the
evolution of theropod locomotion, Paleobiology,
16:170-186.
Gatesy, S.M. 1995. Functional evolution of the hindlimb
and tail from basal theropods to birds, p. 219-234. In
Thomason, J.J. (ed.), Functional Morphology in
Ver-tebrate Paleontology. Cambridge University Press,
Cambridge, UK.
Gierlinski G., Lockley, M., and Milner, A.R.C. 2005.
Traces of early Jurassic crouching dinosaurs, p. 4. In
Proceedings of Tracking Dinosaur Origins, Dixie
State College, St. George, Utah.
Henderson, D.M. 1999. Estimating the Masses and
Cen-ters of Masses of Extinct Animals by 3-D
Mathemati-cal Slicing, Paleobiology, 25:88-106.
Henderson, D.M. and Snively, E. 2003. Tyrannosaurus
en pointe: allometry minimized rotational inertia of
large carnivorous dinosaurs, Proceedings of the
Royal Society of London B Supplement: Biology
Let-ters 271:S57-S60.
Hutchinson, J.R. 2001. The evolution of pelvic osteology
and soft tissues on the line to extant birds
(Neorni-thes), Zoological Journal of the Linnean Society,
131:123-168.
Hutchinson J.R., Thow-Hing, V.Ng., and Anderson, F.C.
2007. A 3D interactive method for estimating body
segmental parameters in animals: application to the
turning and running performance of Tyrannosaurus
rex, Journal of Theoretical Biology, 246:660-680.
Madsen, J.H. 1976. Allosaurus fragilis: A revised
osteol-ogy. Bulletin 109 Utah Geological Survey, pp. 163.
O’Connor, P.M. and Claessens, L.P.A.M. 2005. Basic
avian pulmonary design and flow-ventilation in
non-avian theropod dinosaurs, Nature, 436:253-256.
Paul, G.S. 1998. Limb design, function and running
per-formance in ostrich-mimics and Tyrannosaurs, Gaia,
15:257-270.
Paul, G.S. 2008. The Extreme Lifestyles and Habits of
the Gigantic Tyrannosaurid Superpredators of the
Late Cretaceous of North America and Asia, p.
307-354. In Larson, P. and Carpenter, K. (eds.),
Tyranno-saurus Rex, The Tyrant King. Indiana University
Press, Bloomington.
Perry, S.F. 1983. Reptilian lungs: functional anatomy and
evolution, Advances in Anatomy, Embryology, and
Cell Biology, 79:1-81.
Sellers, W.I. and P.L. Manning, 2007. Estimating
dino-saur maximum running speeds using evolutionary
robotics. Proceedings of the Royal Society B 274
:2711-2716.
Snively, E. and Russell, A.P. 2007. Functional variation
of neck muscles and their relation to feeding style in
Tyrannosauridae and other large theropod dinosaurs,
The Anatomical Record, 290:934-957.
Winter, DA. 1990. Biomechanics and motor control of
human movement. John Wiley and Sons, New York,
APPENDIX
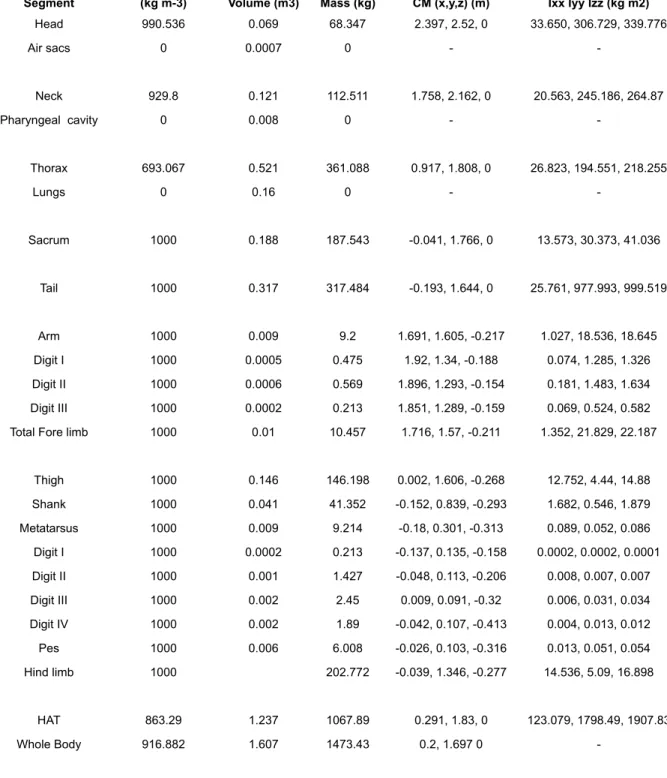
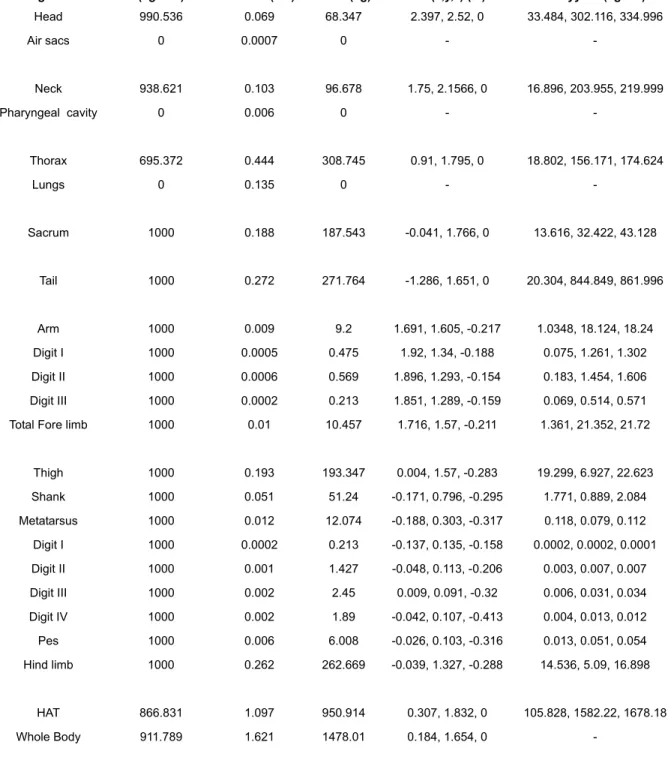
Table 2. Results for the best estimate model of MOR 693.
Segment Net Density (kg m-3)
Volume (m3)
Mass
(kg) CM (x,y,z) (m) Ixx Iyy Izz (kg m2)
Head 990.536 0.069 68.347 2.397, 2.52, 0 34.083, 301.742, 335.221 Air sacs 0 0.0007 0 - -Neck 946.09 0.121 114.477 1.758, 2.160, 0 21.471, 243.96, 263.925 Pharyngeal cavity 0 0.006 0 - -Thorax 742.04 0.521 386.603 0.917, 1.796, 0 29.796, 199.55, 221.557 Lungs 0 0.135 0 - -Sacrum 1000 0.188 187.543 -0.041, 1.766, 0 13.467, 32.593, 43.15 Tail 1000 0.317 317.484 -0.193, 1.644, 0 25.228, 995.577, 1016.57 Arm 1000 0.009 9.2 1.691, 1.605, -0.217 1.009, 18.091, 18.181 Digit I 1000 0.0005 0.475 1.92, 1.34, -0.188 0.072, 1.259, 1.297 Digit II 1000 0.0006 0.569 1.896, 1.293, -0.154 0.179, 1.451, 1.599 Digit III 1000 0.0002 0.213 1.851, 1.289, -0.159 0.068, 0.513, 0.569 Total Fore limb 1000 0.01 10.457 1.716, 1.57, -0.211 1.327, 21.314, 21.645
Thigh 1000 0.146 146.198 0.002, 1.606, -0.268 12.752, 4.44, 14.88 Shank 1000 0.041 41.352 -0.152, 0.839, -0.293 1.682, 0.546, 1.879 Metatarsus 1000 0.009 9.214 -0.18, 0.301, -0.313 0.089, 0.052, 0.086 Digit I 1000 0.0002 0.213 -0.137, 0.135, -0.158 0.0002, 0.0002, 0.0001 Digit II 1000 0.001 1.427 -0.048, 0.113, -0.206 0.008, 0.007, 0.007 Digit III 1000 0.002 2.45 0.009, 0.091, -0.32 0.006, 0.031, 0.034 Digit IV 1000 0.002 1.89 -0.042, 0.107, -0.413 0.004, 0.013, 0.012 Pes 1000 0.006 6.008 -0.026, 0.103, -0.316 0.013, 0.051, 0.054 Hind limb 1000 0.202 202.772 -0.039, 1.346, -0.277 14.536, 5.09, 16.898 HAT 885.5 1.237 1095.37 0.3081, 1.826, 0 126.701, 1816.05, 1923.72 Whole Body 933.983 1.607 1500.91 0.214, 1.696, 0
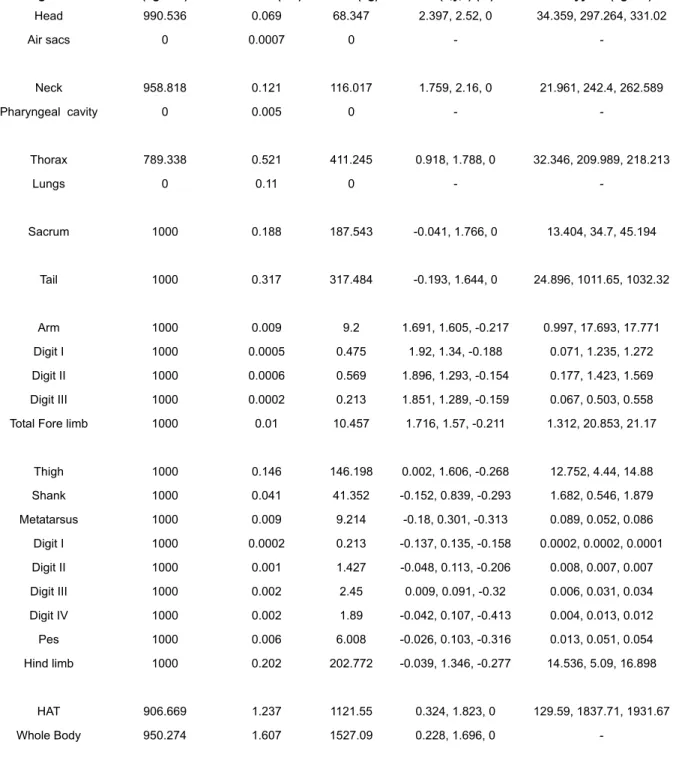
-Table 3. Results for the best estimate model of MOR 693 with enlarged respiratory structures.
Segment
Net Density
(kg m-3) Volume (m3) Mass (kg) CM (x,y,z) (m) Ixx Iyy Izz (kg m2)
Head 990.536 0.069 68.347 2.397, 2.52, 0 33.650, 306.729, 339.776 Air sacs 0 0.0007 0 - -Neck 929.8 0.121 112.511 1.758, 2.162, 0 20.563, 245.186, 264.87 Pharyngeal cavity 0 0.008 0 - -Thorax 693.067 0.521 361.088 0.917, 1.808, 0 26.823, 194.551, 218.255 Lungs 0 0.16 0 - -Sacrum 1000 0.188 187.543 -0.041, 1.766, 0 13.573, 30.373, 41.036 Tail 1000 0.317 317.484 -0.193, 1.644, 0 25.761, 977.993, 999.519 Arm 1000 0.009 9.2 1.691, 1.605, -0.217 1.027, 18.536, 18.645 Digit I 1000 0.0005 0.475 1.92, 1.34, -0.188 0.074, 1.285, 1.326 Digit II 1000 0.0006 0.569 1.896, 1.293, -0.154 0.181, 1.483, 1.634 Digit III 1000 0.0002 0.213 1.851, 1.289, -0.159 0.069, 0.524, 0.582 Total Fore limb 1000 0.01 10.457 1.716, 1.57, -0.211 1.352, 21.829, 22.187
Thigh 1000 0.146 146.198 0.002, 1.606, -0.268 12.752, 4.44, 14.88 Shank 1000 0.041 41.352 -0.152, 0.839, -0.293 1.682, 0.546, 1.879 Metatarsus 1000 0.009 9.214 -0.18, 0.301, -0.313 0.089, 0.052, 0.086 Digit I 1000 0.0002 0.213 -0.137, 0.135, -0.158 0.0002, 0.0002, 0.0001 Digit II 1000 0.001 1.427 -0.048, 0.113, -0.206 0.008, 0.007, 0.007 Digit III 1000 0.002 2.45 0.009, 0.091, -0.32 0.006, 0.031, 0.034 Digit IV 1000 0.002 1.89 -0.042, 0.107, -0.413 0.004, 0.013, 0.012 Pes 1000 0.006 6.008 -0.026, 0.103, -0.316 0.013, 0.051, 0.054 Hind limb 1000 202.772 -0.039, 1.346, -0.277 14.536, 5.09, 16.898 HAT 863.29 1.237 1067.89 0.291, 1.83, 0 123.079, 1798.49, 1907.83 Whole Body 916.882 1.607 1473.43 0.2, 1.697 0
-Table 4. Results for the best estimate model of MOR 693 with reduced respiratory structures.
Segment
Net Density
(kg m-3) Volume (m3) Mass (kg) CM (x,y,z) (m) Ixx Iyy Izz (kg m2)
Head 990.536 0.069 68.347 2.397, 2.52, 0 34.359, 297.264, 331.02 Air sacs 0 0.0007 0 - -Neck 958.818 0.121 116.017 1.759, 2.16, 0 21.961, 242.4, 262.589 Pharyngeal cavity 0 0.005 0 - -Thorax 789.338 0.521 411.245 0.918, 1.788, 0 32.346, 209.989, 218.213 Lungs 0 0.11 0 - -Sacrum 1000 0.188 187.543 -0.041, 1.766, 0 13.404, 34.7, 45.194 Tail 1000 0.317 317.484 -0.193, 1.644, 0 24.896, 1011.65, 1032.32 Arm 1000 0.009 9.2 1.691, 1.605, -0.217 0.997, 17.693, 17.771 Digit I 1000 0.0005 0.475 1.92, 1.34, -0.188 0.071, 1.235, 1.272 Digit II 1000 0.0006 0.569 1.896, 1.293, -0.154 0.177, 1.423, 1.569 Digit III 1000 0.0002 0.213 1.851, 1.289, -0.159 0.067, 0.503, 0.558 Total Fore limb 1000 0.01 10.457 1.716, 1.57, -0.211 1.312, 20.853, 21.17
Thigh 1000 0.146 146.198 0.002, 1.606, -0.268 12.752, 4.44, 14.88 Shank 1000 0.041 41.352 -0.152, 0.839, -0.293 1.682, 0.546, 1.879 Metatarsus 1000 0.009 9.214 -0.18, 0.301, -0.313 0.089, 0.052, 0.086 Digit I 1000 0.0002 0.213 -0.137, 0.135, -0.158 0.0002, 0.0002, 0.0001 Digit II 1000 0.001 1.427 -0.048, 0.113, -0.206 0.008, 0.007, 0.007 Digit III 1000 0.002 2.45 0.009, 0.091, -0.32 0.006, 0.031, 0.034 Digit IV 1000 0.002 1.89 -0.042, 0.107, -0.413 0.004, 0.013, 0.012 Pes 1000 0.006 6.008 -0.026, 0.103, -0.316 0.013, 0.051, 0.054 Hind limb 1000 0.202 202.772 -0.039, 1.346, -0.277 14.536, 5.09, 16.898 HAT 906.669 1.237 1121.55 0.324, 1.823, 0 129.59, 1837.71, 1931.67 Whole Body 950.274 1.607 1527.09 0.228, 1.696, 0
-Table 5. Results for the best estimate model of MOR 693 with an abdominal air sac.
Segment
Net Density
(kg m-3) Volume (m3) Mass (kg) CM (x,y,z) (m) Ixx Iyy Izz (kg m2)
Head 990.536 0.069 68.347 2.397, 2.52, 0 33.639, 304.463, 337.498 Air sacs 0 0.0007 0 - -Neck 946.09 0.121 116.017 1.759, 2.16, 0 21.114, 247.127, 266.734 Pharyngeal cavity 0 0.006 0 - -Thorax 715.15 0.521 372.593 0.913, 1.808, 0 27.617, 196.254, 216.182 Lungs 0 0.135 0 -
-Abdominal air sac 0 0.014 0 -
-Sacrum 1000 0.188 187.543 -0.041, 1.766, 0 13.576, 31.365, 42.031 Tail 1000 0.317 317.484 -0.193, 1.644, 0 25.776, 985.939, 1007.48 Arm 1000 0.009 9.2 1.691, 1.605, -0.217 1.028, 18.334, 18.443 Digit I 1000 0.0005 0.475 1.92, 1.34, -0.188 0.074, 1.273, 1.314 Digit II 1000 0.0006 0.569 1.896, 1.293, -0.154 0.182, 1.468, 1.62 Digit III 1000 0.0002 0.213 1.851, 1.289, -0.159 0.069, 0.519, 0.576 Total Fore limb 1000 0.01 10.457 1.716, 1.57, -0.211 1.353, 21.594, 21.953
Thigh 1000 0.146 146.198 0.002, 1.606, -0.268 12.752, 4.44, 14.88 Shank 1000 0.041 41.352 -0.152, 0.839, -0.293 1.682, 0.546, 1.879 Metatarsus 1000 0.009 9.214 -0.18, 0.301, -0.313 0.089, 0.052, 0.086 Digit I 1000 0.0002 0.213 -0.137, 0.135, -0.158 0.0002, 0.0002, 0.0001 Digit II 1000 0.001 1.427 -0.048, 0.113, -0.206 0.008, 0.007, 0.007 Digit III 1000 0.002 2.45 0.009, 0.091, -0.32 0.006, 0.031, 0.034 Digit IV 1000 0.002 1.89 -0.042, 0.107, -0.413 0.004, 0.013, 0.012 Pes 1000 0.006 6.008 -0.026, 0.103, -0.316 0.013, 0.051, 0.054 Hind limb 1000 0.202 202.772 -0.039, 1.346, -0.277 14.536, 5.09, 16.898 HAT 874.179 1.237 1081.36 0.299, 1.83, 0 124.429, 1808.34, 1913.83 Whole Body 925.264 1.607 1486.9 0.207, 1.698, 0
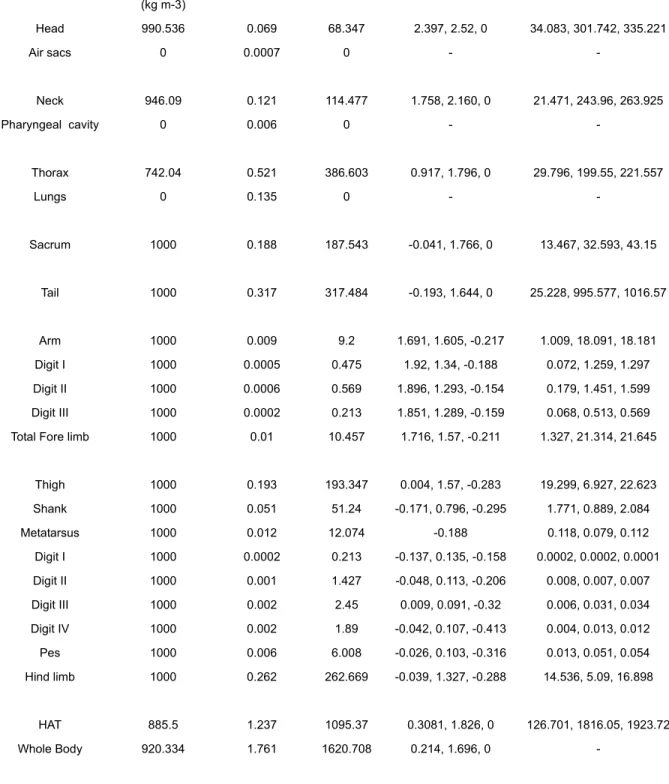
-Table 6. Results for the best estimate model of MOR 693 with enlarged (+15%) legs.
Segment Net Density(kg m-3)
Volume (m3) Mass (kg) CM (x,y,z) (m) Ixx Iyy Izz (kg m2) Head 990.536 0.069 68.347 2.397, 2.52, 0 34.083, 301.742, 335.221 Air sacs 0 0.0007 0 - -Neck 946.09 0.121 114.477 1.758, 2.160, 0 21.471, 243.96, 263.925 Pharyngeal cavity 0 0.006 0 - -Thorax 742.04 0.521 386.603 0.917, 1.796, 0 29.796, 199.55, 221.557 Lungs 0 0.135 0 - -Sacrum 1000 0.188 187.543 -0.041, 1.766, 0 13.467, 32.593, 43.15 Tail 1000 0.317 317.484 -0.193, 1.644, 0 25.228, 995.577, 1016.57 Arm 1000 0.009 9.2 1.691, 1.605, -0.217 1.009, 18.091, 18.181 Digit I 1000 0.0005 0.475 1.92, 1.34, -0.188 0.072, 1.259, 1.297 Digit II 1000 0.0006 0.569 1.896, 1.293, -0.154 0.179, 1.451, 1.599 Digit III 1000 0.0002 0.213 1.851, 1.289, -0.159 0.068, 0.513, 0.569 Total Fore limb 1000 0.01 10.457 1.716, 1.57, -0.211 1.327, 21.314, 21.645
Thigh 1000 0.193 193.347 0.004, 1.57, -0.283 19.299, 6.927, 22.623 Shank 1000 0.051 51.24 -0.171, 0.796, -0.295 1.771, 0.889, 2.084 Metatarsus 1000 0.012 12.074 -0.188 0.118, 0.079, 0.112 Digit I 1000 0.0002 0.213 -0.137, 0.135, -0.158 0.0002, 0.0002, 0.0001 Digit II 1000 0.001 1.427 -0.048, 0.113, -0.206 0.008, 0.007, 0.007 Digit III 1000 0.002 2.45 0.009, 0.091, -0.32 0.006, 0.031, 0.034 Digit IV 1000 0.002 1.89 -0.042, 0.107, -0.413 0.004, 0.013, 0.012 Pes 1000 0.006 6.008 -0.026, 0.103, -0.316 0.013, 0.051, 0.054 Hind limb 1000 0.262 262.669 -0.039, 1.327, -0.288 14.536, 5.09, 16.898 HAT 885.5 1.237 1095.37 0.3081, 1.826, 0 126.701, 1816.05, 1923.72 Whole Body 920.334 1.761 1620.708 0.214, 1.696, 0
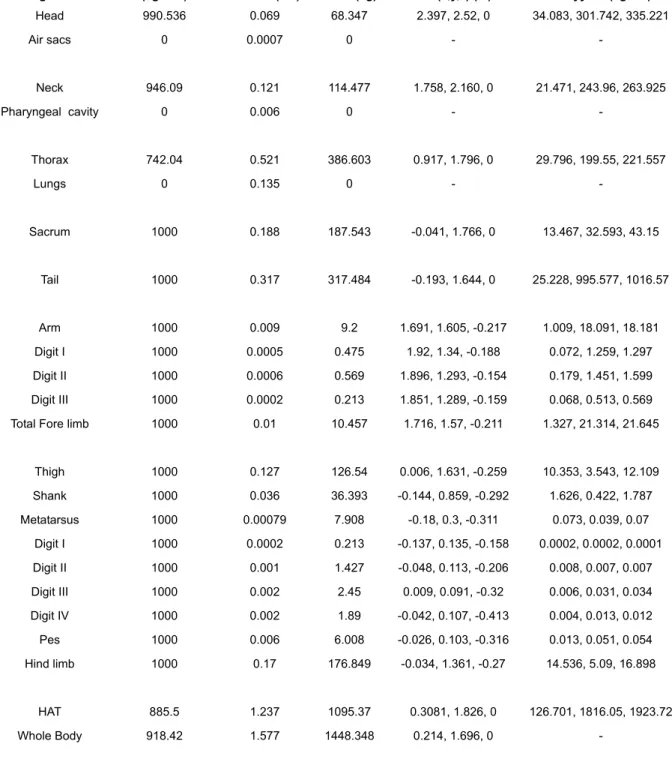
-Table 7. Results for the best estimate model of MOR 693 with reduced (- 7.5%) legs.
Segment
Net Density
(kg m-3) Volume (m3) Mass (kg) CM (x,y,z) (m) Ixx Iyy Izz (kg m2)
Head 990.536 0.069 68.347 2.397, 2.52, 0 34.083, 301.742, 335.221 Air sacs 0 0.0007 0 - -Neck 946.09 0.121 114.477 1.758, 2.160, 0 21.471, 243.96, 263.925 Pharyngeal cavity 0 0.006 0 - -Thorax 742.04 0.521 386.603 0.917, 1.796, 0 29.796, 199.55, 221.557 Lungs 0 0.135 0 - -Sacrum 1000 0.188 187.543 -0.041, 1.766, 0 13.467, 32.593, 43.15 Tail 1000 0.317 317.484 -0.193, 1.644, 0 25.228, 995.577, 1016.57 Arm 1000 0.009 9.2 1.691, 1.605, -0.217 1.009, 18.091, 18.181 Digit I 1000 0.0005 0.475 1.92, 1.34, -0.188 0.072, 1.259, 1.297 Digit II 1000 0.0006 0.569 1.896, 1.293, -0.154 0.179, 1.451, 1.599 Digit III 1000 0.0002 0.213 1.851, 1.289, -0.159 0.068, 0.513, 0.569 Total Fore limb 1000 0.01 10.457 1.716, 1.57, -0.211 1.327, 21.314, 21.645
Thigh 1000 0.127 126.54 0.006, 1.631, -0.259 10.353, 3.543, 12.109 Shank 1000 0.036 36.393 -0.144, 0.859, -0.292 1.626, 0.422, 1.787 Metatarsus 1000 0.00079 7.908 -0.18, 0.3, -0.311 0.073, 0.039, 0.07 Digit I 1000 0.0002 0.213 -0.137, 0.135, -0.158 0.0002, 0.0002, 0.0001 Digit II 1000 0.001 1.427 -0.048, 0.113, -0.206 0.008, 0.007, 0.007 Digit III 1000 0.002 2.45 0.009, 0.091, -0.32 0.006, 0.031, 0.034 Digit IV 1000 0.002 1.89 -0.042, 0.107, -0.413 0.004, 0.013, 0.012 Pes 1000 0.006 6.008 -0.026, 0.103, -0.316 0.013, 0.051, 0.054 Hind limb 1000 0.17 176.849 -0.034, 1.361, -0.27 14.536, 5.09, 16.898 HAT 885.5 1.237 1095.37 0.3081, 1.826, 0 126.701, 1816.05, 1923.72 Whole Body 918.42 1.577 1448.348 0.214, 1.696, 0
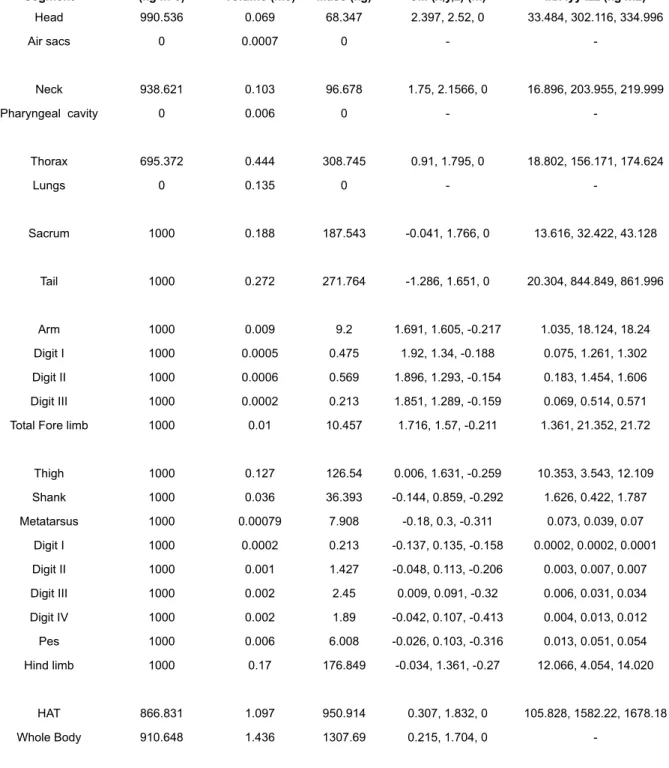
-Table 8. Results for the - 7.5% best estimate model of MOR 693.
Segment
Net Density
(kg m-3) Volume (m3) Mass (kg) CM (x,y,z) (m) Ixx Iyy Izz (kg m2)
Head 990.536 0.069 68.347 2.397, 2.52, 0 33.484, 302.116, 334.996 Air sacs 0 0.0007 0 - -Neck 938.621 0.103 96.678 1.75, 2.1566, 0 16.896, 203.955, 219.999 Pharyngeal cavity 0 0.006 0 - -Thorax 695.372 0.444 308.745 0.91, 1.795, 0 18.802, 156.171, 174.624 Lungs 0 0.135 0 - -Sacrum 1000 0.188 187.543 -0.041, 1.766, 0 13.616, 32.422, 43.128 Tail 1000 0.272 271.764 -1.286, 1.651, 0 20.304, 844.849, 861.996 Arm 1000 0.009 9.2 1.691, 1.605, -0.217 1.035, 18.124, 18.24 Digit I 1000 0.0005 0.475 1.92, 1.34, -0.188 0.075, 1.261, 1.302 Digit II 1000 0.0006 0.569 1.896, 1.293, -0.154 0.183, 1.454, 1.606 Digit III 1000 0.0002 0.213 1.851, 1.289, -0.159 0.069, 0.514, 0.571 Total Fore limb 1000 0.01 10.457 1.716, 1.57, -0.211 1.361, 21.352, 21.72
Thigh 1000 0.127 126.54 0.006, 1.631, -0.259 10.353, 3.543, 12.109 Shank 1000 0.036 36.393 -0.144, 0.859, -0.292 1.626, 0.422, 1.787 Metatarsus 1000 0.00079 7.908 -0.18, 0.3, -0.311 0.073, 0.039, 0.07 Digit I 1000 0.0002 0.213 -0.137, 0.135, -0.158 0.0002, 0.0002, 0.0001 Digit II 1000 0.001 1.427 -0.048, 0.113, -0.206 0.003, 0.007, 0.007 Digit III 1000 0.002 2.45 0.009, 0.091, -0.32 0.006, 0.031, 0.034 Digit IV 1000 0.002 1.89 -0.042, 0.107, -0.413 0.004, 0.013, 0.012 Pes 1000 0.006 6.008 -0.026, 0.103, -0.316 0.013, 0.051, 0.054 Hind limb 1000 0.17 176.849 -0.034, 1.361, -0.27 12.066, 4.054, 14.020 HAT 866.831 1.097 950.914 0.307, 1.832, 0 105.828, 1582.22, 1678.18 Whole Body 910.648 1.436 1307.69 0.215, 1.704, 0
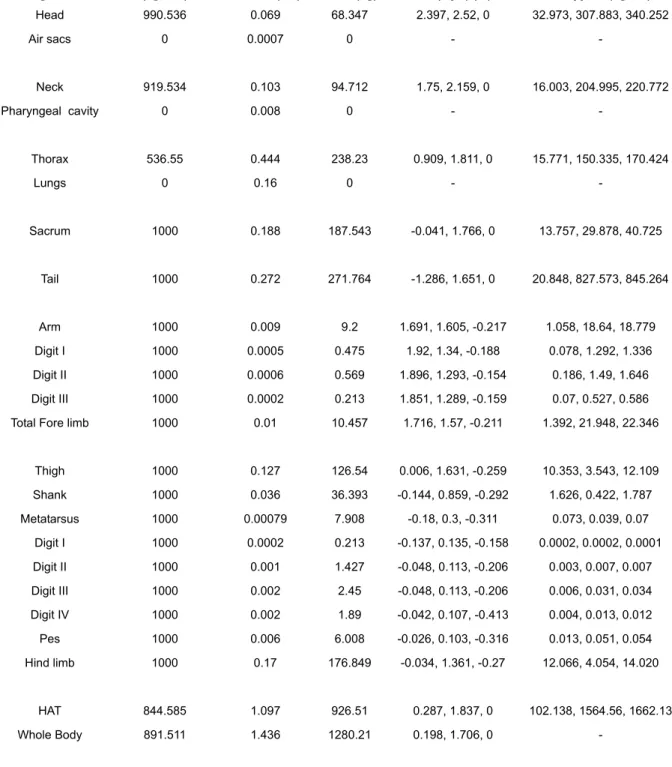
-Table 9. Results for the - 7.5% best estimate model of MOR 693 with enlarged lungs.
Segment
Net Density
(kg m-3) Volume (m3) Mass (kg) CM (x,y,z) (m) Ixx Iyy Izz (kg m2)
Head 990.536 0.069 68.347 2.397, 2.52, 0 32.973, 307.883, 340.252 Air sacs 0 0.0007 0 - -Neck 919.534 0.103 94.712 1.75, 2.159, 0 16.003, 204.995, 220.772 Pharyngeal cavity 0 0.008 0 - -Thorax 536.55 0.444 238.23 0.909, 1.811, 0 15.771, 150.335, 170.424 Lungs 0 0.16 0 - -Sacrum 1000 0.188 187.543 -0.041, 1.766, 0 13.757, 29.878, 40.725 Tail 1000 0.272 271.764 -1.286, 1.651, 0 20.848, 827.573, 845.264 Arm 1000 0.009 9.2 1.691, 1.605, -0.217 1.058, 18.64, 18.779 Digit I 1000 0.0005 0.475 1.92, 1.34, -0.188 0.078, 1.292, 1.336 Digit II 1000 0.0006 0.569 1.896, 1.293, -0.154 0.186, 1.49, 1.646 Digit III 1000 0.0002 0.213 1.851, 1.289, -0.159 0.07, 0.527, 0.586 Total Fore limb 1000 0.01 10.457 1.716, 1.57, -0.211 1.392, 21.948, 22.346
Thigh 1000 0.127 126.54 0.006, 1.631, -0.259 10.353, 3.543, 12.109 Shank 1000 0.036 36.393 -0.144, 0.859, -0.292 1.626, 0.422, 1.787 Metatarsus 1000 0.00079 7.908 -0.18, 0.3, -0.311 0.073, 0.039, 0.07 Digit I 1000 0.0002 0.213 -0.137, 0.135, -0.158 0.0002, 0.0002, 0.0001 Digit II 1000 0.001 1.427 -0.048, 0.113, -0.206 0.003, 0.007, 0.007 Digit III 1000 0.002 2.45 -0.048, 0.113, -0.206 0.006, 0.031, 0.034 Digit IV 1000 0.002 1.89 -0.042, 0.107, -0.413 0.004, 0.013, 0.012 Pes 1000 0.006 6.008 -0.026, 0.103, -0.316 0.013, 0.051, 0.054 Hind limb 1000 0.17 176.849 -0.034, 1.361, -0.27 12.066, 4.054, 14.020 HAT 844.585 1.097 926.51 0.287, 1.837, 0 102.138, 1564.56, 1662.13 Whole Body 891.511 1.436 1280.21 0.198, 1.706, 0
-Table 10. Results for the - 7.5% model of MOR 693 with enlarged (+ 15%) legs.
Segment
Net Density
(kg m-3) Volume (m3) Mass (kg) CM (x,y,z) (m) Ixx Iyy Izz (kg m2)
Head 990.536 0.069 68.347 2.397, 2.52, 0 33.484, 302.116, 334.996 Air sacs 0 0.0007 0 - -Neck 938.621 0.103 96.678 1.75, 2.1566, 0 16.896, 203.955, 219.999 Pharyngeal cavity 0 0.006 0 - -Thorax 695.372 0.444 308.745 0.91, 1.795, 0 18.802, 156.171, 174.624 Lungs 0 0.135 0 - -Sacrum 1000 0.188 187.543 -0.041, 1.766, 0 13.616, 32.422, 43.128 Tail 1000 0.272 271.764 -1.286, 1.651, 0 20.304, 844.849, 861.996 Arm 1000 0.009 9.2 1.691, 1.605, -0.217 1.0348, 18.124, 18.24 Digit I 1000 0.0005 0.475 1.92, 1.34, -0.188 0.075, 1.261, 1.302 Digit II 1000 0.0006 0.569 1.896, 1.293, -0.154 0.183, 1.454, 1.606 Digit III 1000 0.0002 0.213 1.851, 1.289, -0.159 0.069, 0.514, 0.571 Total Fore limb 1000 0.01 10.457 1.716, 1.57, -0.211 1.361, 21.352, 21.72
Thigh 1000 0.193 193.347 0.004, 1.57, -0.283 19.299, 6.927, 22.623 Shank 1000 0.051 51.24 -0.171, 0.796, -0.295 1.771, 0.889, 2.084 Metatarsus 1000 0.012 12.074 -0.188, 0.303, -0.317 0.118, 0.079, 0.112 Digit I 1000 0.0002 0.213 -0.137, 0.135, -0.158 0.0002, 0.0002, 0.0001 Digit II 1000 0.001 1.427 -0.048, 0.113, -0.206 0.003, 0.007, 0.007 Digit III 1000 0.002 2.45 0.009, 0.091, -0.32 0.006, 0.031, 0.034 Digit IV 1000 0.002 1.89 -0.042, 0.107, -0.413 0.004, 0.013, 0.012 Pes 1000 0.006 6.008 -0.026, 0.103, -0.316 0.013, 0.051, 0.054 Hind limb 1000 0.262 262.669 -0.039, 1.327, -0.288 14.536, 5.09, 16.898 HAT 866.831 1.097 950.914 0.307, 1.832, 0 105.828, 1582.22, 1678.18 Whole Body 911.789 1.621 1478.01 0.184, 1.654, 0
-Table 11. Results for the + 7.5% best estimate model of MOR 693.
Segment
Net Density
(kg m-3) Volume (m3) Mass (kg) CM (x,y,z) (m) Ixx Iyy Izz (kg m2)
Head 990.536 0.069 68.347 2.397, 2.52, 0 34.807, 303.668, 337.871 Air sacs 0 0.0007 0 - -Neck 953.717 0.138 131.613 1.76, 2.159, 0 25.907, 284.315, 307.945 Pharyngeal cavity 0 0.006 0 - -Thorax 776.723 0.606 470.694 0.924, 1.795, 0 43.554, 252.364, 278.902 Lungs 0 0.135 0 - -Sacrum 1000 0.194 193.893 -0.046, 1.769, 0 14.171, 33.747, 44.833 Tail 1000 0.369 369.534 -1.297, 1.636, 0 31.342, 1156.42, 1182.02 Arm 1000 0.009 9.2 1.691, 1.605, -0.217 0.978, 18.263, 18.322 Digit I 1000 0.0005 0.475 1.92, 1.34, -0.188 0.069, 1.269, 1.304 Digit II 1000 0.0006 0.569 1.896, 1.293, -0.154 0.174, 1.463, 1.607 Digit III 1000 0.0002 0.213 1.851, 1.289, -0.159 0.066, 0.517, 0.572 Total Fore limb 1000 0.01 10.457 1.716, 1.57, -0.211 1.287, 21.512, 21.805
Thigh 1000 0.163 162.792 0.001, 1.584, -0.273 15.125, 5.224, 17.607 Shank 1000 0.046 46.104 -0.16, 0.819, -0.295 1.716, 0.694, 1.959 Metatarsus 1000 0.106, 0.068, 0.101 Digit I 1000 0.0002 0.213 -0.137, 0.135, -0.158 0.0002, 0.0002, 0.0001 Digit II 1000 0.001 1.427 -0.048, 0.113, -0.206 0.003, 0.007, 0.007 Digit III 1000 0.002 2.45 0.009, 0.091, -0.32 0.006, 0.03, 0.034 Digit IV 1000 0.002 1.89 -0.042, 0.107, -0.413 0.004, 0.013, 0.012 Pes 1000 0.006 6.008 -0.026, 0.103, -0.316 0.013, 0.051, 0.054 Hind limb 1000 0.226 225.488 -0.041, 1.328, -0.281 16.96, 6.038, 19.721 HAT 876.879 1.397 1255 0.301, 1.818, 0 152.357, 2073.53, 2195.18 Whole Body 922.644 1.849 1705.97 0.211, 1.689, 0
-Table 12. Results for the + 11.25% best estimate model of MOR 693.
Segment
Net Density
(kg m-3) Volume (m3) Mass (kg) CM (x,y,z) (m) Ixx Iyy Izz (kg m2)
Head 990.536 0.069 68.347 2.397, 2.52, 0 35.083, 304.004, 338.483 Air sacs 0 0.0007 0 - -Neck 961.571 0.147 141.351 1.767, 2.169, 0 29.656, 308.481, 335.552 Pharyngeal cavity 0 0.006 0 - -Thorax 792.739 0.651 516.073 0.924, 1.794, 0 51.79, 278.915, 308.219 Lungs 0 0.135 0 - -Sacrum 1000 0.204 203.635 -0.045, 1.767, 0 16.838, 34.931, 48.675 Tail 1000 0.395 394.485 -1.302, 1.632, 0 34.66, 1239.91, 1268.12 Arm 1000 0.009 9.2 1.691, 1.605, -0.217 0.967, 18.293, 18.341 Digit I 1000 0.0005 0.475 1.92, 1.34, -0.188 0.067, 1.271, 1.305 Digit II 1000 0.0006 0.569 1.896, 1.293, -0.154 0.172, 1.465, 1.608 Digit III 1000 0.0002 0.213 1.851, 1.289, -0.159 0.065, 0.518, 0.572 Total Fore limb 1000 0.01 10.457 1.716, 1.57, -0.211 1.272, 21.547, 21.825
Thigh 1000 0.177 177.115 0.003, 1.583, -0.279 17.441, 5.896, 20.172 Shank 1000 0.049 48.712 -0.166, 0.806, -0.295 1.753, 0.786, 2.027 Metatarsus 1000 0.011 11.414 -0.181, 0.304, -0.316 0.118, 0.079, 0.112 Digit I 1000 0.0002 0.213 -0.137, 0.135, -0.158 0.0002, 0.0002, 0.0001 Digit II 1000 0.001 1.427 -0.048, 0.113, -0.206 0.003, 0.007, 0.007 Digit III 1000 0.002 2.45 0.009, 0.091, -0.32 0.006, 0.031, 0.03 Digit IV 1000 0.002 1.89 -0.042, 0.107, -0.413 0.004, 0.013, 0.012 Pes 1000 0.006 6.008 -0.026, 0.103, -0.316 0.013, 0.051, 0.054 Hind limb 1000 0.243 243.249 -0.04, 1.331, -0.285 19.325, 6.812, 22.365 HAT 904.378 1.487 1344.81 0.3, 1.815, 0 170.574, 2209.33, 2342.7 Whole Body 928.18 1.973 1831.3 0.21, 1.687, 0
-Table 13. Results for the + 15% best estimate model of MOR 693.
Segment
Net Density
(kg m-3) Volume (m3) Mass (kg) CM (x,y,z) (m) Ixx Iyy Izz (kg m2)
Head 990.536 0.069 68.347 2.397, 2.52, 0 35.217, 302.97, 337.582 Air sacs 0 0.0007 0 - -Neck 963.593 0.162 156.102 1.771, 2.168, 0 33.557, 341.362, 371.429 Pharyngeal cavity 0 0.006 0 - -Thorax 807.59 0.702 566.928 0.928, 1.793, 0 61.81, 308.161, 340.201 Lungs 0 0.135 0 - -Sacrum 1000 0.217 216.678 -0.049, 1.775, 0 19.247, 38.594, 54.342 Tail 1000 0.424 423.864 -1.299, 1.63, 0 38.711, 1332.79, 1363.99 Arm 1000 0.009 9.2 1.691, 1.605, -0.217 0.951, 18.19, 18.244 Digit I 1000 0.0005 0.475 1.92, 1.34, -0.188 0.066, 1.265, 1.298 Digit II 1000 0.0006 0.569 1.896, 1.293, -0.154 0.171, 1.458, 1.6 Digit III 1000 0.0002 0.213 1.851, 1.289, -0.159 0.065, 0.516, 0.569 Total Fore limb 1000 0.01 10.457 1.716, 1.57, -0.211 1.253, 21.428, 21.711
Thigh 1000 0.193 193.347 0.004, 1.57, -0.283 19.299, 6.927, 22.623 Shank 1000 0.051 51.24 -0.171, 0.796, -0.295 1.771, 0.889, 2.084 Metatarsus 1000 0.012 12.074 -0.188, 0.303, -0.317 0.118, 0.079, 0.112 Digit I 1000 0.0002 0.213 -0.137, 0.135, -0.158 0.0002, 0.0002, 0.0001 Digit II 1000 0.001 1.427 -0.048, 0.113, -0.206 0.003, 0.007, 0.007 Digit III 1000 0.002 2.45 0.009, 0.091, -0.32 0.006, 0.03, 0.03 Digit IV 1000 0.002 1.89 -0.042, 0.107, -0.413 0.004, 0.013, 0.012 Pes 1000 0.006 6.008 -0.026, 0.103, -0.316 0.013, 0.051, 0.054 Hind limb 1000 0.262 262.009 -0.039, 1.33, -0.288 21.201, 7.946, 24.872 HAT 910.865 1.595 1452.83 0.304, 1.814, 0 191.053, 2366.73, 2510.97 Whole Body 932.916 2.119 1976.85 0.213, 1.686, 0
-Table 14. Results for the + 15% best estimate model with reduced respiratory structures.
Segment
Net Density
(kg m-3) Volume (m3) Mass (kg) CM (x,y,z) (m) Ixx Iyy Izz (kg m2)
Head 990.536 0.069 68.347 2.397, 2.52, 0 35.41, 299.543, 334.348 Air sacs 0 0.0007 0 - -Neck 973.099 0.162 157.642 1.771, 2.168, 0 34.055, 339.557, 369.857 Pharyngeal cavity 0 0.005 0 - -Thorax 842.692 0.702 591.57 0.928, 1.788, 0 64.303, 317.734, 335.933 Lungs 0 0.11 0 - -Sacrum 1000 0.217 216.678 -0.049, 1.775, 0 19.214, 40.461, 56.177 Tail 1000 0.424 423.864 -1.299, 1.63, 0 38.402, 1349.17, 1380.06 Arm 1000 0.009 9.2 1.691, 1.605, -0.217 0.944, 17.885, 17.931 Digit I 1000 0.0005 0.475 1.92, 1.34, -0.188 0.065, 1.246, 1.279 Digit II 1000 0.0006 0.569 1.896, 1.293, -0.154 0.17, 1.437, 1.577 Digit III 1000 0.0002 0.213 1.851, 1.289, -0.159 0.064, 0.508, 0.561 Total Fore limb 1000 0.01 10.457 1.716, 1.57, -0.211 1.243, 21.075, 21.348
Thigh 1000 0.193 193.347 0.004, 1.57, -0.283 19.299, 6.927, 22.623 Shank 1000 0.051 51.24 -0.171, 0.796, -0.295 1.771, 0.889, 2.084 Metatarsus 1000 0.012 12.074 -0.188, 0.303, -0.317 0.118, 0.079, 0.112 Digit I 1000 0.0002 0.213 -0.137, 0.135, -0.158 0.0002, 0.0002, 0.0001 Digit II 1000 0.001 1.427 -0.048, 0.113, -0.206 0.003, 0.007, 0.007 Digit III 1000 0.002 2.45 0.009, 0.091, -0.32 0.006, 0.03, 0.03 Digit IV 1000 0.002 1.89 -0.042, 0.107, -0.413 0.004, 0.013, 0.012 Pes 1000 0.006 6.008 -0.026, 0.103, -0.316 0.013, 0.051, 0.054 Hind limb 1000 0.262 262.009 -0.039, 1.33, -0.288 21.201, 7.946, 24.872 HAT 927.279 1.595 1479.01 0.316, 1.811, 0 193.873, 2388.61, 2519.07 Whole Body 945.271 2.119 2003.03 0.223, 1.686, 0
-Table 15. Results for the + 15% best estimate model of MOR 693 with reduced (- 7.5%) legs.
Segment
Net Density
(kg m-3) Volume (m3) Mass (kg) CM (x,y,z) (m) Ixx Iyy Izz (kg m2)
Head 990.536 0.069 68.347 2.397, 2.52, 0 35.217, 302.97, 337.582 Air sacs 0 0.0007 0 - -Neck 963.593 0.162 156.102 1.771, 2.168, 0 33.557, 341.362, 371.429 Pharyngeal cavity 0 0.006 0 - -Thorax 807.59 0.702 566.928 0.928, 1.793, 0 61.81, 308.161, 340.201 Lungs 0 0.135 0 - -Sacrum 1000 0.217 216.678 -0.049, 1.775, 0 19.247, 38.594, 54.342 Tail 1000 0.424 423.864 -1.299, 1.63, 0 38.711, 1332.79, 1363.99 Arm 1000 0.009 9.2 1.691, 1.605, -0.217 0.951, 18.19, 18.244 Digit I 1000 0.0005 0.475 1.92, 1.34, -0.188 0.066, 1.265, 1.298 Digit II 1000 0.0006 0.569 1.896, 1.293, -0.154 0.171, 1.458, 1.6 Digit III 1000 0.0002 0.213 1.851, 1.289, -0.159 0.065, 0.516, 0.569 Total Fore limb 1000 0.01 10.457 1.716, 1.57, -0.211 1.253, 21.428, 21.711
Thigh 1000 0.127 126.54 0.006, 1.631, -0.259 10.353, 3.543, 12.109 Shank 1000 0.036 36.393 -0.144, 0.859, -0.292 1.626, 0.422, 1.787 Metatarsus 1000 0.00079 7.908 -0.18, 0.3, -0.311 0.073, 0.039, 0.07 Digit I 1000 0.0002 0.213 -0.137, 0.135, -0.158 0.0002, 0.0002, 0.0001 Digit II 1000 0.001 1.427 -0.048, 0.113, -0.206 0.003, 0.007, 0.007 Digit III 1000 0.002 2.45 0.009, 0.091, -0.32 0.006, 0.03, 0.03 Digit IV 1000 0.002 1.89 -0.042, 0.107, -0.413 0.004, 0.013, 0.012 Pes 1000 0.006 6.008 -0.026, 0.103, -0.316 0.013, 0.051, 0.054 Hind limb 1000 0.17 176.849 -0.034, 1.361, -0.27 12.066, 4.054, 14.020 HAT 910.865 1.595 1452.83 0.304, 1.814, 0 191.053, 2366.73, 2510.97 Whole Body 852.539 2.119 1806.53 0.238, 1.725, 0
-Table 16. Results for best estimate model of MOR 693 with + 15% tail and - 7.5% neck and thorax.
Segment
Net Density
(kg m-3) Volume (m3) Mass (kg) CM (x,y,z) (m) Ixx Iyy Izz (kg m2)
Head 990.536 0.069 68.347 2.397, 2.52, 0 36.674, 369.545, 405.615 Air sacs 0 0.0007 0 - -Neck 938.621 0.103 96.678 1.75, 2.157, 0 19.082, 271.325, 289.554 Pharyngeal cavity 0 0.006 0 - -Thorax 695.372 0.444 308.745 0.91, 1.795, 0 18.383, 255.038, 273.072 Lungs 0 0.135 0 - -Sacrum 1000 0.188 187.543 -0.041, 1.766, 0 13, 12.614, 22.706 Tail 1000 0.424 423.864 -1.299, 1.63, 0 36.47, 1053.25, 1082.22 Arm 1000 0.009 9.2 1.691, 1.605, -0.217 0.9066, 24.29, 24.278 Digit I 1000 0.0005 0.475 1.92, 1.34, -0.188 0.06, 1.628, 1.654 Digit II 1000 0.0006 0.569 1.896, 1.293, -0.154 0.163, 1.887, 2.02 Digit III 1000 0.0002 0.213 1.851, 1.289, -0.159 0.062, 0.672, 0.723 Total Fore limb 1000 0.01 10.457 1.716, 1.57, -0.211 1.191, 28.477, 28.674
Thigh 1000 0.146 146.198 0.002, 1.606, -0.268 12.752, 4.44, 14.88 Shank 1000 0.041 41.352 -0.152, 0.839, -0.293 1.682, 0.546, 1.879 Metatarsus 1000 0.009 9.214 -0.18, 0.301, -0.313 0.089, 0.052, 0.086 Digit I 1000 0.0002 0.213 -0.137, 0.135, -0.158 0.0002, 0.0002, 0.0001 Digit II 1000 0.001 1.427 -0.048, 0.113, -0.206 0.008, 0.007, 0.007 Digit III 1000 0.002 2.45 0.009, 0.091, -0.32 0.006, 0.031, 0.034 Digit IV 1000 0.002 1.89 -0.042, 0.107, -0.413 0.004, 0.013, 0.012 Pes 1000 0.006 6.008 -0.026, 0.103, -0.316 0.013, 0.051, 0.054 Hind limb 1000 0.202 202.772 -0.039, 1.346, -0.277 14.536, 5.09, 16.898 HAT 886.29 1.248 1106.09 0.083, 1.799, 0 126.701, 1816.05, 1923.72 Whole Body 915.03 1.652 1511.63 0.05, 1.677, 0
-Table 17. Results for best estimate model of MOR 693 with - 7.5% tail and + 15% neck and thorax.
Segment
Net Density
(kg m-3) Volume (m3) Mass (kg) CM (x,y,z) (m) Ixx Iyy Izz (kg m2)
Head 990.536 0.069 68.347 2.397, 2.52, 0 32.735, 199.988, 232.119 Air sacs 0 0.0007 0 - -Neck 963.593 0.162 156.102 1.771, 2.168, 0 30.765, 183.923, 211.201 Pharyngeal cavity 0 0.006 0 - -Thorax 807.59 0.702 566.928 0.928, 1.793, 0 62.825, 116.165, 149.228 Lungs 0 0.135 0 - -Sacrum 1000 0.188 187.543 -0.041, 1.766, 0 13.827, 66.166, 77.083 Tail 1000 0.272 271.764 -1.286, 1.651, 0 21.109, 1029.57, 1047.53 Arm 1000 0.009 9.2 1.691, 1.605, -0.217 1.069, 13.382, 13.532 Digit I 1000 0.0005 0.475 1.92, 1.34, -0.188 0.079, 0.73, 0.775 Digit II 1000 0.0006 0.569 1.896, 1.293, -0.154 0.188, 1.113, 1.271 Digit III 1000 0.0002 0.213 1.851, 1.289, -0.159 0.071, 0.39, 0.45 Total Fore limb 1000 0.01 10.457 1.716, 1.57, -0.211 1.406, 15.858, 16.27
Thigh 1000 0.146 146.198 0.002, 1.606, -0.268 12.752, 4.44, 14.88 Shank 1000 0.041 41.352 -0.152, 0.839, -0.293 1.682, 0.546, 1.879 Metatarsus 1000 0.009 9.214 -0.18, 0.301, -0.313 0.089, 0.052, 0.086 Digit I 1000 0.0002 0.213 -0.137, 0.135, -0.158 0.0002, 0.0002, 0.0001 Digit II 1000 0.001 1.427 -0.048, 0.113, -0.206 0.008, 0.007, 0.007 Digit III 1000 0.002 2.45 0.009, 0.091, -0.32 0.006, 0.031, 0.034 Digit IV 1000 0.002 1.89 -0.042, 0.107, -0.413 0.004, 0.013, 0.012 Pes 1000 0.006 6.008 -0.026, 0.103, -0.316 0.013, 0.051, 0.054 Hind limb 1000 0.202 202.772 -0.039, 1.346, -0.277 14.536, 5.09, 16.898 HAT 899.929 1.413 1271.6 0.508, 1.84, 0 164.075, 1816.89, 1939.05 Whole Body 923.027 1.817 1677.14 0.375, 1.721, 0
-Table 18. Results for best estimate model of MOR 693 with + 11.25% tail and - 7.5% neck and thorax.
Segment
Net Density
(kg m-3) Volume (m3) Mass (kg) CM (x,y,z) (m) Ixx Iyy Izz (kg m2)
Head 990.536 0.069 68.347 2.397, 2.52, 0 36.129, 358.069, 393.594 Air sacs 0 0.0007 0 - -Neck 938.621 0.103 96.678 1.75, 2.157, 0 18.7, 259.665, 277.512 Pharyngeal cavity 0 0.006 0 - -Thorax 695.372 0.444 308.745 0.91, 1.795, 0 18.406, 236.783, 254.84 Lungs 0 0.135 0 - -Sacrum 1000 0.188 187.543 -0.041, 1.766, 0 13.077, 14.562, 24.729 Tail 1000 0.395 394.485 -1.302, 1.632, 0 33.151, 1024.25, 1050.96 Arm 1000 0.009 9.2 1.691, 1.605, -0.217 0.927, 23.221, 23.229 Digit I 1000 0.0005 0.475 1.92, 1.34, -0.188 0.0626, 1.565, 1.594 Digit II 1000 0.0006 0.569 1.896, 1.293, -0.154 0.166, 1.812, 1.948 Digit III 1000 0.0002 0.213 1.851, 1.289, -0.159 0.063, 0.644, 0.696 Total Fore limb 1000 0.01 10.457 1.716, 1.57, -0.211 1.218, 27.242, 27.466
Thigh 1000 0.146 146.198 0.002, 1.606, -0.268 12.752, 4.44, 14.88 Shank 1000 0.041 41.352 -0.152, 0.839, -0.293 1.682, 0.546, 1.879 Metatarsus 1000 0.009 9.214 -0.18, 0.301, -0.313 0.089, 0.052, 0.086 Digit I 1000 0.0002 0.213 -0.137, 0.135, -0.158 0.0002, 0.0002, 0.0001 Digit II 1000 0.001 1.427 -0.048, 0.113, -0.206 0.008, 0.007, 0.007 Digit III 1000 0.002 2.45 0.009, 0.091, -0.32 0.006, 0.031, 0.034 Digit IV 1000 0.002 1.89 -0.042, 0.107, -0.413 0.004, 0.013, 0.012 Pes 1000 0.006 6.008 -0.026, 0.103, -0.316 0.013, 0.051, 0.054 Hind limb 1000 0.202 202.772 -0.039, 1.346, -0.277 14.536, 5.09, 16.898 HAT 883.273 1.219 1076.71 0.119, 1.8, 0 121.901, 1947.81, 2056.57 Whole Body 913.284 1.623 1482.26 0.076, 1.679, 0
-Table 19. Results for best estimate model of MOR 693 with - 7.5% tail and + 11.25% neck and thorax.
Segment
Net Density
(kg m-3) Volume (m3) Mass (kg) CM (x,y,z) (m) Ixx Iyy Izz (kg m2)
Head 990.536 0.069 68.347 2.397, 2.52, 0 32.867, 256.754, 289.018 Air sacs 0 0.0007 0 - -Neck 961.571 0.147 141.351 1.766, 2.169, 0 27.391, 241.404, 266.21 Pharyngeal cavity 0 0.006 0 - -Thorax 792.739 0.651 516.073 0.924, 1.794, 0 52.592, 183.439, 213.546 Lungs 0 0.135 0 - -Sacrum 1000 0.188 187.543 -0.041, 1.766, 0 13.788, 59.105, 69.983 Tail 1000 0.272 271.764 -1.286, 1.651, 0 20.963, 995.348, 1013.15 Arm 1000 0.009 9.2 1.691, 1.605, -0.217 1.063, 14.166, 14.31 Digit I 1000 0.0005 0.475 1.92, 1.34, -0.188 0.078, 1.02, 1.065 Digit II 1000 0.0006 0.569 1.896, 1.293, -0.154 0.187, 1.17, 1.336 Digit III 1000 0.0002 0.213 1.851, 1.289, -0.159 0.071, 0.411, 0.47 Total Fore limb 1000 0.01 10.457 1.716, 1.57, -0.211 1.398, 16.767, 17.171
Thigh 1000 0.146 146.198 0.002, 1.606, -0.268 12.752, 4.44, 14.88 Shank 1000 0.041 41.352 -0.152, 0.839, -0.293 1.682, 0.546, 1.879 Metatarsus 1000 0.009 9.214 -0.18, 0.301, -0.313 0.089, 0.052, 0.086 Digit I 1000 0.0002 0.213 -0.137, 0.135, -0.158 0.0002, 0.0002, 0.0001 Digit II 1000 0.001 1.427 -0.048, 0.113, -0.206 0.008, 0.007, 0.007 Digit III 1000 0.002 2.45 0.009, 0.091, -0.32 0.006, 0.031, 0.034 Digit IV 1000 0.002 1.89 -0.042, 0.107, -0.413 0.004, 0.013, 0.012 Pes 1000 0.006 6.008 -0.026, 0.103, -0.316 0.013, 0.051, 0.054 Hind limb 1000 0.202 202.772 -0.039, 1.346, -0.277 14.536, 5.09, 16.898 HAT 895.316 1.347 1205.99 0.472, 1.839, 0 150.4, 1769.58, 1886.25 Whole Body 920.354 1.751 1611.54 0.344, 1.715, 0
-Table 20. Results for the best estimate model of MOR 693 with an enlarged rib cage.
Segment
Net Density
(kg m-3) Volume (m3) Mass (kg) CM (x,y,z) (m) Ixx Iyy Izz (kg m2)
Head 990.536 0.069 68.347 2.397, 2.52, 0 34.208, 290.461, 324.065 Air sacs 0 0.0007 0 - -Neck 946.09 0.121 114.477 1.758, 2.160, 0 21.572, 230.902, 250.968 Pharyngeal cavity 0 0.006 0 - -Thorax 717.914 0.627 450.132 0.934, 1.796, 0 40.085, 235.364, 234.717 Lungs 0 0.178 0 - -Sacrum 1000 0.188 187.543 -0.041, 1.766, 0 13.438, 38.114, 48.642 Tail 1000 0.317 317.484 -0.193, 1.644, 0 25.077, 1036.63, 1057.47 Arm 1000 0.009 9.2 1.691, 1.605, -0.217 1.003, 17.091, 17.175 Digit I 1000 0.0005 0.475 1.92, 1.34, -0.188 0.072, 1.198, 1.236 Digit II 1000 0.0006 0.569 1.896, 1.293, -0.154 0.178, 1.38, 1.528 Digit III 1000 0.0002 0.213 1.851, 1.289, -0.159 0.067, 0.487, 0.543 Total Fore limb 1000 0.01 10.457 1.716, 1.57, -0.211 1.329, 20.156, 20.482
Thigh 1000 0.146 146.198 0.002, 1.606, -0.268 12.752, 4.44, 14.88 Shank 1000 0.041 41.352 -0.152, 0.839, -0.293 1.682, 0.546, 1.879 Metatarsus 1000 0.009 9.214 -0.18, 0.301, -0.313 0.089, 0.052, 0.086 Digit I 1000 0.0002 0.213 -0.137, 0.135, -0.158 0.0002, 0.0002, 0.0001 Digit II 1000 0.001 1.427 -0.048, 0.113, -0.206 0.008, 0.007, 0.007 Digit III 1000 0.002 2.45 0.009, 0.091, -0.32 0.006, 0.031, 0.034 Digit IV 1000 0.002 1.89 -0.042, 0.107, -0.413 0.004, 0.013, 0.012 Pes 1000 0.006 6.008 -0.026, 0.103, -0.316 0.013, 0.051, 0.054 Hind limb 1000 0.202 202.772 -0.039, 1.346, -0.277 14.536, 5.09, 16.898 HAT 885.5 1.343 1158.9 0.348, 1.824, 0 137.022, 1871.78, 1956.82 Whole Body 933.983 1.713 1564.44 0.248, 1.7, 0
-Table 21. Results for the best estimate model of MOR 693 with a contracted rib cage.
Segment
Net Density
(kg m-3) Volume (m3) Mass (kg) CM (x,y,z) (m) Ixx Iyy Izz (kg m2)
Head 990.536 0.069 68.347 2.397, 2.52, 0 33.721, 317.266, 350.384 Air sacs 0 0.0007 0 - -Neck 946.09 0.121 114.477 1.758, 2.160, 0 21.18, 262.108, 281.782 Pharyngeal cavity 0 0.006 0 - -Thorax 743.227 0.401 298.034 0.917, 1.8, 0 18.67, 170.957, 192.489 Lungs 0 0.103 0 - -Sacrum 1000 0.188 187.543 -0.041, 1.766, 0 13.555, 26.106, 36.751 Tail 1000 0.317 317.484 -0.193, 1.644, 0 25.673, 941.929, 963.367 Arm 1000 0.009 9.2 1.691, 1.605, -0.217 1.024, 19.483, 19.589 Digit I 1000 0.0005 0.475 1.92, 1.34, -0.188 0.074, 1.342, 1.383 Digit II 1000 0.0006 0.569 1.896, 1.293, -0.154 0.181, 1.55, 1.7 Digit III 1000 0.0002 0.213 1.851, 1.289, -0.159 0.068, 0.549, 0.606 Total Fore limb 1000 0.01 10.457 1.716, 1.57, -0.211 1.348, 22.924, 23.278
Thigh 1000 0.146 146.198 0.002, 1.606, -0.268 12.752, 4.44, 14.88 Shank 1000 0.041 41.352 -0.152, 0.839, -0.293 1.682, 0.546, 1.879 Metatarsus 1000 0.009 9.214 -0.18, 0.301, -0.313 0.089, 0.052, 0.086 Digit I 1000 0.0002 0.213 -0.137, 0.135, -0.158 0.0002, 0.0002, 0.0001 Digit II 1000 0.001 1.427 -0.048, 0.113, -0.206 0.008, 0.007, 0.007 Digit III 1000 0.002 2.45 0.009, 0.091, -0.32 0.006, 0.031, 0.034 Digit IV 1000 0.002 1.89 -0.042, 0.107, -0.413 0.004, 0.013, 0.012 Pes 1000 0.006 6.008 -0.026, 0.103, -0.316 0.013, 0.051, 0.054 Hind limb 1000 0.202 202.772 -0.039, 1.346, -0.277 14.536, 5.09, 16.898 HAT 901.343 1.117 1006.8 0.254, 1.829, 0 115.497, 1764.21, 1871.33 Whole Body 949.792 1.487 1412.34 0.17, 1.691, 0
-Table 22. Results for the best estimate model of MOR 693 with increased inter-vertebral separation.
Segment
Net Density
(kg m-3) Volume (m3) Mass (kg) CM (x,y,z) (m) Ixx Iyy Izz (kg m2)
Head 990.536 0.069 68.347 2.502, 2.52, 0 34.188, 327.892, 361.477 Air sacs 0 0.0007 0 - -Neck 957.357 0.126 120.627 1.846, 2.162, 0 22.808, 283.439, 304.644 Pharyngeal cavity 0 0.006 0 - -Thorax 731.951 0.552 404.037 0.953, 1.794, 0 29.803, 224.474, 249.715 Lungs 0 0.147 0 - -Sacrum 1000 0.188 187.543 -0.041, 1.766, 0 13.441, 34.66, 45.19 Tail 1000 0.331 330.726 -0.137, 1.644, 0 26.208, 1120.62, 1142.46 Arm 1000 0.009 9.2 1.691, 1.605, -0.217 1.003, 19.668, 19.753 Digit I 1000 0.0005 0.475 1.92, 1.34, -0.188 0.072, 1.352, 1.391 Digit II 1000 0.0006 0.569 1.896, 1.293, -0.154 1.507, 2.881, 1.7 Digit III 1000 0.0002 0.213 1.851, 1.289, -0.159 0.067, 0.553, 0.609 Total Fore limb 1000 0.01 10.457 1.716, 1.57, -0.211 2.650, 24.455, 23.454
Thigh 1000 0.146 146.198 0.002, 1.606, -0.268 12.752, 4.44, 14.88 Shank 1000 0.041 41.352 -0.152, 0.839, -0.293 1.682, 0.546, 1.879 Metatarsus 1000 0.009 9.214 -0.18, 0.301, -0.313 0.089, 0.052, 0.086 Digit I 1000 0.0002 0.213 -0.137, 0.135, -0.158 0.0002, 0.0002, 0.0001 Digit II 1000 0.001 1.427 -0.048, 0.113, -0.206 0.008, 0.007, 0.007 Digit III 1000 0.002 2.45 0.009, 0.091, -0.32 0.006, 0.031, 0.034 Digit IV 1000 0.002 1.89 -0.042, 0.107, -0.413 0.004, 0.013, 0.012 Pes 1000 0.006 6.008 -0.026, 0.103, -0.316 0.013, 0.051, 0.054 Hind limb 1000 0.202 202.772 -0.039, 1.346, -0.277 14.536, 5.09, 16.898 HAT 885.908 1.278 1132.19 0.324, 1.824, 0 131.751, 2039.99, 2150.39 Whole Body 928.021 1.657 1537.73 0.228, 1.698, 0
-Table 23. Summary of results for mixed HAT segments sensitivity analysis.
*Best estimate thoracic and neck volumes with enlarged thoracic and pharyngeal air sacs.
**Best estimate thoracic and neck volumes with reduced thoracic and pharyngeal air sacs.
†Best estimate thoracic and neck volumes and air sacs with an abdominal air sac.
Thorax/neck Tail HAT CM Whole body CM Coordinates
(x,y) (m)
Relative to hip joint (x,y) (m)
Coordinates (x,y) (m)
Relative to hip joint (x,y) (m)
Best estimate Best estimate 0.3081, 1.826 0.278, -0.011 0.214, 1.696 0.184, -0.141 Best estimate* Best estimate 0.291, 1.83 0.261, -0.007 0.2, 1.697 0.17, -0.14 Best estimate** Best estimate 0.324, 1.823 0.294, -0.014 0.228, 1.696 0.198, -0.141 Best estimate† Best estimate 0.299, 1.83 0.269, -0.007 0.207, 1.698 0.177, -0.131 - 7.5% - 7.5% 0.307, 1.832 0.277, -0.005 0.215, 1.704 0.185, -0.133 + 7.5% + 7.5% 0.301, 1.818 0.271, -0.019 0.211, 1.689 0.181, -0.148 + 11.25% + 11.25% 0.3, 1.815 0.27, -0.022 0.21, 1.687 0.18, -0.15 + 15% + 15% 0.304, 1.814 0.27, -0.023 0.213, 1.686 0.183, -0.151 + 15% - 7.5% 0.508, 1.84 0.478, 0.003 0.375, 1.721 0.345, -0.116 - 7.5% + 7.5% 0.083, 1.799 0.053, -0.038 0.05, 1.677 0.02, -0.16 Best estimate enlarged rib
cage
Best estimate 0.348, 1.824 0.318, -0.013 0.248, 1.7 0.218, -0.137 Best estimate contracted
rib cage
Best estimate 0.254, 1.829 0.224, -0.008 0.17, 1.691 0.14, -0.146 Vertebrae spacing +0.005m 0.324, 1.824 0.294, -0.013 0.228, 1.698 0.198, -0.139