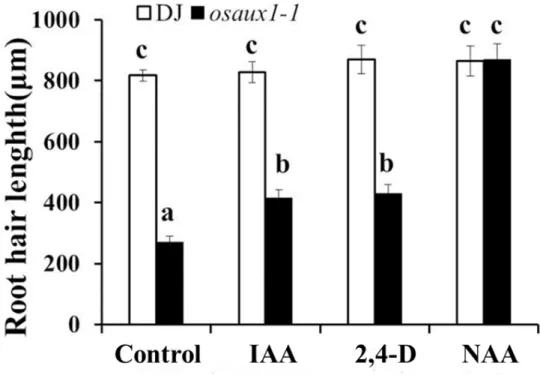
Figure S1. Root hair length in WT and osaux1-1 mutant under various treatments.
Root hair length of WT and osaux1-1 under Control, 1μM IAA, 0.1μM 2, 4-D and 0.1μM NAA treatments for 3 days. Ten seedlings were measured at each treatment. Means marked with different letters indicate significant differences using Duncan’s multiple range mean comparisons at 5% alpha.
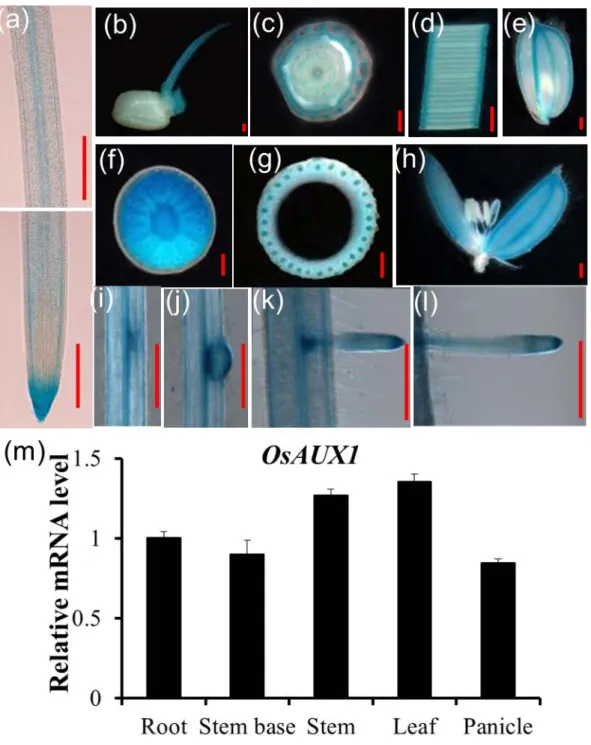
Figure S2. Expression pattern of OsAUX1.
(a-k)The expression pattern of OsAUX1, as revealed by promoter GUS fusion analysis in transgenic seedlings . Region of PR maturation (a), germinated seed (b), stem base (c),leaf(d), glume(e), stem node(f), stem(g) , flower(h), LR from initiation to mature (i-l).Bar=500μm for (a-k) .(m)Quantitative reverse transcription PCR of OsAUX1 expression in various tissues. Total RNA was extracted from the root, stem base, stem, mature leaf and panicle of the wild-type.
Experiments were analyzed using three independent biological repeats.
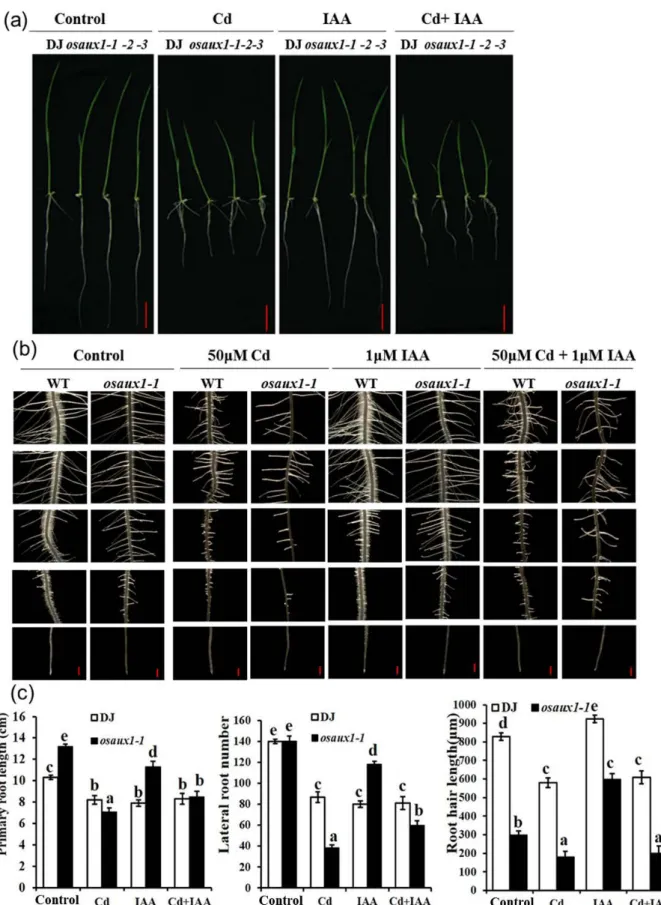
(a) Phenotype of WT and osaux1 under Cd and IAA cotreament. Left to right, WT,
osaux1-1, osaux1-2 and osaux1-3 growth in Control, 50μM CdCl2, 1μM IAA, and
50μM CdCl2 plus 1μM IAA for 7 days. Bar=2cm.
(b) Phenotype of LR and RH in WT and osaux1 under Cd and IAA cotreament. Left to right, WT and osaux1-1 mutant planted in Control, 50μM CdCl2, 1μM IAA, and
50μM CdCl2 plus 1μM IAA for 7 days. Bar=1mm. These phenotypes were observed
with a Leica MZ95 stereomicroscope.
(c) Statistics of roots phenotype. PR length, the number of LR and RH length was measured in WT and osaux1 planted in Control, 50μM CdCl2, 1μM IAA, and 50μM
CdCl2 plus 1μM IAA for 7 days. Ten seedlings were measured at each parameter.
Means marked with different letters indicate significant differences using Duncan’s multiple range mean comparisons at 5% alpha.
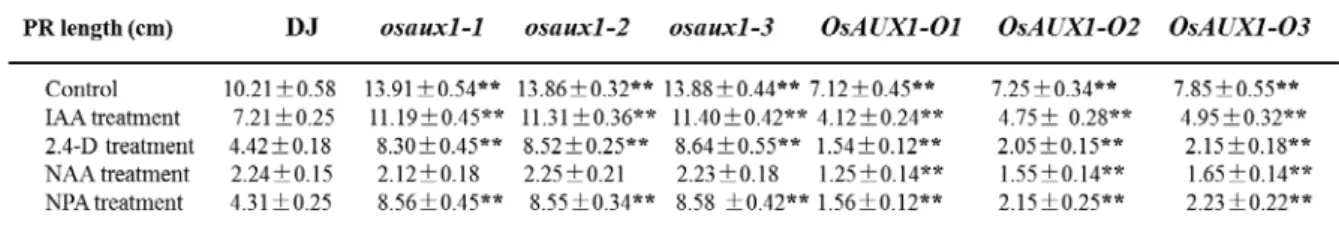
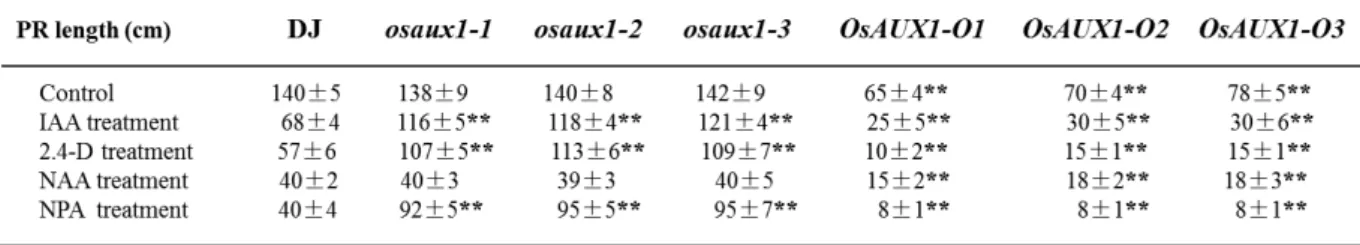
Table S1. PR lengths of 7 days seedling of WT, osaux1 mutants and OsAUX1
over-expression lines under various treatments.
Table S2. LR number of 7 days seedling of WT, osaux1 mutants and