Critical Thickness in Silicone Thermosets
by
Manish Deopura
Bachelor of Technology, Chemical Engineering Indian Institute of Technology, Delhi (1997)
MAssACHU~.tS IN `F CHNOLO~
1~~
i
APR
L
DE20
LIBIARIES
Master of Science, Materials Science and Engineering Massachusetts Institute of Technology (2003)
Submitted to the Department of Materials Science and Engineering in Partial Fulfillment for the Requirement for the Degree of
Doctor of Philosophy in Materials Science and Engineering at the
Massachusetts Institute of Technology
ARc
February 2005
© 2005 Massachusetts Institute of Technology All rights reserved
Author
Manish Dpura
Department of Materials Science and Engineering January 18, 2005
i ',~~~~~~~~~~;
Certified by
Frederick J. McGarry Professor of Polymer Engineering Thesis Advisor
Accepted by --
-Carl V. Thompson II Stavros Salapatas Professor of Materials Science and Engineering Chair, Departmental Committee on Graduate Students
Critical Thickness in Silicone Thermosets
by
Manish Deopura
Submitted to the department of Materials Science and Engineering January 18, 2005
in partial fulfillment for the requirement for the
Degree of Doctor of Philosophy in Materials Science and Engineering
Abstract
Critical thickness effects are utilized to achieve high fracture toughness in brittle polymers. The postulate of critical thickness, which is: "Macroscopically brittle polymers
deform in a ductile fashion below a critical dimension" is validated for silicone
thermosets and polystyrene using novel "direct" methods by measuring failure strain in thin films.
A discussion on polymer intrinsic deformation mechanisms is presented. Using these intrinsic deformation mechanisms as bases, it is argued that all polymers are ductile at the molecular level. Accordingly, it is suggested that polymer properties below a certain length scale (defined as critical thickness) are dominated by intrinsic deformation characteristics. Two analytical models have been developed which predict critical thickness based on the physical properties of the polymer. The first model is based on an energy criterion according to which crack initiation does not take place if the crack driving force is less than the crack resistance. Such a condition for a brittle polymer is achieved at the critical thickness. The second model is based on a mechanics criterion according to which a minimum film thickness (critical thickness) is required for typical fracture features like crazes to exist within it. Further, using these theoretical models as a basis, the effect of network density, temperature and strain rate on critical thickness is discussed. It is also shown that fracture strain is the characteristic material property to measure film toughness.
A variety of silicone thermosets are studied to demonstrate engineering applicability of critical thickness. The selected polymers include a commercial laminate poly-phenyl-methyl-silsesquioxane resin, an experimental high temperature poly-methyl-silsesquioxane resin and an optical polysiloxane resin. In addition to silicone thermosets, polystyrene is studied as a reference polymer. A bending technique has been developed in order to determine failure strain of thin films (on substrates) of these materials. Using this
technique, the failure strain is evaluated as a function of film thickness. Further, from a plot of failure strain as a function of film thickness the critical thickness is determined. For polystyrene, a critical thickness value of approximately 0.1 pm is observed. The strain to failure of polystyrene films below the critical thickness is >15%, a marked increase over bulk material fracture strain (-2%). For each of the silicone thermosets, a range of curing temperatures is investigated to determine the influence of curing temperature on critical thickness. For the poly-phenyl-methyl-silsesquioxane resin, the optimum thin film properties are observed when it is cured at 225°C. The critical thickness is observed to be -5 gm with a strain to failure of -13% (bulk strain to failure <2%). Molecular engineering of the poly-phenyl-methyl-silsesquioxane by modifying the chemical structure using functionalized PDMS is shown to increase critical thickness to 0lm. For this PDMS modified poly-phenyl-methyl-silsesquioxane, critical thickness values have been determined over a range of test temperatures from -40°C to 75°C. Results indicate that the test temperature does not influence the critical thickness. For the
poly-methyl-silsesquioxane, the critical thickness is observed to be greater than 2.51pm with a strain to failure of 15% when cured at 250C. Two optical polysiloxane resins are studied. The first resin, commercially called the PF-1202 resin is studied for a single cure temperature and is observed to have a critical thickness of -0.2-0.3[pm. The properties of the second resin, named MP-101, are studied for a range of cure temperatures. The best performance, with 8% strain to failure and a 0.5[pm critical thickness, is observed for a 50°C cure temperature.
Infrared spectroscopy measurements in reflection mode are carried out to compare orientation effects in thin (below critical thickness) vis-A-vis thick (above critical thickness) films for polystyrene, poly-phenyl-methyl-silsesquioxane and PDMS modified poly-phenyl-methyl-silsesquioxane. It is observed that both the thick as well as thin films do not exhibit any substantial orientation. A correlation between molecular orientation and fracture properties cannot be made. Infrared spectroscopy has also been used to determine the "nature" of strain (elastic or plastic) these thin films (below critical thickness value) exhibit when stretched to values higher than their bulk counterparts.
Acknowledgements
After a long journey, through good times and tough times, I feel a great sense of satisfaction with the completion of my PhD thesis and to have finally reached "the end of the beginning!" There have been several people - colleagues, family members, friends and at times many unnamed faces - all of whom have been of great help and support throughout my MIT life. I am greatly indebted to three gifted scholars, teachers and mentors: Prof. Frederick McGarry, Prof. Sam Allen and Prof. Christopher Schuh. All of them have helped shape my career at MIT; without them I would not be what I am today. To Prof. McGarry, I am ever grateful for offering me a PhD project and for suggesting the topic of critical thickness. His words, although few, are filled with a lot of wisdom and experience. It is always a delight to listen to him and learn from him. I am extremely grateful for his guidance and for his patience during times when I needed focus.
I am extremely grateful to Prof. Sam Allen for his help through my entire graduate life at MIT. I am deeply indebted to him, for his standing up for me when the chips were down and I needed help, for his listening to me, for his words filled with wisdom and for his guidance when I have stood at cross-roads. I do not have words enough to express my gratitude for him.
Last but not the least, I would like to thank Prof. Chris Schuh, who was my supervisor during my Master's thesis. Chris took me on as a student when I was going through one of the most difficult phases in my life. I am ever grateful for that. Our professional relationship has continued after I finished my Master's thesis and I am sure it will continue on with new projects as time progresses.
I would like to thank Dr. Bizhong Zhu and Dr. Dimi Katsoulis of Dow Coming Corporation for their valuable discussions as the project progressed. Their critiques, comments and suggestions were key in helping make this project move along at a rapid pace as well as for helping me to focus in on the real issues associated with silicone materials. A special thanks to my colleagues during this project, Andrew Satorius and Dr. Yuhong Wu. Especially Yuhong - for suggesting the McGarry lab as an option to pursue my PhD. The FTIR work performed during this project would not have been possible without the support of Tim McClure. My thanks to him for his help. Both Marjorie Joss and Kathy Farrell, I would like to thank for their administrative support.
I would like to mention a special thanks to my friends Sajan, Mahesh, Charu, Shivanshu, Subarna, Shantoo and Lalit for being extraordinary friends.
Finally, I would like to take a few lines to acknowledge the ones who have been the nearest and dearest for me. My parents for their "long distance" support and for being the wonderful parents they are. My brother, Ashish for being the affectionate and respectful brother he has always been. Rupa for being there for me, for her support and affection. Words are not enough to express the feelings of gratitude and belonging I have for them. Their unconditional support has helped me to emerge victorious in all my endeavors.
Table of Contents
Abstract ... i
Acknowledgements... iii
Table of Contents ... iv
List of Figures ... vii
List of Tables ... xvii
1 Introduction ... 1
1.1 Current Polymer Toughening Strategies ... 2
1.2 Critical Thickness ... 5
1.3 Silicone Resins: Introduction ... 8
1.4 Organization of Thesis ... 11
2 Critical Thickness: Review and Models ... ... 13
2.1 Basis for Critical Thickness ... 13
2.1.1 Natural Draw Ratio ... 14
2.1.2 Extension of Fibrils in Glassy Polymers ... 15
2.2 Analytical Models ... 17
2.2.1 Thin Film Energy Approach ... ... 17
2.2.2 Mechanics Based Approach ... 20
2.3 Critical Thickness as Influenced by Physical Parameters . ... 23
2.3.1 Influence of Network Density ... 23
2.3.2 Influence of Temperature and Strain Rate ... 26
2.4 Strain to Failure as a Measure of Fracture Toughness . ... 28
2.5 Bulk Methods to Identify Critical Thickness ... 29
2.5.1 Alternating Thin Film Layers ... ... 29
2.5.2 Incorporation of Core Shell Rubber Particles ... 30
3 Characterization Methods for Thin Films ... 39
3.1 Procedure to Determine Critical Thickness ... ... 39
3.1.1 Sample Preparation ... 39
3.1.2 Application of Strain on Films: Bending Technique ... 41
3.1.4 Critical Thickness Determination ... 48
3.2 Secondary Property Testing ... ... 49
3.2.1 Molecular Composition (IR Spectroscopy) ... 49
3.2.2 Molecular Orientation (Infrared Dichroism) ... 50
3.2.3 Network Density ... 53
3.2.4 Glass Transition Temperature ... 53
4 Polystyrene Results ... 64
4.1 Critical Thickness Results ... 65
4.1.1 Thin Film Fabrication ... 65
4.1.2 Bending Test Results ... 65
4.1.3 Comparison of Experimental Results to Models ... 68
4.2 IR Dichroism ... 68
4.3 Summary ... 69
5 Poly-phenyl-methyl-silsesquioxane ... 79
5.1 Critical Thickness Results ... 80
5.1.1 Thin Film Fabrication ... 80
5.1.2 Bending Test Results ... 80
5.1.3 Comparison of Experimental Values to Models ... 83
5.2 IR Dichroism ... 84
5.3 Summary ... 85
6 Molecular Engineering in Poly-phenyl-methyl-silsesquioxane (4-3136) ... 93
6.1 Molecular Engineering: Chemical Modification .. ... 93
6.2 Critical Thickness Results ... 95
6.2.1 Thin Film Fabrication ... 95
6.2.2 Bending Test Results ... 96
6.3 IR Dichroism ... 98
6.4 Effect of PDMS Concentration ... 99
6.5 Effect of Test Temperature ... 100
6.6 Summary ... . 101
7 Methyl-T-silsesquioxane Results ... 116
7.1.1 Thin Film Fabrication ... 116
7.1.2 Bending Test Results ... 117
7.2 Summary 119 8 C-resin Results ... 126
8.1 Critical Thickness Results ... 126
8.1.1 Thin Film Fabrication ... 126
8.1.2 Bending Test Results for PF-1202 ... 127
8.1.3 Bending Test Results for MP-101 ... ... 129
8.2 Summary 129 9 Conclusions ... 136 Appendix A ... 140 Appendix B ... 142 Appendix C ... 143 Appendix D ... ... ... 144 Appendix E ... 145 Appendix F ... ... ... 146 References ... 147
List of Figures
Figure 2-1 (a) Schematic illustration of multiple crazes formed within a polymer upon tensile deformation. (b) Schematic of a single craze structure. The oval shape represents the craze. The vertical lines within the craze represent craze fibrils. The craze is surrounded by unstrained polymer
strands in their random coil state. (Note: Both figures are not to scale.) ... 32 Figure 2-2 (a) A schematic model of a craze structure shows the active zone
(dimension 'a'), voids (thickness fL) and fibrils (diameter D). The hydrostatic tension within the active zone is denoted by ap. The surface tension within the void is denoted by ov. The end radius of curvature of the void is denoted by r. A tensile stress S is applied on the entire polymer. (b) Model of the smallest possible craze which can exist. Such a craze is depicted to consist of a single void and two fibrils. The craze
is bounded by the active zone on all sides ... 33 Figure 2-3 Effect of network density variation on draw ratio and critical thickness.
(a) Draw ratio as a function of network density as predicted by Equation 2-23. (b) Critical thickness as a function of network density as predicted by Equation 2-24. For both plots, physical parameter values of polystyrene are used. Network density is varied while keeping all other
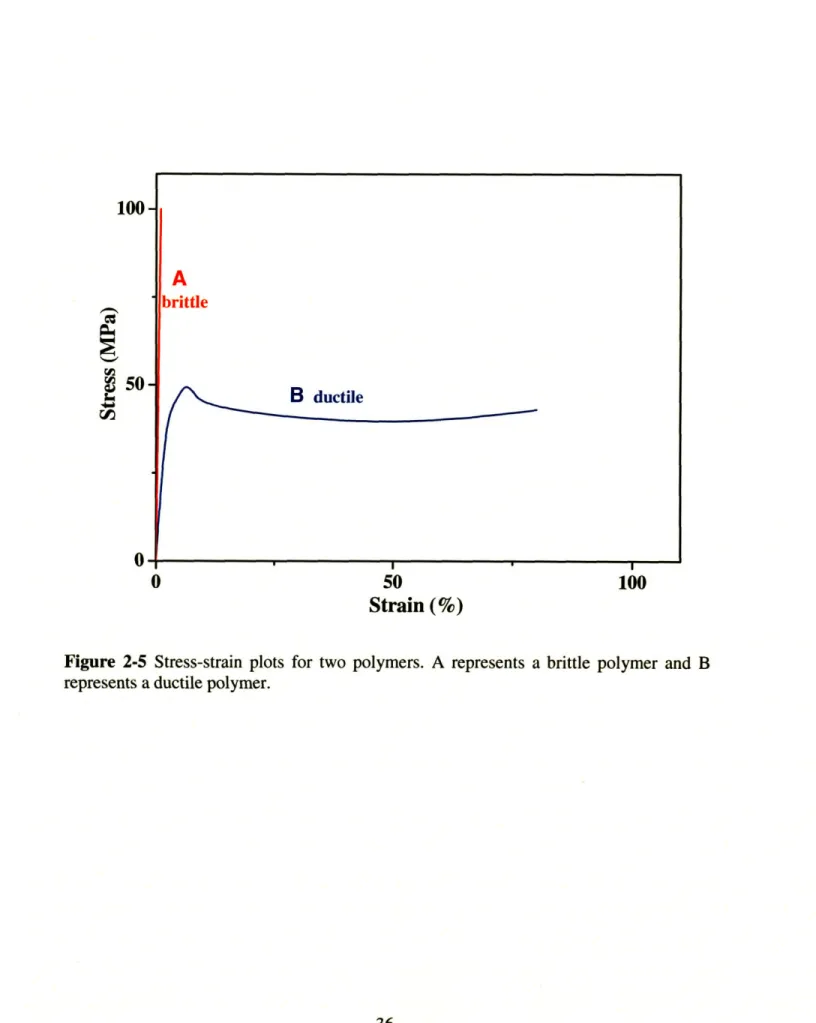
parameters constant ... 34 Figure 2-4 Effect of temperature on critical thickness of polystyrene ... 35 Figure 2-5 Stress-strain plots for two polymers. A represents a brittle polymer and
B represents a ductile polymer ... 36 Figure 2-6 Schematic of multilayers made by co-extrusion. The specimen consists
of alternating layers of the polymer to be tested with a ductile polymer ... 37 Figure 2-7 Schematic of a bulk polymer which is locally thinned by introduction
of core-shell rubber particles. The average distance between two
particles is the ligament thickness ... 38 Figure 3-1 Illustration of bending in a film-substrate system. A cross-sectional
view is shown. The thickness of the film is tf and the thickness of the substrate is ts. The radial co-ordinate is denoted by r. The bending radius is R. The neutral axis (radial position r = ro) does not exhibit any strain and divides the region into two parts. The region above the
Figure 3-2 Schematic of a typical bending experiment. As the film-substrate system is bent over cylinders with progressively decreasing diameters,
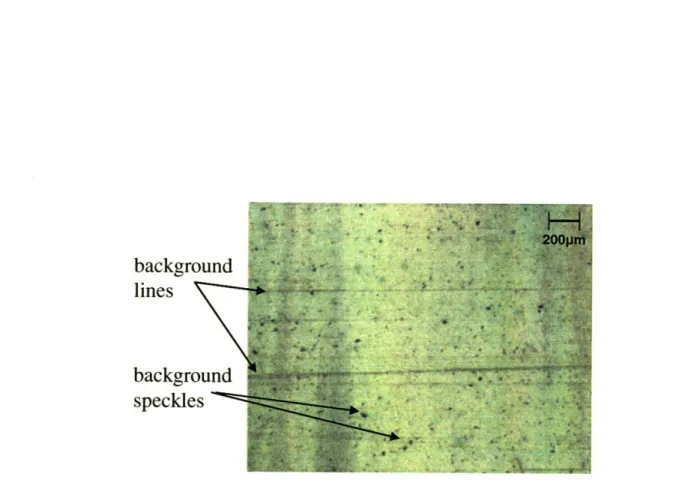
the strain in the film increases ... 56 Figure 3-3 Micrograph of a 1.5tm polystyrene film on top of a stainless steel
substrate. No strain is applied to the film-substrate system in this case.
The substrate features (horizontal lines and speckles) are visible ... 57 Figure 3-4 Micrograph of a 15[tm film of engineered
poly-methyl-phenyl-silsesquioxane strained to 2.3%. The substrate is stainless steel. Large brittle cracks in the film are observed which span the entire vertical
dimension. Smaller cracks are also observed ... 58 Figure 3-5 Micrograph of a 0.4tm film of methyl-T resin strained to 14.5%.
Areas in the top left and the bottom right are not in focus. In the middle portion of the picture, several deformation features of stainless steel substrate are seen. A magnified view of the ductile crack within the film
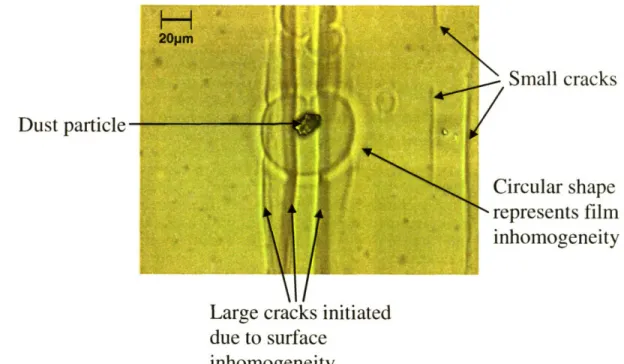
is shown in the inset. The length of the crack is -20im ... 59 Figure 3-6 Micrograph of an extremely thin film of C-resin prepared on a
polycarbonate substrate. The entire film-substrate system is strained to 7.9%. Small cracks are observed on the right side. In the center, a large dust particle is seen. Cracks around the dust particle are much larger
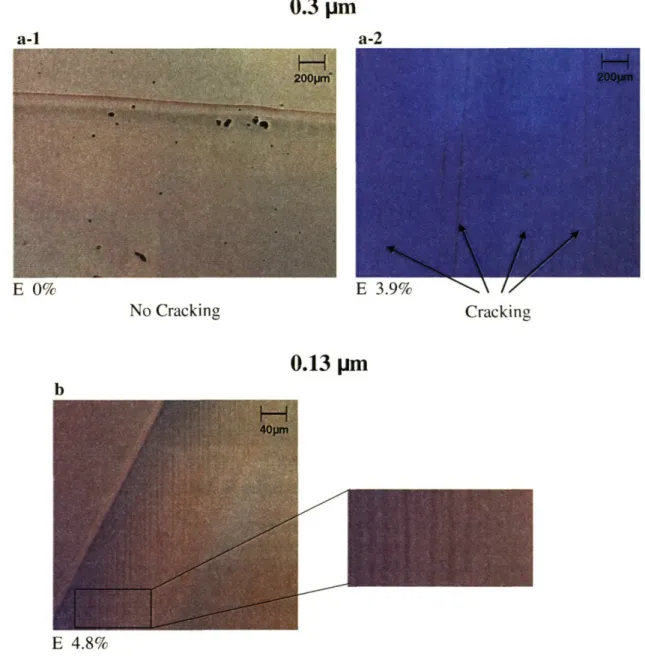
than in other regions ... 60 Figure 3-7 Micrograph of film edge depicting the lip region of a 0.13pm
polystyrene film. This polystyrene film is prepared on a polysulfone substrate. The entire film-substrate system is strained to 4.8%. In the top left area of the picture the substrate top surface is exposed. In the bottom right the film is seen. In the lip region, which is much thicker than the film, several large cracks are observed. No cracks are observed in the film inner region. A magnified view of the lip region is also
show n ... 6 1 Figure 3-8 Schematic of typical failure strain vs. film thickness plots. Plot A
depicts fracture strain for a highly brittle polymer. The fracture strain has a low value over the entire thickness range. Plot B depicts a gradual change in fracture strain as a function of film thickness. Plot C depicts a typical failure strain behavior for a material which exhibits the critical thickness phenomenon. The critical thickness is the transition point
from brittle to ductile behavior ... 62 Figure 3-9 Schematic depicting the geometry for reflection spectroscopy
experiments. The polymer film is represented as the oval shape. This polymer film is atop a substrate. A X-Y-Z co-ordinate system is marked for reference. This convention is used throughout. Three principal measurement directions are shown. With a grazing angle incidence,
absorption in XZ and YZ planes is measured. Using a near-normal angle incidence, absorption in the XY plane is measured. For unstrained films, symmetry dictates that X and Y directions are equivalent. Therefore, XZ and YZ plane absorption measurements are equivalent. To measure in-plane molecular orientation in films (no strain applied), absorption measurements need to be performed in the XY plane using near normal reflection measurements. For the case of absorption experiments on strained films, without loss of generality, the straining direction is chosen to be along the Y axis. For orientation measurements in strained films, absorption measurements can be carried out in either the XY plane or YZ plane. XY plane is used for measurements in
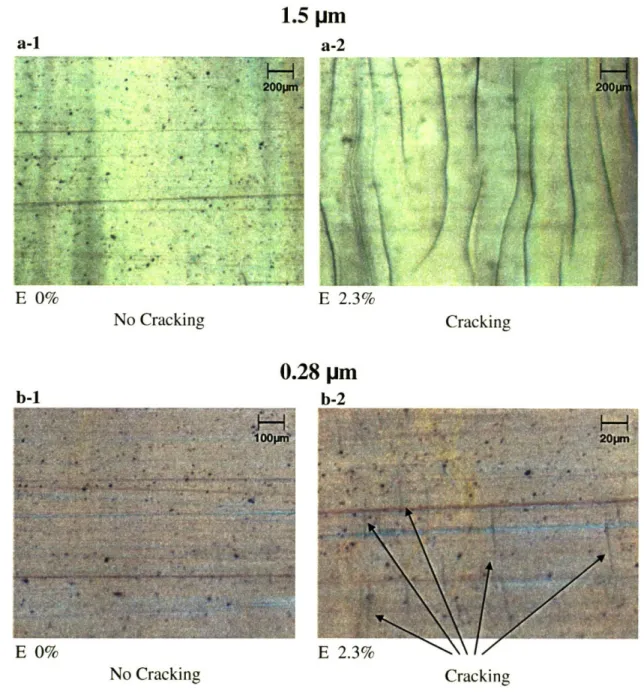
strained film s ... 63 Figure 4-1 Microscopy results for bending tests carried out on polystyrene films
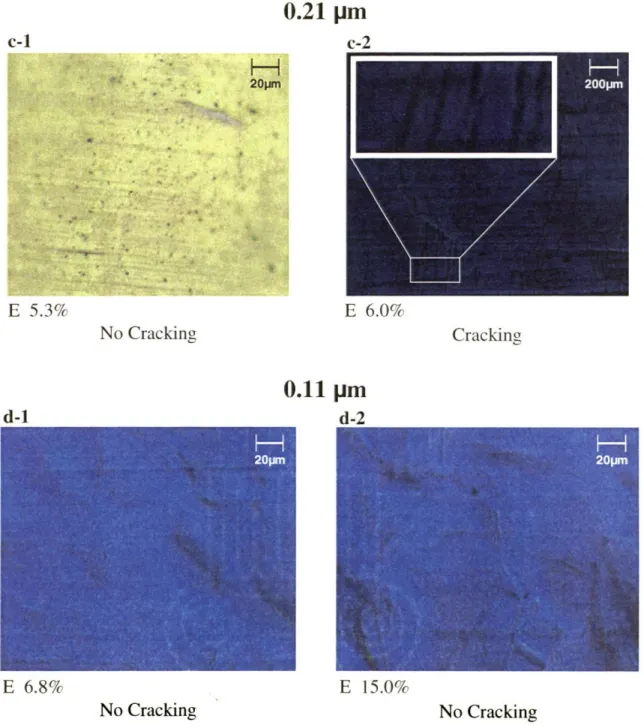
which are prepared on a stainless steel substrate. (a-l) 1.5pm thick film prior to strain application is shown. Speckles and horizontal lines observed are characteristic substrate features. (Note: This micrograph has been presented before in Section 3.1.3.) (a-2) Brittle cracking observed in a 1.5[lm thick film at 2.3% strain. Most cracks span the entire vertical dimension of the picture. Cracks are several mm across. (b-l) A 0.281pm film prior to application of strain. Speckles and horizontal lines are characteristic of stainless steel. (b-2) Cracking observed in a 0.28pm film at 2.3% strain. Several cracks have been labeled. Cracks are -20-30gm across. (c-l) No cracking in a 0.21um thick film under 5.3% strain. Speckles and horizontal lines are characteristic of stainless steel. (c-2) Cracking observed in a 0.21 pm thick film at 6% strain. Several cracks are observed throughout the film. A magnified region is shown in the inset. Grain structure of the deformed stainless steel is also visible. Typical crack length is -200gm. These cracks seem to have a character which cannot be classified as purely brittle or ductile. (d- ) No cracking is observed in a 0.1 lm thick film at 6.8% strain. Grains of the stainless steel are visible. (d-2) No cracking observed in a 0.1 l gm thick film at 15% strain. Characteristic
grain structure of stainless steel dominates the view field ... 71 Figure 4-2 Micrographs from bending tests carried out on polystyrene films which
are on top of a polysulfone substrate. (a-l) A 0.3npm thick film prior to strain application is shown. The film edge is visible. Several dust particles are observed (black spots). (a-2) Brittle cracking is observed in a 0.3pm thick film at 3.9% strain. Several of these cracks are labeled. The cracks are over several mm in length. (b) A 0.13pm film is shown at 4.8% strain. Cracking is observed in the lip region. No cracking is observed in the inner region of the film. (Note: this micrograph has
been previously presented in Section 3.1.3.) ...73 Figure 4-3 Micrograph from bending test carried out on polystyrene which is on
Cracking is observed in the lip region. No cracking is observed in the inner region of the film. The cracks are -500pm wide extending throughout the lip region. (Note: this micrograph is similar to the one presented in Section 3.1.3. Interpretation of structural features within
the micrograph is on lines similar to that discussed for Figure 3-7.) ... 74 Figure 4-4 Plot of strain to failure as a function of film thickness for polystyrene
obtained from bending test results. Two lines are shown for bending tests carried out on polystyrene films prepared on top of stainless steel and polysulfone substrates. The solid line depicts the highest strain sustained at a particular film thickness. The dashed line depicts the next incremental strain level (at which failure is observed). For bending tests carried out on a silver substrate only the solid line is shown. In all cases, an abrupt change in strain to failure is observed at around the 0.1-0.2gm thickness. For polystyrene thin films on stainless steel substrate (below critical thickness) a strain of >15% is sustained. This value of strain is attained for films fabricated on stainless steel. The green region denotes the range of film thickness for which eventual failure in films is not attained because of substrate limitations. (Error bars for all plots are according to the analysis presented in Section 3.1.2. Error bars for data points corresponding to low strains are not visible since they are buried
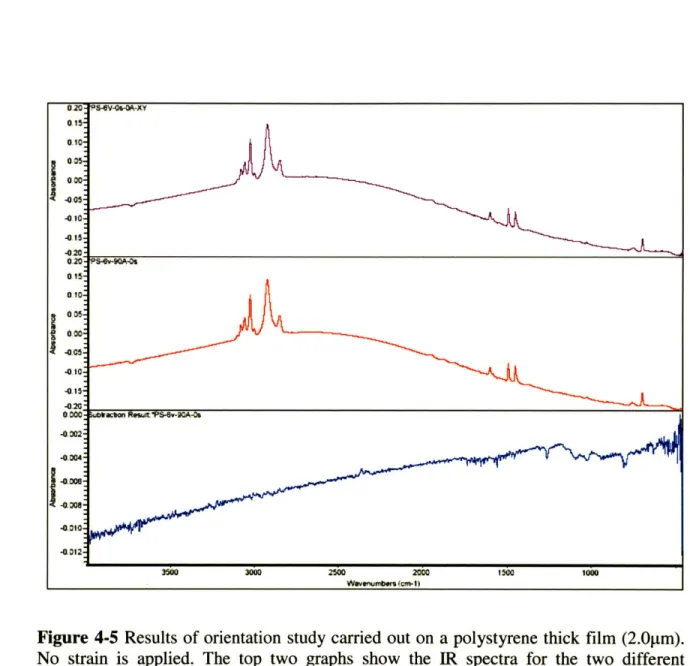
in the marks that indicate the average value.) ... 75 Figure 4-5 Results of orientation study carried out on a polystyrene thick film
(2.0pjm). No strain is applied. The top two graphs show the IR spectra for the two different polarizations. The bottom curve is the resultant
difference obtained upon subtraction of the first graph from the second ... 76 Figure 4-6 Results of orientation study carried out on a polystyrene thin film
(50nm). No strain is applied. The top two graphs show the IR spectra for the two different polarizations. The bottom curve is the resultant difference obtained upon subtraction of the first graph from the second.
Peak at 2300 cm-' is due to carbon-di-oxide ... 77 Figure 4-7 Results of orientation study carried out on a polystyrene thin film
(50nm) at 10% elongation. The top two graphs show the IR spectra for the two different polarizations. The bottom curve is the resultant
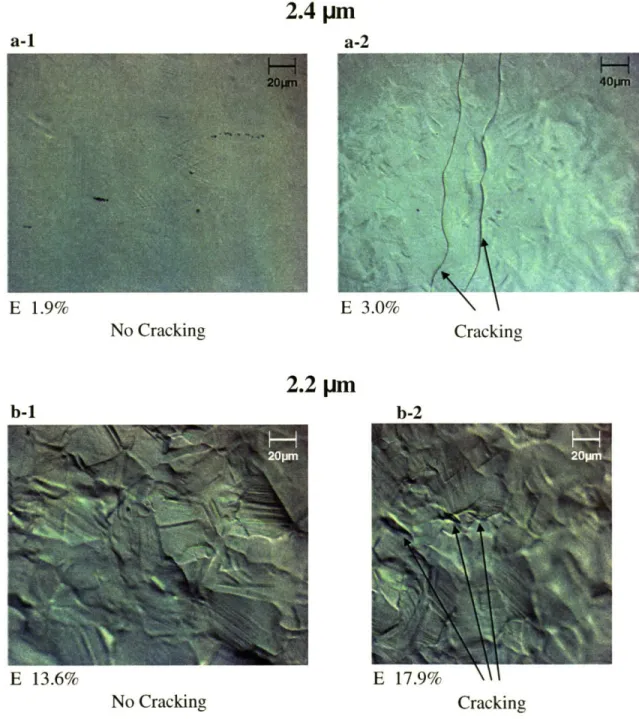
difference obtained upon subtraction of the first graph from the second ... 78 Figure 5-1 Micrographs from bending tests carried out on 4-3136 films cured at a
temperature of 177°C. Stainless steel substrate is used. (a-1) No cracking in a 2.4lm thick film at 1.9%. Structural features of the deformed stainless steel can be seen. (a-2) Brittle cracking observed in 2.4gm thick film at 3.0% strain. The two cracks which are in the view field are labeled. The length of the crack is over 250gm. (b-1) No cracking in a 2.2pm film at 13.6% strain. Stainless steel grain structure dominates the view. (b-2) Ductile cracking observed in a 2.2[tm film at
17.9% strain. The three cracks have been labeled. The crack size is -20-30[tm. The film cracks are clearly distinguishable from the
substrate features ... 86 Figure 5-2 Micrographs from bending tests carried out on 4-3136 resin cured at a
temperature of 225°C. Stainless steel substrate is used. (a-1) No cracking is observed in a 7.3pm thick film at 1.2% strain. Structural features of the deformed stainless steel can be seen. (a-2) Brittle cracking observed in a 7.3tm thick film at 1.9% strain. The cracks are over 250tpm in length. (b-1) No cracking observed in a 5.7pm film at 9.5% strain. View field is dominated with deformation features of the stainless steel. (b-2) Ductile cracking observed in 5.7gm film at 13.6% strain. The cracks are marked by arrows. Two cracks are labeled. These
cracks are -20-301am in length ... 87 Figure 5-3 Micrographs from bending tests carried out on 4-3136 resin cured at a
temperature of 250°C. Stainless steel substrate is used. (a) Brittle cracking observed in a 19.5pgm thick film at 3.8% strain. The crack is at least 1 mm in length. (b) Cracking observed in 5.5 im film at 9.6% strain. The crack is about 200jm in length. Grain structure of the
stainless steel substrate is visible ... 88 Figure 5-4 Strain to failure as a function of the film thickness for 4-3136 cured at
five temperatures. A critical thickness value of 2.2ptm is observed for films cured at 177°C with a strain to failure of 13% below critical thickness. For a cure temperature of 200"C the critical thickness is observed to be 4gm with a failure stain of 13%. A critical thickness of 5.7pm is observed when the material is cured at 2250C. The 250°C cured films show a gradual increase in failure strain from 3% for a 20m film to a failure strain of 10% for a 4-5m film. For films cured at 300°C the strain to failure reduces substantially for the entire range of film thickness. (Error bars for all plots are according to the analysis
presented in Section 3.1.2.) ... 89 Figure 5-5 Results of orientation study carried out on a 4-3136 resin thick film
(4gm). No strain is applied. The top two graphs show the IR spectra for the two different polarizations. The bottom curve is the resultant
difference obtained upon subtraction of the first graph from the second ... 90 Figure 5-6 Results of orientation study carried out on a 4-3136 thin film (0.5gm).
No strain is applied. The top two graphs show the IR spectra for the two different polarizations. The bottom curve is the resultant difference
obtained upon subtraction of the first graph from the second ...91 Figure 5-7 Results of orientation study carried out on a 4-3136 resin thin film
(0.5 gm). The film is at 10% elongation. The top two graphs show the IR
resultant difference obtained upon subtraction of the first graph from the
second ... 92 Figure 6-1 Micrographs from bending tests carried out on engineered 4-3136
cured at a temperature of 200°C. A stainless steel substrate is used. (a-l) Film edge shown for 7gm film prior to strain application. (a-2) Brittle cracking observed in the 7tpm thick film at 2.0% strain. Several cracks are observed amongst which three are labeled. Crack length is -40-60pm. Grain structure of the deformed stainless steel is visible. (b-1) No cracking observed in 4gm film at 4.0% strain. Regions on the left side as well as the right side are not in focus. Grain structure of the stainless steel is visible. (b-2) Cracking observed in 4ptm film at 4.5% strain. The crack is on the top left corner. Crack length is -20[tm. (c-1) No cracking observed in a 3.2grm thick film under 15% strain. Only the middle region of the picture is in focus. The regions on the left and right are not in focus. Stainless steel deformation features dominate the view field. (c-2) Ductile cracks observed in a 3.21gm thick film with a failure strain >15%. Only a vertical strip through the middle section of the micrograph is in focus. A magnified region is shown in the inset which
identifies the crack. The crack length is -50[tm ... 103 Figure 6-2 Micrographs from bending tests carried out on engineered 4-3136
cured at a temperature of 300°C. A stainless steel substrate is used. (a-1) No cracking observed in a 161m thick film at 3.1% strain. Stainless steel features are visible. (a-2) Brittle cracking observed in a 161m thick film at 3.9% strain. The crack spans the entire vertical dimension of the micrograph and has a length of at least 1 mm. Stainless steel features are visible. (b-l) No cracking observed in 12pm film at 4.5% strain. Stainless steel substrate features dominate the view field. (b-2) Cracking observed in a 12pm film at 6.3% strain. The two cracks are on the top right and the bottom left. Crack length is -100pm. (c-1) No cracking observed in a 10pm thick film under 10.5% strain. Stainless steel features dominate the view field. (c-2) Ductile cracks observed in a
10m thick film at a 15.5% strain. Several cracks have been labeled ... 105 Figure 6-3 Micrographs from bending tests carried out on engineered 4-3136
cured at a temperature of 350°C. A stainless steel substrate is used. (a-l) No cracking observed in a 16gm thick film at 4.5% strain. Stainless steel features are visible. (a-2) Brittle cracking observed in a 16.0pm thick film at 5.3% strain. The crack spans the entire vertical dimension has a length greater mm. (b-l) No cracking observed in 12[pm film at 6.3% strain. Stainless steel grain structure is visible. (b-2) Brittle cracking observed in a 12pm film at 7.9% strain. Two cracks are labeled. Crack length is at least mm. (c-l) No cracking observed in a 10pm thick film at 7.9% strain. Grain structure of stainless steel dominates view field. (c-2) Ductile cracks are observed in a 10pm film at a 10.5% strain. Several cracks are labeled. Crack length is -100pm.
(d-l) No cracking observed in a 5pm thick film at 10.5% strain. (d-2) Ductile cracks observed in a 5pm thick film at 15.7% strain. In the inset
a magnified view is shown. The crack length is -50m ... 107 Figure 6-4 Micrographs from bending tests carried out on engineered 4-3136
cured at a temperature of 400°C. A stainless steel substrate is used. (a) Brittle cracking in a 15pm thick film at 1.2% strain. Crack length is at least mm. (Note: This micrograph is previously discussed in Section 3.1.3.) (b) Brittle cracking observed in a 4pm thick film at 1.2% strain.
Numerous cracks are observed throughout the sample ... 109 Figure 6-5 Strain to failure vs. thickness for engineered 4-3136 resin for several
cure temperatures. For a cure temperature of 177°C, the observed critical thickness is -3gm with a strain to failure of approximately 15%. For films cured at 2000C, the observed critical thickness is -4lm with a
strain to failure of 15%. For 225°C cure temperature a critical thickness of -9-10lm is observed and for 300°C cure temperature a critical thickness of -10-11 lm is observed. A gradual transition in the strain to failure as a function of film thickness is observed when the films are cured at 3250C and 350°C. When cured at 400°C, the material exhibits a very low strain to failure for the entire thickness range. (Error bars for
all plots are according to the analysis presented in Section 3.1.2.) ... 110 Figure 6-6 Effect of PDMS concentration on the critical thickness of 4-3136. The
films are cured at 2250C. The strain to failure as a function of film thickness is plotted for three resins: neat 4-3136, 4-3136 modified with 5% PDMS and 4-3136 modified with 10% PDMS. A critical thickness of -4-5pm is observed for the neat resin with a 13% strain to failure. A critical thickness of 6m is observed for the 5% PDMS modified 4-3136 resin with a 14% strain to failure. A critical thickness of 9-10lm
is observed for the 10% PDMS modified 4-3136 resin with a 15% strain to failure. (Error bars for all plots are according to the analysis
presented in Section 3.1.2.) ... 111 Figure 6-7 Effect of test temperature on critical thickness for engineered 4-3136
resin films prepared at two cure temperatures (225°C and 300°C). The strain to failure as a function of the film thickness is plotted for three different test temperatures -40°C, room temperature and 75°C. The critical thickness is nearly independent of test temperature. For films cured at 2250C, the observed critical thickness is -7-8pm for the three test temperatures. For films cured at 3000C, the observed critical
thickness is - 10-11 m for the three test temperatures. (Error bars for all
plots are according to the analysis presented in Section 3.1.2.) ... 112 Figure 6-8 Results of orientation study in carried out on engineered 4-3136 thick
spectra for the two different polarizations. The bottom curve is the resultant difference obtained upon subtraction of the first graph from the
second ... 113
Figure 6-9 Results of orientation study carried out on engineered 4-3136 thin film (7.5 pm). No strain is applied. The top two graphs show the IR spectra for the two different polarizations. The bottom curve is the resultant
difference obtained upon subtraction of the first graph from the second ... 114 Figure 6-10 Results of orientation study carried out on engineered 4-3136 thin
film (7.5pm). The film-substrate combination is elongated to 10%. The top two graphs show the IR spectra for the two different polarizations. The bottom curve is the resultant difference obtained upon subtraction
of the first graph from the second ... 1...1..115 Figure 7-1 Micrographs from bending tests carried out on Methyl-T resin films
cured at a temperature of 250°C. A stainless steel substrate is used. (a-l) No cracking is observed in a 2.3pm thick film at 11% strain. Stainless steel grain structure is visible. (a-2) Ductile cracks observed in 2.3ttm film at 15.0% strain. Cracks extend -100pm across. (b-l) No cracking observed in 0.4gm film at 11.0% strain. Stainless steel grain structure is visible. (b-2) Ductile cracks observed in a 0.4gm film at 15.0% strain. A
magnified picture of the crack is shown in the inset ... 121 Figure 7-2 Micrographs from bending tests carried out on Methyl-T resin films
cured at a temperature of 275°C. A stainless steel substrate is used. (a-l) No cracking observed in a 1.3pm thick film at 2.3% strain. Stainless steel grain structure is visible. (a-2) Brittle cracking observed in a 1.3ptm thick film at 3.1% strain. Crack spans the entire vertical dimension of the micrograph with a length of at least mm. (b-l) No cracking observed in 0.6pm film at 4.5% strain. Stainless steel grain structure is visible. (b-2) Cracking observed in a 0.6pm film at 5.3% strain. Crack length is -20-30,um. (c-l) No cracking observed in a 0.41pm thick film at 6.3% strain. Stainless steel grain structure is visible. (c-2) Cracking observed in a 0.4pm thick film at 7.9% strain. A magnified view of the cracks is shown in the inset. Crack length is -10-20pm. (d-l) No cracking observed in 0.2pm film at 11% strain. Stainless steel grain structure is visible. (d-2) Ductile cracks observed in
a 0.2 pm film at 14.5% strain. Crack length is -20m ... 122 Figure 7-3 Micrographs from bending tests carried out on Methyl-T resin films
cured at a temperature of 450°C. A stainless steel substrate is used. (a-l) Micrograph shows the film edge for a 1.31m film prior to strain application. No cracking is observed in the inner region of the film. Cracks are observed at the film edge. (a-2) Brittle cracking observed in the inner region of the 1.3gm thick film at 1.2% strain. Crack length is at least 100m. (b-l) No cracking observed in 0.6pm film at 1.2%
strain. Grain structure of the stainless steel is visible. (b-2) Cracking observed in a 0.6ptm film at 2.0% strain. The region on the right side of the film is out of focus. Crack length is -40tm ... 124 Figure 7-4 Strain to failure as a function of film thickness for Methyl-T resin
cured at five different cure temperatures. For films cured at 2000C, a
consistent 25% strain to failure is observed for the entire thickness range tested. For films cured at 250C, the observed strain to failure across all thicknesses is 15%. For 275°C cure temperature, a critical thickness value of -0.2pgm is observed with a strain to failure of 15%. No critical thickness effects are observed in films cured at 3000C and 450°C. (Error bars for all plots are according to the analysis presented
in Section 3.1.2.) ... 125 Figure 8-1 Micrographs from bending test results for PF1202 resin cured at
1300C. A polycarbonate substrate is used. (a-1) No cracking in a 1.2[tm thick film at 2.9% strain. Small black spots in the micrographs are dust particles. (a-2) Brittle cracking observed in a 1.2im thick film at 4.0% strain. Crack length is at least mm. (b-1) No cracking observed in 0.3ptm film at 4.8% strain. (b-2) Cracking observed in a 0.3tm film at 6.0% strain. (c-l) No cracking in a 0.1 tm thick film at 6.8% strain. A large dust particle is observed within the film. (c-2) Cracking observed in a 0.1l m thick film at 7.9% strain. (Note: This picture is discussed
previously in Section 3.1.3.) ... 131 Figure 8-2 Micrographs from bending test results for PF1202 resin cured at
130°C. A stainless steel substrate is used. (a-l) A 1.2ptm film is shown prior to strain application. (a-2) Brittle cracking observed in a 1.2[tm film at a strain of 3.6%. Delamination of the film is also observed. (b-1) No cracking observed in 0.3tm film at 6.1% strain. Stainless steel grain structure is visible. (b-2) Cracking is observed in a 0.3 gm film at 7.1%
strain. The crack length is -40tm ... 133 Figure 8-3 Strain to fracture as a function of film thickness for PF-1202 resin
which has been tested using two substrates: stainless steel and polycarbonate. For both cases, the solid line depicts the highest strain sustained at a particular film thickness. The dashed line depicts the next incremental strain level at which failure is observed. The observed critical thickness is 0.2pim. The highest value of fracture strain as observed on films (below critical thickness) prepared on stainless steel is -8%. (Error bars for all plots are according to the analysis presented
in Section 3.1.2.) ... 134 Figure 8-4 Strain to failure as a function of film thickness for MP-101 resin for
several cure temperatures. For room temperature cure, the strain to failure shows a gradual transition across the entire range of film thickness. At a cure temperature of 50°C, the observed critical thickness
is -0.6gm with a strain to failure of -9-10%. For 100°C curing, a gradual transition in failure strain is observed as a function of film thickness. The critical thickness at a 2000C cure temperature is observed to be -0.1-0.2gm with a 4-5% failure strain. At 300°C and 400°C cure temperatures, the fracture strain values are observed to greatly reduce over the entire range of film thickness. (Error bars for all
List of Tables
Table 1: Polystyrene film thickness as a function of the solution concentration used for spin coating ... 142 Table 2: 4-3136 film thickness as a function of the solution concentration used for
spin coating ... 143 Table 3: Engineered 4-3136 film thickness as a function of the solution
concentration used for spin coating ... 144 Table 4: Methyl-T resin film thickness as a function of the solution concentration
used for spin coating ... 145 Table 5: C-resin film thickness as a function of the solution concentration used for
1
Introduction
Polymers are used extensively in many forms for structural applications, 2 optical
applications,3 electronic applications4'5 and biomaterial applications.6 7 The use of
polymers is increasing rapidly and in many applications they are replacing conventional materials such as metals,8 wood9 and natural fibers. Polymers offer many favorable properties including a very high strength to weight ratio, low density and ease of processability. Research on polymers over the last several decades has been carried out to synthesize new polymers, to improve propertiesl° of existing polymers and to develop
new processing" 1,12 as well as characterizations techniques. A significant area of research
has focused on making high fracture toughness polymers since many synthetic polymers are brittle in their natural form.
In this thesis, the phenomenon of critical thickness is studied. Critical thickness is defined as an absolute thickness dimension below which a macroscopically brittle polymer deforms in a ductile manner. The existence of critical thickness in polymers has been postulated recently. 3' 14 Critical thickness effects can be used as a means to achieve high fracture toughness in polymers. Critical thickness is postulated to be a fundamental material property'3 and is therefore applicable to all polymers, thermoplastics or thermosets. In order to demonstrate applicability of the critical thickness phenomenon, silicone thermosets'5are selected. Silicone thermosets are extremely brittle and arguably the most difficult to toughen amongst all polymer classes. The anticipated outcome of this thesis is two-fold. The first goal is to demonstrate validity of the critical thickness
postulate and direct it towards engineering applicability. The second goal is to improve fracture toughness in highly brittle silicone resins.
1.1 Current Polymer Toughening Strategies
Toughened polymers16 -1 8are used in several applications including structural materials,19
engineering plastics, matrices for fiber-composite materials 20 and several household items. Polymer toughening is a multi-billion dollar industry with each engineering plastic having several commercially available toughened versions.2 -27 The most common
methods to make high toughness polymers include manipulation of inherent molecular composition, alteration of molecular structure and incorporation of second phase particles such as rubbers,28 30 inorganic fillers31 and low molecular weight plasticizers.32 These
toughening methods have tremendously broadened the use of many polymers. Some examples of toughened polymers are rubber toughened epoxy resins,21 22 plasticized polyvinylchloride,23 high impact polystyrene (HIPS),24 polymethylmethacrylate25' 26 and
polycarbonate.2 7
From a micromechanical standpoint, the primary reason for toughening a polymer is to improve its resistance to cracking 6 without significantly decreasing other important mechanical properties like modulus and tensile strength. Resistance to cracking within a material is exhibited when either of the following two conditions is met: first, that no cracks initiate and second that if cracks are already initiated, they do not propagate. In all existing toughening techniques the second methodology, i.e. inhibition of crack propagation, is utilized to improve toughness of polymers. In this section, a brief review
of the physics of crack propagation is presented. Further, various possible methods currently used to inhibit crack propagation in polymers are discussed.
Crack growth within polymers has been studied extensively.33' 34 Models for crack growth can be derived using two methods: one based on mechanics3 5and the other based
on energy analysis.3 6 Over the last several decades these models of crack growth have
been refined to a great extent. This refinement results from a continuous improvement in the experimental methods devised to substantiate these models. The model of crack propagation which is discussed below is obtained using a principle of potential energy minimization. Accordingly, the criterion for brittle fracture can be stated as: "the potential energy of an elastically strained body is reduced by the introduction of a crack." Based on this criterion, the generalized mathematical expression for the stress ()
required to create a crack surface is:
2EG
= 12EG Equation 1-1
where E is the Young's modulus, G is the sum of energy dissipated per unit area of crack growth and 'a' is the crack length.
Inhibition of crack propagation in polymers can be achieved in several ways, the most utilized of which is introduction of rubber particles.2 8' 29 Rubber particles provide an
additional stress dissipating mechanism within the system. Mechanistically, addition of these particles allows blunting of the crack tip and therefore inhibits crack growth. Extensive literature is available which document use of rubber toughening in a variety of
*Since both the energy and the mechanics methods provide equivalent results, it is sufficient to elucidate the result from either one for review purposes.
polymers. 28, 29 Rubber toughening can be used provided two conditions are met. First, the
polymer matrix needs to have a certain intrinsic ability to deform plastically. Second, the rubber and matrix materials system should be such that adhesion between them is strong so that other mechanical properties like modulus and strength are not adversely affected. When the matrix does not have the ability to plastically deform it needs to be modified by chemical means, a process akin to changing molecular architecture. Thermoset materials, for example silicone resins3 7and certain epoxy resins38 fall under this class of polymers
requiring molecular architectural modification to be used for practical applications. In another toughening approach, plasticization,3 2 a compatible organic liquid is added within
the matrix to provide more free volume within the polymer. Plasticization has been used most commonly in polyvinylchloride. Other less prevalent methods like cold drawing39 and phase transformation toughening4 0 are material specific and not widely used.
Although abundant literature exists on the subject of polymer toughening and the above described methods have been used successfully for commercial applications there are still several limitations. First, all the above techniques are material specific since polymer modification is required either at the molecular level or through a physical inclusion. The process of polymer modification requires knowledge of materials chemistry since any chemical or physical moieties added to the matrix need to be compatible with it. To devise such methods is extremely challenging, requiring substantial research efforts for each polymer which needs to be toughened. In addition, modification of a material may lead to undesirable consequences such as reduction in Young's modulus or yield strength. Second, explanations of toughening mechanisms are usually retrospective and primarily based on microscopy of fracture patterns. These explanations are usually qualitative.
Therefore development of well defined and generalized polymer toughening rules is severely hindered. Finally, the current techniques focus primarily on inhibition of crack propagation to achieve toughness and not on complete crack elimination. Based on the above information, a new approach to polymer toughening which minimizes material specificity and therefore can be easily applied to brittle polymers would be of much interest.
1.2 Critical Thickness
Until recently, toughness mechanisms and models have been based primarily on macroscopic analyses rather than a bottom-up approach utilizing a molecular level understanding. The first significant advancement in understanding toughness from a molecular point of view is based on experimental work by Kramer.4' These experiments
have focused on deformation within localized regions called crazes. It has been established that the deformation in these localized regions for polystyrene (the polymer chosen for experiments) is at least an order of magnitude higher (>100%) than the bulk material fracture strain value (-3%). However, at this stage, understanding of molecular level toughness had not been envisioned as a means to improve macroscopic toughness.
Taking a cue from these results, VanderSanden13 postulated the existence of a critical
thickness, which is a major advancement in linking molecular level toughness to macroscopic fracture properties. In this postulate, the possibility of utilizing high localized molecular strain levels, for example >100% for polystyrene, as a method to increase macroscopic toughness has been recognized. According to this postulate critical thickness is defined as an absolute thickness dimension below which a macroscopically
brittle polymer no longer exhibits brittle fracture and instead deforms in a ductile fashion. Such a brittle to ductile transition would be observed in one, two or three dimensions. Considering the 1-D case, a film which may be infinitely large in two dimensions and has a thickness less than the critical thickness would undergo ductile deformation. Naturally, this example can be extended to two and three dimensions. Below the critical thickness, strain localization is believed to be absent and therefore the inherent deformation capacity of the polymer is realized. In contrast, the same material in bulk form does not realize its inherent deformation capability since fracture is dominated by cracks which are energetically favorable at low strains.
Indirect experimental results indicate that the critical thickness value for polystyrene is -0.1l Im."3 ,' 4 Further, VanderSanden and co-workers, in a series of publications,42 ' 47 discuss several aspects of the critical thickness phenomenon both using analytical models and experiments. Polystyrene has been used extensively for these experiments. Limited experiments have been carried out on thermoset epoxy materials as well, although a conclusive value of critical thickness for these epoxies has not been determined.43
The "critical thickness" postulate and the experimental work carried out to validate and analyze the various aspects of it, provides a foundation for the possible engineering use of critical thickness to achieve high toughness in polymers. However, limited research work on critical thickness has been reported since VanderSanden's investigations in the mid 1990's. Krupenkin presents4849 a detailed theoretical analysis on two dimensional crazing in polystyrene which is helpful to understand the physical origin of critical thickness. Further experimental work has not been reported.
Although use of critical thickness methods can potentially improve toughness in polymers, the engineering use of it requires overcoming of several challenges. First, direct methods to test for critical thickness have to be devised. In previous experimental methods, critical thickness is defined based on locally thinned regions achieved in bulk polymers by making multilayers or through addition of core-shell particles. Direct investigations to determine critical thickness on thin films have not been carried out till now. Critical thickness investigations in thin films require evaluation of film fracture toughness properties. Since measurement techniques for thin film fracture toughness and failure strain are not well developed, a simple and reliable film toughness measurement process needs to be developed. The second major challenge is to devise methods to increase critical thickness values to levels suitable for thin film production. For example, while a 0.1 m ductile film of polystyrene is scientifically significant, producing it may not be possible. If critical thickness can be increased to -5[tm, the use of critical thickness concepts to make high toughness polymers for commercial applications can become a reality because thin film manufacturing at the 5m and above length scales is feasible. Several applications of such films can be envisioned: multilayer materials, fibers, optical materials and structural plastics.
From a materials engineering perspective, application of critical thickness approach may be more useful in a thermoset than a thermoplastic. Thermosets (crosslinked) as opposed to thermoplastics, are extremely brittle with a strain to failure value of <1%. In fact, there is no known thermoset in bulk form which has a strain to failure value reaching even 2-3%. In contrast, several bulk thermoplastic materials are ductile in their non-modified state. An example is polycarbonate. Therefore a choice of non-modified ductile
thermoplastics is available. For thermoset polymers, on the other hand, toughening is a necessity. A new method which would allow thermosets to achieve a high strain to failure would therefore be extremely useful. A variety of silicone thermosets are being studied to validate as well as capitalize on the critical thickness phenomenon. In addition, polystyrene is being studied as a reference polymer.
1.3 Silicone Resins: Introduction
Silicone polymers are unique materials which combine heat and chemical resistance of inorganic glass with versatility of plastics. In contrast to their organic counterparts, which are long chain carbon molecules, silicone polymers have a silicon-oxygen backbone. The silicone polymers are set apart from carbon polymers by their excellent thermal and oxidation resistance. These superior properties are a consequence of the chemical nature of the backbone. The silicon-oxygen bond is slightly stronger than the carbon-carbon bond leading to excellent thermal stability. Moreover, the silicon-oxygen bond is inert and therefore provides high oxidation resistance. Given their novel properties, silicone materials have been studied extensively (primarily in industrial research laboratories) and put to use for several applications.
There are two categories of silicone polymers: linear and branched. Commercially, over 90% of the worldwide production of silicones is in linear form. Linear silicones have found applications as silicone oils (low molecular weight) and rubbers (high molecular weight). These linear silicones are used for several applications as lubricants, mold release agents, mold materials and fiber adhesives. A common example of a linear
In contrast, branched silicones, often denoted as silicone resins, are highly crosslinked brittle materials. Silicone resins have been utilized to a limited extent as coatings,50' 51
insulation materials for electrical motors, 52 inter-layer dielectrics 53 and ceramics pre-cursors.54 All these applications in which silicone resins are currently being utilized do not primarily require good mechanical properties. As structural materials, silicone resins, have found limited use because of their low fracture toughness and low resistance to crack initiation and propagation.
Silicone resins are also called polysilsesquioxanes. Polysilsesquioxanes have a chemical structure which can be represented by (RSiOm/2)n where R can denote an H (hydrogen), alkyl group or a phenyl group. The value of m can be two, three or four* with n>l. Typically, silicones containing the Methyl silsesquioxane (MeSiO3/2) group, phenyl
silsesquioxane (PhSiO3 /2) group and hydrogen silsesquioxane (HSiO3/2) group are
industrially important. These resins are obtained from hydrolization of oraganotrialkoxysilanes, dialkoxysilanes and tetraalkoxysilanes or a combination of these depending on the eventual desired chemical structure. The crosslinking in these molecules can take place in a number of ways through heat initiation or as a consequence of a condensation reaction. Typical crosslinking reactions are described below:
-Si-OH + R-O-Si- - Si-O-Si + HOR R is an (H or alkyl) group
-Si-CH=CH 2 + H-Si- - -Si-CH 2-CH2
-Si-The poor mechanical properties of silicone resins have been ascribed to the weak inter-chain physical interaction between chain segments as well as the large inter-chain
distance. In order to increase modulus in silicone resins, a relatively high crosslink density is required. In turn, the high crosslink density makes the silicone resin extremely brittle. As an indication of brittleness, the fracture toughness of the toughest commercially available silicone resin is half that of the most brittle epoxy.3 7'55Further,
limited data is available on physical and structural properties of these resins. Besides the standard mechanical properties, like Young's modulus and yield stress, other information like surface tension and details of structural parameters is almost non-existent.
Recently, a Phase-I/Phase-II technique3 7' 55-57 has been successfully used to improve fracture toughness of silicone resins. The Phase-I/Phase-II approach3 7 is based on the polymer toughening strategies described previously in Section 1.1. Phase-I refers to improvement in the intrinsic deformation ability of the matrix through molecular architecture modification whereas Phase-II refers to inclusion of rubber particles within the silicone matrix. Using PDMS as an additive for both Phase-I and Phase-II, the fracture toughness of a commercial poly-phenyl-methyl-silsesquioxane resin (4-3136) is shown to improve from 0.25 MPa mi/2 to 0.55 MPa ml/2.3 755 For another experimental poly-methyl-silsesquioxane (Methyl-T) resin the fracture toughness value is shown to improve by a factor of approximately 1.5 by similar incorporation of PDMS.5 7 The toughness properties of another resin (X1-2672) have also been improved using similar methods.56 The Phase-I/Phase-II toughening methods have allowed the possibility of silicone resins to be considered for structural applications although the toughness of these materials is still very low.
In this thesis, the critical thickness approach will be applied to several of these silicone resins. Although, the Phase-I/Phase-II approach provides for an increase in the fracture
toughness of silicones, the maximum increase that can be achieved is limited to a factor of approximately two. In essence, even after application of the Phase-I/Phase-II techniques on these resins, they still qualify as brittle materials. The critical thickness method provides for a different approach to increase fracture toughness. Through this approach, these materials are envisioned to reach a ductile state thereby leading to a substantial increase in fracture toughness. Such a result would provide a totally new outlook to the application potential of silicone resins. Three different silicones are being studied in this thesis, a poly-phenyl-methyl-silsesquioxane (4-3136), a poly-methyl-silsesquioxane (Methyl-T) and an optical polysiloxane resin (C-resin).
1.4 Organization of Thesis
This thesis is presented in seven sections followed by the conclusion. Chapter 2 gives an overview of critical thickness. First, a discussion on intrinsic deformation mechanisms of polymers is presented. The two intrinsic deformation mechanisms which have been discussed are extension of fibrils in crazes within glassy polymers and theoretical draw ratio. Second, two analytical models are described, one based on an energy approach and the other being a mechanics based model. Using these models, influence of temperature and strain rate on critical thickness is also examined. Next, a discussion on fracture strain is presented since it is the characteristic property used to evaluate toughness in a thin polymer film. Finally, in this chapter a review of two previous indirect methods of measuring critical thickness is presented.
Chapter 3 describes experimental methods used in this thesis. First, a brief description of thin film sample preparation methods is provided. Next, a description of bending as well
as extension experiments used to determine critical thickness is presented. Following these methods, secondary structural and physical properties are listed. These physical properties include network density, molecular composition, molecular orientation and glass transition temperature. They are being discussed in order to understand whether a change in these properties as a function of thickness can be correlated to the brittle to ductile transition observed at the critical thickness.
Chapters 4-8 are on test results. Chapter 4 is on polystyrene which is the reference polymer. Thin film fabrication conditions are described, followed by bending test observations, critical thickness results and infrared spectroscopy results. In Chapter 5 results are presented for a poly-phenyl-methyl-silsesquioxane resin which is commercially used as a laminate binder. This poly-phenyl-methyl-silsesquioxane is the main focus of this study. For this resin, first the thin film fabrication methods are described, followed by critical thickness test results and infra red spectroscopy results. Chapter 6 describes molecular engineering methods as applied to the poly-phenyl-methyl-silsesquioxane resin. A PDMS is added to the neat resin to achieve molecular modification. Thin film fabrication methods and bending test observations for the modified resin are presented. The effect of test temperature and PDMS concentration on the critical thickness value is also studied. Chapter 7 presents thin film fabrication conditions and critical thickness results for a methyl-T silsesquioxane resin. This resin is a high temperature experimental silicone thermoset. In Chapter 8 two commercially available optical coatings (C-resins) are studied. Thin film fabrication conditions are described followed by critical thickness results.
2
Critical Thickness: Review and Models
For polymers which are macroscopically brittle, critical thickness13 is defined as an
absolute dimension at which a material undergoes a brittle to ductile transition. Below critical thickness, the toughness properties of a polymer are dominated by intrinsic deformation behavior of the material. In contrast, toughness properties of bulk materials are governed by extrinsic fracture features like crazes and cracks. In this chapter, polymer intrinsic deformation mechanisms as relating to critical thickness are examined. Two analytical models for critical thickness are presented. Next, influence of network density, temperature as well as strain rate on critical thickness is reviewed. Finally, physical properties for critical thickness evaluation as well as previously used indirect measurement methods'3 for critical thickness are discussed. Although the discussion is
generalized and applicable to all brittle polymers, certain material properties of polystyrene are used to facilitate understanding. Polystyrene is chosen as a representative polymer since extensive information on its physical and structural properties is already available. Moreover, the majority of critical thickness experimental work which has been conducted previously is on polystyrene.
2.1 Basis for Critical Thickness
Critical thickness has been postulated based on molecular level ductility, which is a consequence of the intrinsic deformation ability of a polymer. These intrinsic deformation mechanisms are reviewed below. This discussion is primarily qualitative, emphasizing the conceptual basis for a critical thickness.
2.1.1 Natural Draw Ratio
Typically used to describe the fiber formation process in semi-crystalline polymers, the natural draw ratio58 59quantifies extensibility of a material. The draw ratio () can be expressed as:
L Equation 2-1
where Lo is the original length of the polymer or fiber and L is the length upon extension. Using principles similar to fiber drawing of semi-crystalline materials, toughness in amorphous polymers can be related to the tensile deformation as predicted by the draw ratio. A theoretical maximum draw ratio (,m) of a polymer strand,41 assuming no
occurrence of chain slippage is given by:
l_
2max = d Equation 2-2
where e is the chain contour length and d is the root-mean square end-to-end distance.
After a series of straightforward transformations are applied to Equation 2-2, 41 the draw ratio can be represented as a function of physical parameters of the polymer:
1/2 1/210
2max - 2 Equation 2-3
kM V?2
where p is the density, NA is Avogadro's number, lo is the average projected length of the polymer chain, Mo is the molecular weight, k is a constant and ve is the entanglement
The theoretical value of draw ratio for amorphous polymers can be as high as 4 (corresponding to an engineering strain to break of 300%), 6° as calculated for a
polybutylstyrene. For a densely crosslinked thermoset network, the theoretical value of the draw ratio can be as high as about 1.2 (corresponding to an engineering strain to break of about 20%).6 1In practice, however, experimentally measured strain to failure
values are much lower, with polystyrene sustaining a maximum 1-3% strain and thermosets sustaining a maximum 1% strain. The explanation for this discrepancy is attributed to the localization of strain within specific deformation regions.6 2 63 Extensive
study of the two commonly observed localized deformation regions, crazing6 2 and shear
yielding,63 which occur during brittle fracture have been carried out in the past.
As opposed to a bulk polymer, where fracture properties do not match up to the draw ratio, at reduced lengths scales i.e. below a "critical thickness" it is conceived13' 14 that the
draw ratio may be of significance in determining fracture properties. Extension values comparable to the draw ratio may be achievable below the critical thickness.
2.1.2 Extension of Fibrils in Glassy Polymers
Craze formation is one of the two main deformation mechanisms in polymers. These craze structures form within a polymer upon tensile deformation (Figure 2-1(a)). Crazes eventually lead to cracking. A craze structure schematic is presented in Figure 2-1(b). Crazes develop in a plane perpendicular to the principal deformation axis. The strain in the material is localized within the craze. The craze is surrounded by unstrained polymer *The other deformation mechanism in polymers is called shear yielding.63 It has been proposed that crazing occurs in polymers with network density values less than 9x 1025chains m-3. Polymers with network
density values above 9x10² 5chains m3 deform primarily by shear yielding. Since the scope of the discussion is limited to extension values achieved within craze structures, a discussion on shear yielding or a comparison between shear yielding/crazing is not particularly relevant and is therefore not presented.