HAL Id: hal-01195505
https://hal.archives-ouvertes.fr/hal-01195505
Submitted on 24 Apr 2020
HAL is a multi-disciplinary open access archive for the deposit and dissemination of sci-entific research documents, whether they are pub-lished or not. The documents may come from teaching and research institutions in France or abroad, or from public or private research centers.
L’archive ouverte pluridisciplinaire HAL, est destinée au dépôt et à la diffusion de documents scientifiques de niveau recherche, publiés ou non, émanant des établissements d’enseignement et de recherche français ou étrangers, des laboratoires publics ou privés.
functioning by meta-omics analyses
Eric Dugat-Bony, Cecile Straub, Aurélie Teissandier, Djamila Onesime,
Valentin Loux, Christophe Monnet, Francoise Irlinger, Sophie
Landaud-Liautaud, Marie Noelle Leclercq-Perlat, Pascal Bento, et al.
To cite this version:
Eric Dugat-Bony, Cecile Straub, Aurélie Teissandier, Djamila Onesime, Valentin Loux, et al.. Overview of a surface-ripened cheese community functioning by meta-omics analyses. PLoS ONE, Public Library of Science, 2015, 10 (4), pp.e0124360. �10.1371/journal.pone.0124360�. �hal-01195505�
Overview of a Surface-Ripened Cheese
Community Functioning by Meta-Omics
Analyses
Eric Dugat-Bony1,2☯, Cécile Straub1,2☯, Aurélie Teissandier3,4, Djamila Onésime5,6, Valentin Loux7, Christophe Monnet1,2, Françoise Irlinger1,2, Sophie Landaud2,1, Marie-Noëlle Leclercq-Perlat1,2, Pascal Bento7, Sébastien Fraud8, Jean-François Gibrat7, Julie Aubert3,4, Frédéric Fer1,2,3,4, Eric Guédon5,6, Nicolas Pons9, Sean Kennedy9, Jean-Marie Beckerich1,2, Dominique Swennen1,2, Pascal Bonnarme1,2*
1 INRA, UMR 782 Génie et Microbiologie des Procédés Alimentaires, F-78850, Thiverval-Grignon, France, 2 AgroParisTech, UMR 782 Génie et microbiologie des procédés alimentaires, F-78850, Thiverval-Grignon, France, 3 AgroParisTech, UMR 518 Mathématiques et Informatiques Appliquées, F-75231, Paris, France, 4 INRA, UMR 518 Mathématiques et Informatiques Appliquées, F-75231, Paris, France, 5 INRA, Institut Micalis, F-78352, Jouy-en-Josas, France, 6 AgroParisTech, Institut Micalis, F-78352, Jouy-en-Josas, France, 7 INRA, UR1404 Mathématiques et Informatique Appliquées du Génomeà l’Environnement, F-78352, Jouy-en-Josas, France, 8 Actalia, F-74801, La Roche sur Foron, France, 9 INRA, US 1367 Metagenopolis, F-78352, Jouy-en-Josas, France
☯ These authors contributed equally to this work. *[email protected]
Abstract
Cheese ripening is a complex biochemical process driven by microbial communities com-posed of both eukaryotes and prokaryotes. Surface-ripened cheeses are widely consumed all over the world and are appreciated for their characteristic flavor. Microbial community composition has been studied for a long time on surface-ripened cheeses, but only limited knowledge has been acquired about its in situ metabolic activities. We applied metagenomic, metatranscriptomic and biochemical analyses to an experimental surface-ripened cheese composed of nine microbial species during four weeks of ripening. By combining all of the data, we were able to obtain an overview of the cheese maturation process and to better un-derstand the metabolic activities of the different community members and their possible inter-actions. Furthermore, differential expression analysis was used to select a set of biomarker genes, providing a valuable tool that can be used to monitor the cheese-making process.
Introduction
Microbial communities are of major importance in the fermentation of food products. Fer-mentation remains a widespread means for food processing and preservation, and fermented foods (including cheese) are widely consumed worldwide. The composition and behavior of the microbial communities in a cheese are important for its characteristic organoleptic prop-erties, shelf life and safety [1]. These communities are involved in the generation of a wide a11111
OPEN ACCESS
Citation: Dugat-Bony E, Straub C, Teissandier A, Onésime D, Loux V, Monnet C, et al. (2015) Overview of a Surface-Ripened Cheese Community Functioning by Meta-Omics Analyses. PLoS ONE 10(4): e0124360. doi:10.1371/journal.pone.0124360 Academic Editor: Danilo Ercolini, University of Naples Federico II, ITALY
Received: December 20, 2014
Accepted: March 2, 2015 Published: April 13, 2015
Copyright: © 2015 Dugat-Bony et al. This is an open access article distributed under the terms of the
Creative Commons Attribution License, which permits unrestricted use, distribution, and reproduction in any medium, provided the original author and source are credited.
Data Availability Statement: All relevant data are within the paper and its Supporting Information files.
Funding: This work was supported by the ExEco program (a joint metatranscriptomic and biochemical approach to the cheese ecosystem: for an improved monitoring of the expression of a complex food ecosystem) (ANR-09-ALIA-012-01), funded by the French National Research Agency (ANR). The funders had no role in study design, data collection and analysis, decision to publish, or preparation of the manuscript.
range of diverse beneficial functions as a result of individual metabolism and/or complex eco-logical interactions [2].
To date, a plethora of work related to functions of technological interest have been pub-lished on cheese-inhabiting microorganism. Such studies mainly concern the ability of those microorganisms to generate functions such as proteolysis [3], lipolysis [4] and/or catabolic routes leading to aroma compound production [5–7]. However, although some microorgan-isms that inhabit cheese are known to be key drivers of the ripening process, our understanding of how individual microbes and microbial groups change over time within the cheese matrix and contribute to the structure and function of specific communities remains incomplete.
With the recent advances in high-throughput sequencing technologies (HTS), sensitive pro-filing of microbial communities from fermented food products can now be performed on an unprecedented scale via the massive sequencing of short DNA fragments [8,9]. Metagenomic studies, including both meta-barcoding (e.g., the deep-sequencing of variable regions of the prokaryotic SSU rRNA gene or of the fungal ITS) and whole metagenome sequencing projects, have made it possible to characterize the microbial community composition of many cheese varieties and to access the diversity of sub-dominant populations [10–13]. Furthermore, ge-nome sequencing of several representative strains isolated from cheese or used as starter cul-ture in the cheese-making process has allowed us to access their metabolic arsenal [14–16]. The next step towards a better understanding of how the cheese ecosystem functions would be to evaluate the expression of these genes in situ. As recently demonstrated for a Camembert-type cheese, this is feasible through metatranscriptomic analyses using RNA sequencing [17]. In this example, the authors followed the metabolic activity of a relatively simple community essentially composed of a yeast, Geotrichum candidum, and a fungus, Penicillium camemberti, and highlighted key functions and metabolic pathways that are expressed during the ripening process. Because the genome of these organisms were not available, de novo assembly of the RNA-Seq data (long reads) was required prior to functional assignment of the resulting con-tigs. This approach could be applied to more complex cheese microbial communities compris-ing both fungal and bacterial species. In this case, short reads analysis offercompris-ing a higher sequencing depth is preferable, but it would be highly desirable to have the annotated reference genomes of all of the species.
In the present work, we combined microbiological, biochemical, metagenomic (DNA-Seq) and metatranscriptomic (RNA-Seq) data collected from a simplified microbial community ca-pable of reproducing the complex metabolic pattern of cheese maturation [18,19]. To facilitate these analyses, we established a reference database of all the genomes of the studied communi-ty, onto which sequence reads could be mapped. The main objective of the study was to obtain a global view of the dynamics of the microbial community structure as well as the expression profiles of its metabolic potential throughout a ripening cycle at different scales—whole micro-bial community down to the gene level. Moreover, differential analysis of the ecosystem’s meta-transcriptome was performed which should enable us to propose a set of biomarker genes that are representative of the most active species at various stages of ripening. Thus, we expect to re-veal the sequential development and/or metabolic features of microbial species, and possibly highlight metabolic complementarities and possible interaction phenomena that sustain the expression of important functionalities of technological interest.
Materials and Methods
Cheese production
Full details on microorganisms used for cheese ripening and cheese production are given in the
S1 File. Briefly, cheese production was performed with 120 L of pasteurized milk, under aseptic
Competing Interests: The authors have declared that no competing interests exist.
conditions in a sterilized chamber [20]. A lactic starter culture containing Lactococcus lactis subsp. lactis S3+ and S3- inoculated at concentrations equivalent to 2 x 10⁶and 4 x 10⁶CFU/ mL, respectively, was used in combination with a mix of Kluyveromyces lactis 3550 (104CFU/ mL), Debaryomyces hansenii 304 (104CFU/mL) and Geotrichum candidum ATCC 204307 (103CFU/mL). Next, 120 mL of a filter-sterilized CaCl2solution (10%) and 40 mL of rennet
(20 mg/L of chymosin (Chr. Hansen, Arpajon, France)) were added to allow the milk to coagu-late. The curd was cut into small cheeses (diameter: 5 cm; height: 1.5 cm; weight: 26 g) and im-mersed in sterile brine (270 g/L NaCl, pH 5.5 measured using a contact electrode) to obtain a salt concentration of 1.7%. The five ripening bacteria (Corynebacterium casei UCMA 3821, Brevibacterium aurantiacum ATCC 9174, Arthrobacter arilaitensis CIP 108037, Staphylococcus equorum Mu2 and Hafnia alvei GB001) were inoculated onto the surface of the cheese at a rate of 2 x 10⁵CFU/g. The inoculated cheeses were ripened for four weeks at 14°C and 97% relative humidity in sterile crystallizing basins.
Cheese sampling and microbial analyses
Samples were collected on days 1, 7, 14, 21 and 31. Day 1 corresponds to the cheese curd (be-fore immersion in brine). Three crystallizing basins (corresponding to three replicates) were analyzed at each time-point. As all cheeses were produced from the same batch of milk and in-oculum, these replicates should not been considered as true biological replicates. The four small cheeses in each crystallizing basin were crushed and homogenized with sterile forks and knives. Serial dilutions were performed in 9 g/L NaCl from one gram of cheese and plated in triplicate on agar plates. Three selective culture media were used: brain heart infusion (Biokar Diagnostics) with amphotericin (50 mg/L) for cheese-surface bacteria, de Man-Rogosa-Sharpe (pH 6.5, Biokar Diagnostics) with amphotericin (50 mg/L) for lactic acid bacteria, and yeast ex-tract-glucose-chloramphenicol (Biokar Diagnostics) with 2,3,5-triphenyltetrazolium chloride (10 mg/L) for yeasts. The strains could be selectively counted on these media because each had a distinct morphotype.
Biochemical analyses
Lactose and lactate concentration. The lactose and lactate contents of cheeses were deter-mined by high-performance liquid chromatography (HPLC), as previously described [20]. Briefly, a cheese suspension was prepared with finely ground cheese (7.5 g and 10 g for lactose and lactate, respectively) and 10 mL of distilled water. After incubation for 1 h at 50°C, it was homogenized for 2 min at 25000 rpm using a mechanical blender (Ultra-Turrax model T25, Ika Laortechnik).
For lactose measurement, 12.5 mL of Carrez I solution (150 g K4(Fe(CN)6), 3H2O /L water),
12.5 mL of Carrez II solution (240 g Zn(CH3COO)2, 2 H2O /L water) and 2.5 mL of 1 M NaOH
were added to the suspension. After homogenization and incubation for 1 h at 25°C, the sus-pension was filtered through Whatman paper n°42 (GE Healthcare) and through a cellulose fil-ter of 0.22μm porosity (Minisart SP25, Sartorius). Finally, the filtrate was analyzed by HPLC.
For lactate measurement, 10 mL of 240 g/L trichloroacetic acid (TCA) and 10 mL of water were added to the suspension after cooling at 25°C. The mixture was incubated for 1h at 25°C and filtered through Whatman paper n°42 (GE Healthcare). Finally, the filtrate was analyzed by HPLC.
Free amino acids concentration. A cheese suspension was prepared from 5 g of cheese and 45 mL of distilled water. It was homogenized for 2 min at 25000 rpm using a mechanical blender (Ultra-Turrax model T25, Ika Laortechnik) and incubated for 30 min at 50°C. After centrifugation for 30 min at 5000 x g and 4°C, the supernatant was filtered through Whatman
paper n°42 (GE Healthcare). The free amino acids concentration was measured on the filtrate according to the ninhydrin method [21] and quantified using leucine as a standard.
Proteolysis index. A cheese suspension was prepared from 10 g of cheese and 90 mL of distilled water. It was homogenized for 2 min at 25000 rpm using a mechanical blender (Ultra-Turrax model T25, Ika Laortechnik). This suspension was used for both total nitrogen and non-casein nitrogen content measure.
Total nitrogen content was measured directly on the cheese suspension using the Kjeldahl method according to standard NF EN ISO 8968–1.
The non-casein nitrogen content (soluble at pH 4.6) was measured according to the proce-dure described in standard NF ISO 27871. The cheese suspension was adjusted to pH 4.6 using 5N HCl and filtered through Whatman paper n°42 (GE Healthcare). The nitrogen content of this soluble fraction was measured using the Kjeldahl method according to standard NF EN ISO 8968–1.
The proteolysis index was calculated by dividing the soluble nitrogen content by the total ni-trogen content and multiplying by 100, as previously described [22].
Lipolysis index. The lipolysis index corresponds to the quantity of KOH (in mg) required to neutralize the free fatty acids contained in 1 g of cheese. It was determined by adapting the ti-trimetric measurement described by Mouillet et al. [23]. Briefly, 2.5 g of cheese was homogenized for 2 min at 25000 rpm using a mechanical blender (Ultra-Turrax model T25, Ika Laortechnik) in 22.5 mL of ethanol/diethyl ether (1:1 v/v) in order to extract fat content. The suspension was filtered through Watman paper No. 42 (GE Healthcare) and the acidity of the filtrate was mea-sured by standard titration with 1M KOH in ethanol using phenolphthalein as a color indicator.
Metagenomic and metatranscriptomic analyses
Extraction of DNA from cheese samples. Total genomic DNA was obtained after casein solubilization and cell recovery from two grams of cheese by adapting the method described by Baruzzi et al. [24]. Cheese samples were mixed with 18 mL of sodium citrate solution (20 g/L trisodium citrate dihydrate) and the mixture was dispersed for 2 min at 24,000 rpm with a me-chanical blender (Ultra-Turrax model T25, Ika Laortechnik). A second dispersion was per-formed after 10 min of incubation at room temperature. The mixture was then centrifuged at 6,400 x g for 10 min at 4°C, and the supernatant was removed. The casein pellet (containing the microbial cells) was resuspended in 5 mL of a Triton X-100 aqueous solution (2.5% v/v), vigorously shaken, heated in a water bath at 70°C for 10 min, centrifuged at 6,400 x g for 10 min at 4°C, and rinsed twice in physiological saline solution. The pellet was dissolved in a mix-ture of 270μL of guanidium thiocyanate (4 M) in Tris-HCl (pH 7.5, 0.1 M) and 30 μL of sodi-um lauroyl sarcosinate (100 g/L), and transferred to a 2 mL tube containing 250 mg of 0.1 mm-diameter zirconium beads and 250 mg of 0.5 mm-mm-diameter zirconium beads (Sigma, St-Quen-tin-Fallavier, France). Proteinase K treatment, bead-beating, phenol-chloroform extraction, RNase treatment and ethanol precipitation were then performed as previously described by Leclercq-Perlat et al. [25]. The DNA pellet was dissolved in 120μL of Tris EDTA buffer (10 mM Tris-HCl, pH 8.0, 1 mM EDTA).
Extraction of RNA from cheese samples. Total RNA was extracted from 500 mg cheese samples without the prior separation of microbial cells, as previously described [26]. Three sep-arate extractions were performed for each cheese sample and pooled before library construc-tion. The quality of total RNA was analyzed with a 2100 Bioanalyzer and RNA 6000 NANO chips (Agilent, Palo Alto, CA, USA).
DNA and cDNA library construction and SOLiD sequencing. Library construction and SOLiD sequencing were performed at the INRA MetaQuant facility (Jouy-en-Josas, France).
The DNA libraries were constructed from 3μg of total DNA by using the SOLiD Fragment Li-brary Construction Kit (Applied Biosystems, Bedford, MA, USA) and then barcoded with the SOLiD Fragment Library Barcoding Kit. DNA samples collected at day 1 did not allow to con-struct libraries that meet the quantity and quality criteria enabling to perform sequencing and, thus, were excluded from this study. The cDNA libraries were constructed from 200 to 500 ng total RNA using a SOLiD Whole Transcriptome Analysis Kit and were barcoded with the SOLiD Transcriptome Multiplexing Kit. The SOLiD ePCR kit and SOLiD Bead Enrichment Kit were used to process DNA and cDNA samples for sequencing, and the SOLiD 4 System was used for sequencing.
Reads processing and mapping. Short sequence reads of 35 bp were mapped (a maximum of three mismatches were allowed) onto a reference composed of the nine sequenced strains of microorganisms (Table 1) using Bowtie software (version 0.12.7) [27].
After the smart filtering of multiple reads, the numbers of reads mapped onto the reference were counted with METEOR software [28]. Only uniquely mapped reads were further ana-lyzed. General library statistics are available inS1 Table.
DNA-Seq data analyses. For each microorganism, sequencing coverage was estimated with the Lander/Waterman equation [29]: C = LN / G, where C is the coverage, L is the read length, N is the number of reads and G is the haploid genome length.
RNA-Seq data analyses. Sequence reads mapping to the coding DNA sequence (CDS) fea-tures were retrieved from the raw dataset.
First, functional classification of the metatranscriptomic dataset was performed using the Kyoto Encyclopedia of Genes and Genomes (KEGG) annotations [30]. To do this, data were filtered to remove genes displaying an average of less than five reads per sample across the en-tire dataset (15 samples) and normalized according to the library size using custom scripts built under the statistical environment R (http://www.r-project.org/).
Second, differential expression analysis over time was done by comparing the number of mapped reads for each gene at two different time-points (n = 3 per ripening time). For this analysis, data (six samples for each comparison) were filtered: (i) genes with less than five mapped reads were eliminated; and (ii) genes whose replicates were heterogeneous were dis-carded (variation coefficient> minimum mean observed for the two groups of three repli-cates). Data normalization and determination of differentially expressed genes were then conducted using the Bioconductor DESeq2 package in the statistical environment R [31,32]. Raw p-values were adjusted for multiple testing using the Benjamini-Hochberg procedure [33], which assesses the False Discovery Rate. Gene transcripts with an adjusted p-value< 0.05 were considered to be differentially abundant between two ripening times.
Sequence accession numbers
The raw SOLiD read data for all samples was deposited in the European Bioinformatics Institu-te's European Nucleotide Archive under the accession number PRJEB6315. Accession numbers of reference genomes are given inTable 1.
Results and Discussion
Overview of the cheese microbial community composition and activity
during ripening
In order to estimate the overall contribution of each microorganism throughout the cheese-rip-ening kinetics, we used three complementary approaches: microbiological counting providing a measurement of the viable cells, metagenomic sequencing (DNA-Seq) indicating the
proportion of DNA molecules from both viable and dead cells in each sample, and metatran-scriptomics (RNA-Seq) reflecting the active populations (Fig 1).
Growth measurements revealed that the early development of yeasts, especially D. hansenii and G. candidum, contributed to the increase in the pH of the cheese curd (Fig 1A), which, in turn, prompted the development of acid-sensitive bacteria (A. arilaitensis, H. alvei, B. aurantia-cum, S. equorum, C. casei). The lactic acid bacterium L. lactis was the most prominent bacterial
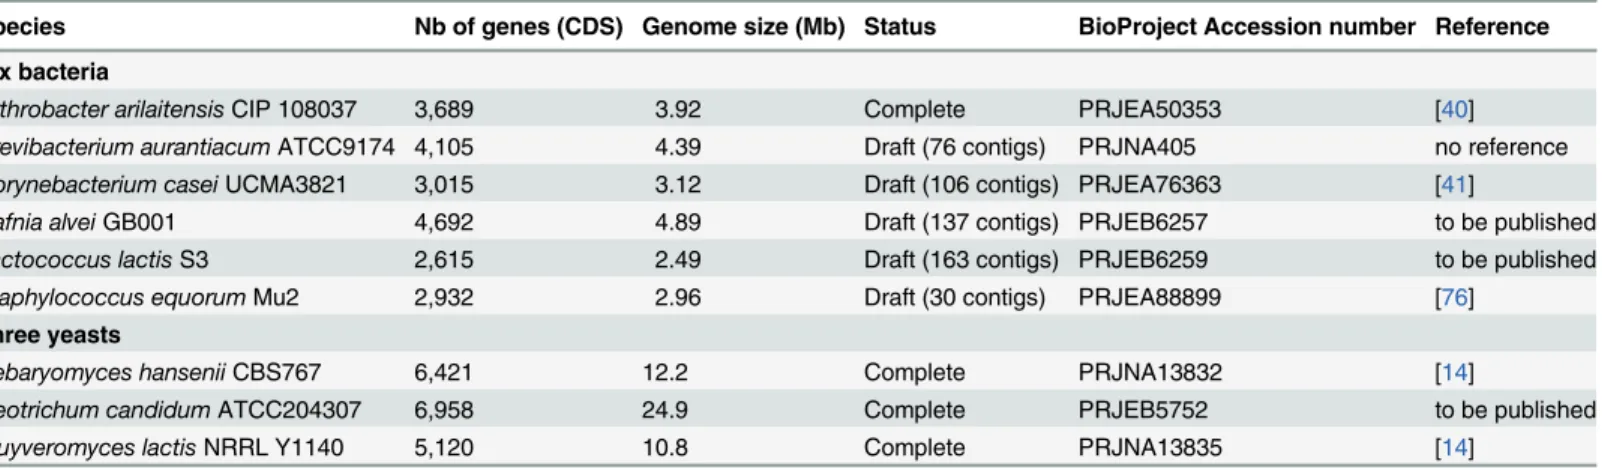
Table 1. Reference genomes used for mapping of the sequence reads.
Species Nb of genes (CDS) Genome size (Mb) Status BioProject Accession number Reference Six bacteria
Arthrobacter arilaitensis CIP 108037 3,689 3.92 Complete PRJEA50353 [40] Brevibacterium aurantiacum ATCC9174 4,105 4.39 Draft (76 contigs) PRJNA405 no reference Corynebacterium casei UCMA3821 3,015 3.12 Draft (106 contigs) PRJEA76363 [41]
Hafnia alvei GB001 4,692 4.89 Draft (137 contigs) PRJEB6257 to be published Lactococcus lactis S3 2,615 2.49 Draft (163 contigs) PRJEB6259 to be published Staphylococcus equorum Mu2 2,932 2.96 Draft (30 contigs) PRJEA88899 [76]
Three yeasts
Debaryomyces hansenii CBS767 6,421 12.2 Complete PRJNA13832 [14]
Geotrichum candidum ATCC204307 6,958 24.9 Complete PRJEB5752 to be published Kluyveromyces lactis NRRL Y1140 5,120 10.8 Complete PRJNA13835 [14]
doi:10.1371/journal.pone.0124360.t001
Fig 1. Changes in the microbial community structure during surface-ripened cheese maturation. (A) Microbiological counts and pH measurements. (B) Distribution of metagenomic data by species. (C) Distribution of metatranscriptomic data by species (only reads mapping CDS features were taken into account). SE: Staphylococcus equorum. BA: Brevibacterium aurantiacum. AA: Arthrobacter arilaitensis. HA: Hafnia alvei. CC: Corynebacterium casei. DH: Debaryomyces hansenii. GC: Geotrichum candidum. KL: Kluyveromyces lactis. LL: Lactococcus lactis. NA: data not available.
population until day 14, but did not grow during the ripening process. Kluyveromyces lactis was detected at day 1 but was not detectable thereafter. C. casei was the dominant bacterium at the end of the ripening process (~109CFU/g of cheese). Geotrichum candidum was the major yeast at day 7. At the end of the ripening process (day 31), the populations of G. candidum and D. hansenii were 7 x 10⁷CFU and 1 x 10⁷CFU/g of cheese, respectively. The pH of the cheese curd increased from 4.6 at the beginning of ripening to 7.5 at day 31.
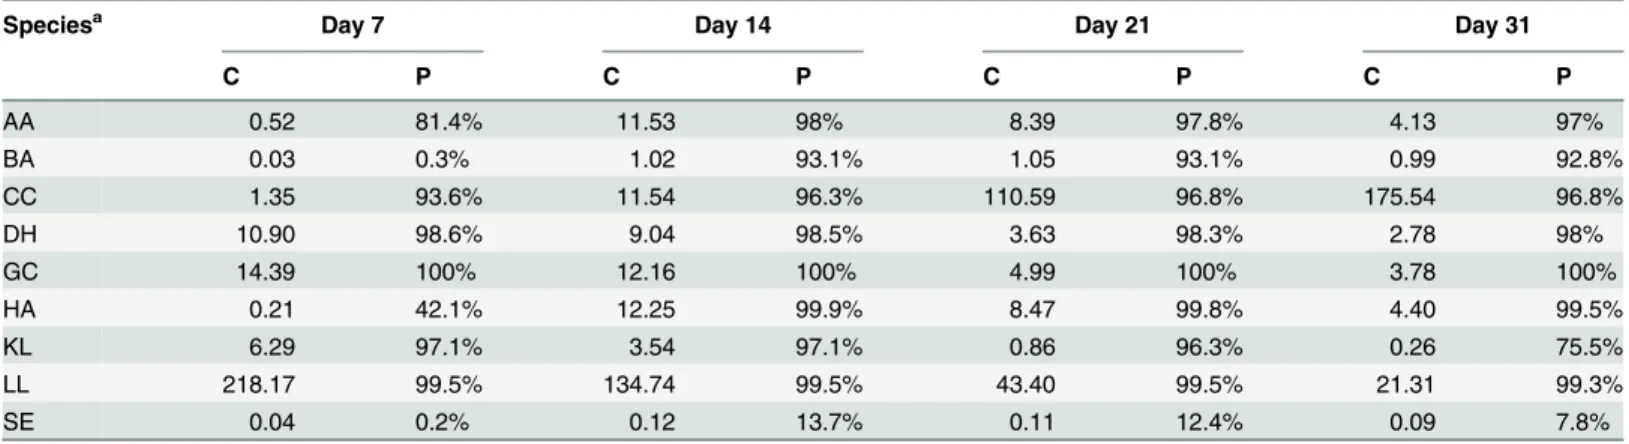
Similar trends were observed between microbiological counts and DNA-Seq data (Fig 1B). The proportions of reads attributed to each microorganism revealed a co-dominance of L. lactis and yeasts during the first two weeks of the ripening process, which were progressively replaced by surface bacteria, principally C. casei (71% of the total reads at day 31). S. equorum exhibited the lowest genome coverage in our dataset with a maximum of 0.12 X at day 14 (Table 2). In contrast, abundant species such as L. lactis and C. casei showed the highest genome coverages with 218 X for the former (day 7) and 176 X for the latter (day 31). The most abundant yeast, G. candidum, displayed a maximum coverage of 14 X at day 7. The differences observed be-tween CFU counting (Fig 1A) and the proportions of DNA-Seq reads per species (Fig 1B) might be due to several reasons. First, CFU counting is supposed to measure living cells where-as DNA sequencing target both living and dead cells. Second, CFU counting may provide an al-tered view of the living community structure because of viable but nonculturable (VBNC) issues, the number of individual cells generating every colonies or the difficulty to count some species (such as G. candidum which is a filamentous yeast). Third, DNA extraction bias (not as-sessed in this study), especially the cell separation step, as well as genome size may influence the proportion of reads by species observed with DNA-Seq.
RNA-Seq data indicated that L. lactis and K. lactis were the most active species at day 1 (77% and 13% of total CDS reads, respectively) (Fig 1C). The proportion of reads from G. candidum ac-counted for 84% of total CDS reads at day 7 and remained highly dominant over time (with 65% of total CDS reads at day 31). Read counts corresponding to D. hansenii transcripts increased from day 1 (1%) to day 14 (9%) and remained stable thereafter. Ripening bacteria, especially C. casei and H. alvei, were mainly detected at the end of ripening with RNA-Seq (9% and 7% of the CDS reads at day 31, respectively). Again, RNA extraction efficiency might be variable between microorganisms (especially between eukaryotes and prokaryotes) and maybe also between ripen-ing times. This may have influenced the distribution of reads observed with this dataset.
Table 2. Sequencing coverage (C) and percentage of genes (P) with at least an average of five uniquely mapped reads in the DNA-Seq dataset across the three replicates for each microbial genome during ripening.
Speciesa Day 7 Day 14 Day 21 Day 31
C P C P C P C P AA 0.52 81.4% 11.53 98% 8.39 97.8% 4.13 97% BA 0.03 0.3% 1.02 93.1% 1.05 93.1% 0.99 92.8% CC 1.35 93.6% 11.54 96.3% 110.59 96.8% 175.54 96.8% DH 10.90 98.6% 9.04 98.5% 3.63 98.3% 2.78 98% GC 14.39 100% 12.16 100% 4.99 100% 3.78 100% HA 0.21 42.1% 12.25 99.9% 8.47 99.8% 4.40 99.5% KL 6.29 97.1% 3.54 97.1% 0.86 96.3% 0.26 75.5% LL 218.17 99.5% 134.74 99.5% 43.40 99.5% 21.31 99.3% SE 0.04 0.2% 0.12 13.7% 0.11 12.4% 0.09 7.8%
aAA = Arthrobacter arilaitensis; BA = Brevibacterium aurantiacum; CC = Corynebacterium casei; DH = Debaryomyces hansenii; GC = Geotrichum candidum; HA = Hafnia alvei; KL = Kluyveromyces lactis; LL = Lactococcus lactis; SE = Staphylococcus equorum
Overall, the results highlighted the successive development and metabolic activity of differ-ent microbial groups, L. lactis and K. lactis at the beginning of cheese maturation, followed by G. candidum and D. hansenii and, finally, acid-sensitive bacteria. This dynamics is in accor-dance with other studies conducted on surface-ripened cheese, which depicted a similar devel-opment sequence of the microbial species [19,34,35]. However, we provide new information here with respect to the metabolic activity of the different cheese-ripening populations.
Functional expression of the cheese ecosystem over time
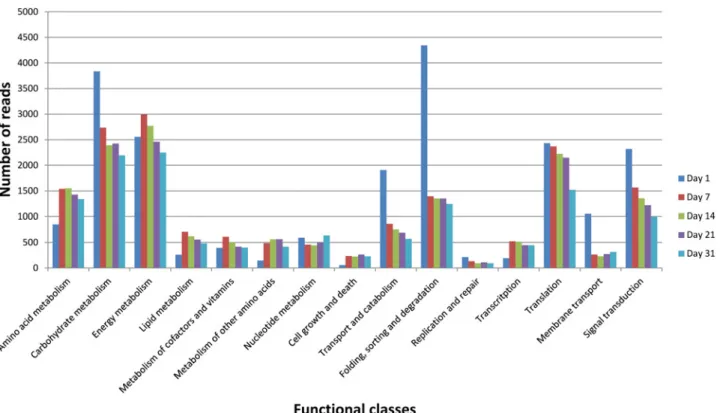
The global expression pattern of the cheese ecosystem throughout the ripening process was evaluated by normalizing all data by library size (S2 Table) and classifying RNA-Seq reads ac-cording to KEGG annotations (Fig 2). Data were also mapped onto the KEGG general map to obtain a dynamic view at the ecosystem level and per microbial species (S1 Fig). The KEGG categories—Amino acid metabolism, Carbohydrate metabolism, Energy metabolism, Trans-port and catabolism, Folding, sorting and degradation, and Translation and Signal transduc-tion—accounted for the most abundant transcripts throughout the ripening period. These data are consistent with those observed on a Camembert-type cheese using a similar approach [17]. Differences in the expression dynamics between the functional classes were observed. However, this possibly reflected changes of several distinct metabolic pathways and required a more de-tailed analysis. Furthermore, it should be noticed that a great proportion of reads (between 69 and 81% depending on the sample) mapped genes without ortholog in the KEGG database. This included both annotated genes such as those encoding non enzymatic proteins or en-zymes not yet referenced in KEGG pathways, as well as unknown genes.
Fig 2. Functional classification of the metatranscriptome during surface-ripened cheese maturation. Functional classes were determined according to KEGG annotations. Read counts corresponding to all species were cumulated. Read numbers were normalized (according to the library size) to 50,000 reads per sampling day.
Energy metabolism and iron homeostasis. The great majority of genes involved in energy production detected in our metatranscriptomic dataset were involved in the oxidative phos-phorylation pathway (PATH:ko00190) (S2 Fig). As expected, the dynamics in the detection of transcripts involved in this pathway followed the changes in the community structure observed using microbial counts (Fig 1A). G. candidum genes encoding ATPases (EC:3.6.3.14 and 3.6.3.6), NADH dehydrogenase (EC:1.6.5.3) and cytochrome C oxidase (EC:1.9.3.1) accounted for the most frequently detected genes (S2 Table). Their maximum detection levels were ob-served between days 7 and 21. At day 1, it was possible to observe transcripts of genes encoding K. lactis ATPase (EC:3.6.3.6) and L. lactis ATPase (EC:3.6.3.14), NADH dehydrogenase (EC:1.6.99.3) and cytochrome D ubiquinol oxidase (EC:1.10.3.-), which reflected the early growth of these two microbial species. At the late stage of ripening (days 21 to 31), the detec-tion of gene transcripts involved in the oxidative phosphoryladetec-tion pathway from H. alvei, C. casei and, to a lesser extent, A. arilaitensis increased.
Metals ions, especially iron, are cofactors and/or components of various enzymatic systems involved in key microbial metabolisms (e.g., respiration). In cheese, iron often forms complexes with various curd components such as proteins (e.g., lactoferrin, ferritin and casein) and pep-tides, leading to low bioavailability [36]. Eukaryotic and prokaryotic microorganisms have dif-ferent specific systems to transport metals. Numerous bacteria synthesize and excrete
siderophores to trap iron [37]. However, some yeasts, including K. lactis, D. hansenii and G. candidum, express different siderophore transport systems to take advantage of siderophores present in their environment [38,39]. Another interesting feature is that fungal genes encoding iron high-affinity transport systems are generally induced under iron starvation conditions [38]. In our metatranscriptome, gene transcripts related to iron capture and/or transport were frequently detected (S2 Table), which may indicate a need for iron mobilization within the mi-crobial community. For instance, feoB transcripts encoding a ferrous iron transport protein in L. lactis were mainly detected at day 1, transcripts of SIT1 encoding a ferrioxamine B transport-er in G. candidum wtransport-ere essentially detected from day 7 to day 21, and transcripts of sevtransport-eral iron-siderophore ABC transporters from C. casei (locus tag CCAS_01175, CCAS_03565, CCAS_00130, CCAS_05220, CCAS_05225, CCAS_12545, CCAS_12550, CCAS_12555, CCAS_10415) were mainly detected at day 31. Furthermore, sequence reads mapping to genes encoding high-affinity iron transport systems from both G. candidum (e.g., FTR1, FET3, FTH1), D. hansenii (e.g., FET3) and K. lactis (e.g., FTH1) were also detected in our conditions. Surprisingly, we did not observe bacterial transcripts for genes possibly involved in siderophore biosynthetic pathways, although A. arilaitensis, C. casei and B. aurantiacum are known to carry such pathways in their genome [26,40,41]. This could be due to an insufficient sequencing depth for cheese-surface bacterial species. A second hypothesis, which requires complementary analysis to be confirmed, could be that peptides released during the ripening process through casein hydrolysis would act as iron trappers, as suggested by [36], and be used as siderophore-like complexes by members of the microbial community.
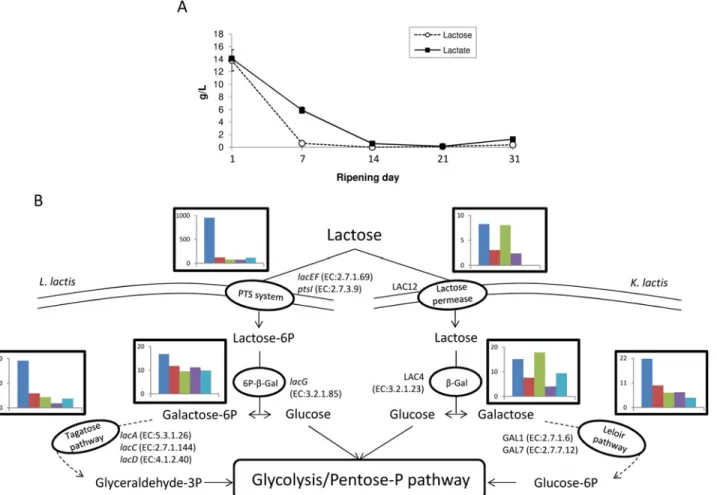
Lactose consumption. According toFig 2, carbohydrate metabolism was mainly detected in the early stage of ripening. Lactose is the major carbohydrate compound present in cheese curd and is rapidly consumed during the process (Fig 3A). We identified numerous expressed genes encoding enzymes involved in lactose uptake and degradation (Fig 3BandS3A Fig). For example, L. lactis genes encoding components of the lactose-specific phosphoenolpyruvate-dependent transport system (PTS), including lacEF (EC:2.7.1.69) and ptsI (EC:2.7.3.9), were highly expressed at day 1. The PTS system allows the concomitant translocation and phosphorylation of carbohy-drates in L. lactis. The detection of components from other carbohydrate-specific PTS systems such as celB (EC:2.7.1.69) and manXYZ (EC:2.7.1.69) might indicate a versatile use of these sys-tems for lactose uptake in this bacterium, as previously suggested by Aleksandrzak-Piekerczyk
[42]. Transcripts of the lacG gene encoding the 6P-β-Galactosidase (EC:3.2.1.85), as well as lacACD (EC:5.3.1.26; EC:2.7.1.144; EC:4.1.2.40) involved in Lactose-6-P degradation via the D-Tagatose-6-P pathway in L. lactis, were also detected, mainly during the early stages of ripening (days 1 to 7). The products from this pathway, i.e.,β-D-Glucose and Glyceraldehyde-3-P, then undergo glycolysis and/or the pentose phosphate pathway. Transcripts involved in these path-ways were also highly detected in L. lactis at the same time (S2BandS2CFig).
K. lactis is also able to metabolize lactose, but this yeast uses a slightly different pathway [43]. Lactose is imported through a specific lactose permease (encoded by the gene LAC12) and is then metabolized by aβ-Galactosidase (EC:3.2.1.23) encoded by LAC4 and enzymes involved in the Leloir pathway (EC:2.7.1.6; EC:2.7.7.12) and encoded by genes GAL1 and GAL7. The expres-sion of all genes from K. lactis involved in this pathway was also observed in our dataset, their detection being the most important during the early stage of ripening (days 1 to 14) (Fig 3B).
G. candidum does not consume lactose [44], whereas D. hansenii can efficiently catabolize this disaccharide [22]. Although our analysis indicated the detection of transcripts correspond-ing to the KEGG galactose pathway (PATH:ko00052) in these species (S3A Fig), this mainly corresponded to the detection of genes encoding enzymes not necessarily specific to this path-way, such as phosphoglucomutase (EC:5.4.2.2), 6-phosphofructokinase (EC:2.7.1.11) and hexokinase (EC:2.7.1.1). Indeed, these enzymes might instead reflect the detection of glycolysis
Fig 3. Lactose metabolism during surface-ripened cheese maturation. (A) Lactose and lactate concentrations. (B) Expression dynamics of lactose degradation pathways in Lactococcus lactis and Kluyveromyces lactis. Read numbers were normalized (according to the library size) to 50,000 reads per sampling day. For each degradation step, a histogram represents cumulative read numbers when several genes were involved.
(PATH:ko00010,S3B Fig) and the pentose phosphate pathway (PATH:ko00030,S3C Fig). Consequently, these species are not likely to significantly contribute to the lactose degradation in our model cheese.
Together, these results highlighted that in our experimental conditions, one of the key func-tions sustaining the cheese-ripening process, namely lactose biodegradation, involved the ac-tive participation of both L. lactis and K. lactis and revealed a functional redundancy existing for this metabolism within the studied ecosystem, as suggested from previous work [45].
Lactate metabolism. Lactate is of major importance in cheese making. It is produced from lactose present in milk by lactic acid bacteria (Fig 3A). Two lactate dehydrogenases transcripts of L. lactis, ldhA (EC:1.1.1.27) and dld (EC:1.1.2.4), were generally detected at day 1 (S2 Table), suggesting that L. lactis actively produces lactate at the early stage of ripening. Lactate exporter-(s), responsible for lactate extrusion from the intracellular environment in L. lactis, have not yet been characterized. Carvalo et al. [46] proposed llmg_2513 CDS from L. lactis MG1363 as a good candidate to encode a lactate transporter based on its predicted protein sequence topolo-gy that is similar to known lactate transporters from other species (such as LldP from E. coli, YqkI from B. subtilis and JEN1 from S. cerevisiae), but failed to confirm this activity using the mutagenesis approach. LLACS3_00055 from L. lactis S3, used as starter culture in our experi-ment, the only CDS presenting a strong homology with llmg_2513 (89% sequence identity at the nucleic level), was not detected in our metatranscriptome and, thus, would probably not be responsible for lactate export. Several gene transcripts encoding transporters in L. lactis were although detected, mostly at day 1, including MFS and ABC family transporters that could be good candidates to facilitate the movement of small solutes such as lactate across cell mem-branes. However, none of them could be identified as a potential lactate transporter on the basis of sequence similarity with known sequences from other organisms.
Lactate degradation by the cheese microflora, principally yeasts, is a key driver for curd de-acidification and occurred essentially during the two first weeks of ripening in our conditions (Fig 3A). Concomitantly, we detected reads for genes JEN1, encoding a lactate transporter, to-gether with DLD2 (EC:1.1.2.4), encoding a lactate dehydrogenase, in both D. hansenii and G. candidum (S2 Table). It should also be mentioned that G. candidum DLD1 transcripts encod-ing a D-lactate dehydrogenase (EC:1.1.2.4) and CYB2 encodencod-ing a L-lactate dehydrogenase (EC:1.2.2.3) were also detected, generally between day 7 and day 21. In Saccharomyces cerevi-siae [47,48] and D. hansenii—cultivated in a cheese-like medium [49]—the authors reported
that DLD1 and CYB2 were induced by lactate, making them good candidates for lactate degradation.
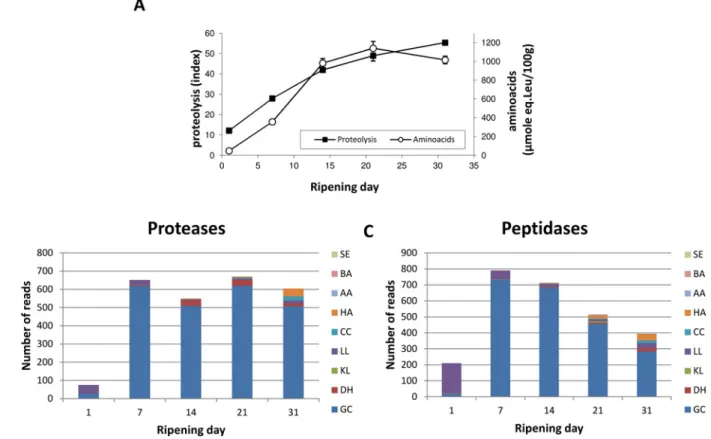
Protein and amino acid degradation. Proteins and, more precisely, caseins, are major car-bon and energy sources for microbial species living on cheese, together with lactose, lactate and lipids [6]. Proteolysis, which refers to the cleavage of caseins into small peptides and, ultimately, free amino acids by microbial proteases and peptidases, took place progressively and steadily in cheese, as attested to by the evolution of the proteolysis index and free amino acid concentra-tions (Fig 4A). Because a specific category for proteolysis does not exist in the KEGG database, we manually built two enzyme classes (Proteases and Peptidases) based on gene product anno-tations present in the reference genomes, and analyzed their expression profile during cheese ripening (Fig4Band4C). Normalized expression data for all these genes along with their anno-tation is given inS3 Table. These results suggested that G. candidum was the major contributor to proteolysis in this simplified surface-ripened cheese and supported other studies that indicat-ed that proteolysis mainly occurs during the first three weeks of soft cheese ripening [17,50].
In the genome of G. candidum, only one predicted CDS encoding a putative protease con-tains a signal sequence indicating a possible extracellular localization according to SignalP [51] and the PSORT server [52]. However, we didn’t detected any read mapping to this CDS in our
metatranscriptome. Similar genome analysis revealed that there is no extracellular protease en-coding genes predicted in the D. hansenii and K. lactis available genomes, but contrary to Y. lipolytica, another yeast commonly found at the surface of cheese. Furthermore, extracellular protease activity assay performed using the strains used for our experimental cheese produc-tion supported those predicproduc-tions (S4 Fig). Thus, we hypothesized that there were three possible non-exclusive ways for G. candidum to utilize caseins. First, it may directly uptake casein-de-rived peptides present in the extracellular environment, freed from the hydrolytic activities of both rennet used for milk coagulation [53] and L. lactis used as starter culture [54]. In our metatranscriptomic dataset, this was supported by the high number of reads observed for OPT2 and GAP1 genes of G. candidum (S2 Table), mainly between days 7 and 21, encoding an oligopeptide transporter and a general amino acid permease, respectively, which are known to contribute to the amino acid and protein uptake in yeasts [55,56]. Furthermore, several tran-scripts reflecting the proteolytic activity of L. lactis were detected earlier in the ripening kinet-ics, between days 1 to 7, namely pepA, pepDB, pepC, pepN, pepM, pepT, pepV and pepX encoding various peptidases (EC:3.4.11.7; EC:3.4.11.23; EC:3.4.22.40; EC:3.4.13.-; EC:3.4.11.2; EC:3.4.11.18; EC:3.4.11.4; EC:3.4.14.11) involved in the intracellular cleavage of small peptides into free amino acids [54] as well as genes optA, optC and optF encoding an oligopeptide ABC transporter system that has been shown to be responsible for casein-derived peptide transport for amino acid supply in L. lactis [57]. Second, G. candidum may internalize caseins to the vac-uole by endocytosis and degrade them using vacuolar proteases and peptidases. In agreement
Fig 4. Protein degradation during surface-ripened cheese maturation. (A) Proteolysis and free amino acid concentration. Expression data observed for genes encoding proteases (B) and peptidases (C). Read numbers were normalized (according to the library size) to 50,000 reads per sampling day. SE: Staphylococcus equorum. BA: Brevibacterium aurantiacum. AA: Arthrobacter arilaitensis. HA: Hafnia alvei. CC: Corynebacterium casei. LL: Lactococcus lactis. KL: Kluyveromyces lactis. DH: Debaryomyces hansenii. GC: Geotrichum candidum.
with this hypothesis, expression data revealed the important detection as of day 7, of several genes involved in endocytosis in G. candidum, among which the most frequently detected ones were EDE1 encoding an endocytic protein [58], SAC6 encoding fimbrin [59], ALY2 encoding an alpha arrestin [60], and PIL1 and LSP1 encoding primary components of eisosomes [61]. Among the most frequently transcribed genes encoding proteases and peptidases, CPS1 (EC:3.4.17.4), PRC1 (EC:3.4.16.5) and PEP4 (EC:3.4.23.25) encode enzymes known to be active in the vacuole [62]. The third possible way that casein can be used by G. candidum is the libera-tion of cellular proteases and peptidases in the extracellular environment during cell lysis, e.g., the highly expressed metalloendopeptidase encoded by the PRD1 gene. Although no data in our metatranscriptomic dataset enable us to support this hypothesis, this mechanism has al-ready been suggested for a cheese isolate of D. hansenii [63].
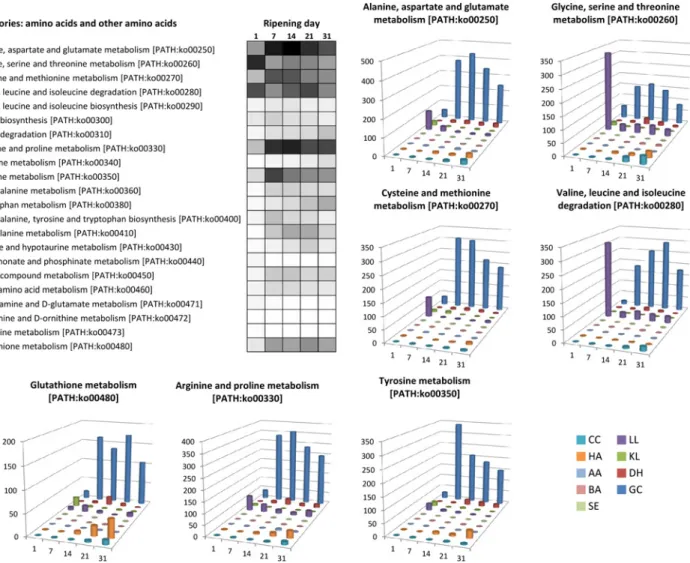
The next step following initial proteolysis is amino acid biodegradation, which is generally linked to the cheese matrix alkalinization and volatile compound production known to play an important role in aroma perception [5,6,64–66]. The most dominant amino acids composing caseins are glutamate, proline, leucine, lysine, aspartate, valine, serine, tyrosine and isoleucine. As shown inFig 5, among the complete list of amino acid metabolic pathways, those responsi-ble for the metabolism of these dominant amino acids are also the most detected in our meta-transcriptome. G. candidum accounted for the majority of the expression data observed regarding most amino acid metabolism. For example, genes involved in glutamate catabolism were highly detected in this organism. This included genes encoding the NAD-dependent glu-tamate dehydrogenase (GDH2, EC:1.4.1.2) and the NADP-dependent gluglu-tamate dehydroge-nase (GDH3, EC:1.4.1.4) responsible for the deamination of this amino acid to generate 2-oxoglutarate, which is then supplied to the TCA cycle, as well as genes encoding the gluta-mate decarboxylase (GAD1, EC:4.1.1.15), degrading glutagluta-mate into 4-aminobutyrate (GABA), which is then converted into succinate by the enzymes 4-aminobutyrate aminotransferase (EC:2.6.1.19) and NAD(P)-dependent succinate semialdehyde dehydrogenase (EC:1.2.1.79), encoded by genes UGA1 and UGA2, respectively, which also feed the TCA cycle. GDH2 induc-tion has already been observed in G. candidum by RT-qPCR in Reblochon-type cheese (a French surface-ripened cheese) at the end of ripening, and this gene was proposed as a bio-marker for amino acid catabolism [67]. However, G. candidum was not the only microorgan-ism responsible for amino acid catabolmicroorgan-ism in our experimental surface-ripened cheeses. Transcripts involved in glycine, serine and threonine metabolism (PATH:ko00260) as well as the valine, leucine and isoleuline degradation pathway (PATH:ko00280) were also highly de-tected in L. lactis at day 1.
Lipid metabolism. Lipolysis refers to the hydrolysis of triglycerides and results in the lib-eration of free fatty acids (FFAs) that are important precursors of catabolic reactions that pro-duce volatile compounds that contribute to cheese quality and flavor [4,66,68]. In our
metatranscriptomic data, we observed that lipid metabolism pathway expression approximate-ly followed the same dynamics as amino acid metabolism, i.e., a strong increase from day 1 to day 7 followed by a global stability or a slow decrease during the next three weeks (Fig 2). This is in agreement with the dynamics observed by Lessard et al. [17] on a Camembert-type cheese. Furthermore, in our study, the lipolysis index steadily increased along the ripening process, which indicates a regular lipolysis of the food matrix (S5 Fig). G. candidum once again ac-counted for the most highly expressed genes detected for this metabolism and is likely to be the major contributor to cheese lipolysis in our conditions. However, we also detected two genes encoding putative esterases from L. lactis (locus tag: LLACS3_11125 and LLACS3_11440), mostly at day 1, which may contribute to the initial lipolysis. Indeed, it has been demonstrated that esterases produced by lactic acid bacteria could degrade milk fat into FFAs in hard cheese [69]. Subsequently, few lipase (EC:3.1.1.3) or esterase (EC:3.1.1.13) encoding genes from G.
candidum (i.e., ATG15, TGL1, ROG1) were detected, and their expression level increased along with the ripening time. We also detected several transcripts involved in free fatty acid im-port including FAA1, FAA2 and FAA4 encoding long-chain fatty acyl-CoA synthetases (EC:6.2.1.3) and PXA1 (synonym: PAT2) and PXA2 (synonym PAT1) encoding peroxisomal fatty acyl-CoA ABC transporters. Furthermore, genes involved in the peroxisomal version of theβ-oxidation pathway, namely POX1 (EC:1.3.3.6), CTA1 (EC:1.11.1.6), FOX2
(EC:4.2.1.119), ECI1 (EC:5.3.3.8), SPS19 (EC:1.3.1.34) and POT1 (EC:2.3.1.16), were highly de-tected from day 7 to day 31.
Identification of possible biomarkers of the cheese-ripening process by
differential expression analysis
In situ gene expression measurement is considered as a promising tool for improving our un-derstanding of the microflora activity in cheese and for monitoring the ripening process. In-deed, considerable efforts have been made over the last few years to develop consistent and
Fig 5. Gene expression related to amino acid metabolism. For each pathway, the heatmap represents the expression dynamics over time (cumulative number of normalized reads per pathway) using a gray scale bar from 0 read in white to 500 reads in black. For seven pathways, histogram charts detail this dynamic per microbial species. CC: Corynebacterium casei, HA: Hafnia alvei, AA: Arthrobacter arilaitensis, BA: Brevibacterium aurantiacum, SE:
Staphylococcus equorum, LL: Lactococcus lactis, KL: Kluyveromyces lactis, DH: Debaryomyces hansenii, GC: Geotrichum candidum. doi:10.1371/journal.pone.0124360.g005
repeatable methods for in situ quantification of mRNA transcripts based on RT-qPCR tech-niques. Several examples in the context of cheese ripening are now available in the literature [67,70–73]. However, such studies enable the transcription monitoring of a limited number of genes (generally up to one hundred) and, thus, rely on the previous selection of appropriate biomarkers relevant to the targeted functions.
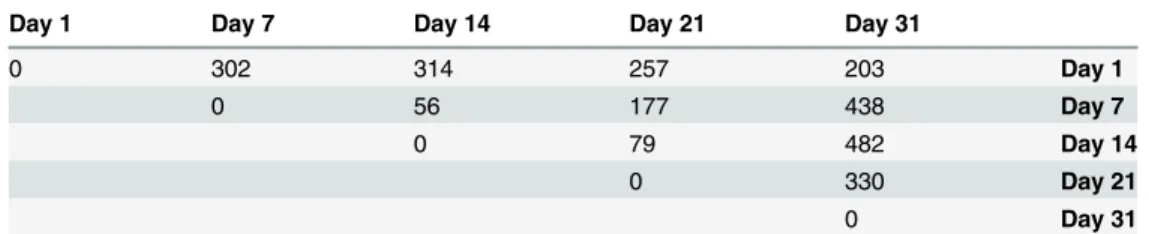
In the following section, we used our metatranscriptomic dataset to select and propose a set of biomarker genes that cover diverse metabolisms relevant in the cheese-ripening process. To do this, we performed differential expression analysis using the DESeq 2 package [31] and first compared the number of differentially expressed genes between each ripening time (Table 3). Based on this result, we decided to separate the ripening kinetics into two phases, the early and late stage of ripening corresponding to day 1 to day 14 (D1 vs. D14) and day 14 to day 31 (D14 vs. D31), respectively, for which differentially expressed genes were observed. The complete lists of gene transcripts showing a differential abundance in these two comparisons, along with their actual adjusted p-values, are available inS4–S5Tables, respectively. We then manually se-lected 70 genes from among this list with a high number of reads and related to a biological and/or technological function according to the genome annotations. For the most prominent microorganisms, selected genes are reported inTable 4and classified into categories that might be relevant for the monitoring of cheese ripening.
Brief description of differentially expressed genes between D1 and D14. On the basis of the comparative analysis of D1 vs. D14, two genes related to glycolysis, encoding glyceralde-hyde-3-phosphate dehydrogenase (EC:1.2.1.12) and enolase (EC:4.2.1.11), could be proposed as common biomarkers of microbial species activity at the early stage of the ripening process. Interestingly, they were more abundant at D1 in K. lactis and L. lactis, in agreement with an in-tense development and metabolic activity for these facultative anaerobic microorganisms dur-ing the first days of ripendur-ing. As mentioned above, both species are involved in lactose degradation within the cheese matrix. This was exactly the opposite for the cheese-surface aer-obic yeasts G. candidum and D. hansenii for which both genes were more expressed at D14. Mitochondrial genes of yeasts related to the respiration chain, e.g., COB and COX, followed the same variation pattern.
Regarding G. candidum, genes involved in protein degradation (e.g., PRD1, PEP4) and in glutamate—the most abundant amino acid—degradation (e.g., GDH2) were more frequently detected at D14 when compared to D1 and could thus be proposed as biomarkers for proteolyt-ic activity and amino acid catabolism. GUT1 encoding glycerol kinase (EC:2.7.1.30) involved in lipid metabolism followed the same trend and could be used as a biomarker for lipolysis.
A striking feature of L. lactis is the occurrence of several stress-related genes (e.g., sodA, dnaK, clpB) with high expression levels at D1 (S4 Table). This might be related to several possi-ble stresses such as the shift from anaerobic (lactic acid production during the milk acidifica-tion and coagulaacidifica-tion phase) to aerobic condiacidifica-tions during the ripening process, the osmotic pressure induced by salting or variations in the pH. Indeed, transcriptomic analysis of L. lactis
Table 3. Number of differentially expressed genes according to ripening time.
Day 1 Day 7 Day 14 Day 21 Day 31
0 302 314 257 203 Day 1 0 56 177 438 Day 7 0 79 482 Day 14 0 330 Day 21 0 Day 31 doi:10.1371/journal.pone.0124360.t003
Table 4. S election of genes show ing a differential abunda nce be twee n Day 1 a n d Day 14 and/or Day 14 and Da y 31. Locus tag (gene ) Produ ct (EC num ber) Sepc ies Log2 fol d c h ange Day 14 vs. Day 1 (me an) Log2 fold cha nge Day 31 vs. Day 14 (me an) Centr al Met abolism DEHA2G 14058 g (EN O1) Enolas e I (EC :4.2.1.1 1) D .hanse nii 3. 20 (22.81 ) -2.36 (21.0 1) DEHA2G 18348 g (PD C1) Pyruvate dec arboxyl ase (EC:4.1 .1.1) D .hanse nii 2. 43 (46.35 ) -DEHA2F0479 6g (TDH3 ) Glycer aldehy de-3 -phosph ate dehyd rogen ase (EC:1 .2.1.12 ) D .hanse nii 2. 03 (88.25 ) -DEHA2E1 3530g (MLS1 ) Malate syntha se (EC :2.3.3 .9) D .hanse nii -1.2 7 (69.92) GECA 22s00 351g (TD H3) Glycer aldehy de-3 -phosph ate dehyd rogen ase (EC:1 .2.1.12 ) G .candidu m 3. 51 (126.7 1) -GECA 17s02 408g (EN O2) Enolas e II (EC :4.2.1.1 1) G .candidu m 3. 72 (167.6 8) -GECA 06s01 693g (MD H1) Malate dehyd rogen ase (EC :1.1 .1.37) G .candidu m 4. 03 (71.02 ) -2.25 (69.1 3) GECA 06s04 762g (PYC2) Pyruvate car boxylas e 2 (EC:6 .4.1.1) G .candidu m 3. 24 (200.6 3) -1.97 (193 .23) GECA 20s01 396g (AD H3) Alcoho l dehyd rogena se 3 (EC :1.1.1 .1) G .candidu m --1.66 (176 .65) KLLA0A0 9185g (EN O1) ENO1 Enola se I (EC:4.2 .1.11 ) K .lactis -6.62 (96 .53) -KLLA0A1 1011g (PGK1 ) Phosp hoglycer ate kina se (EC :2.7.2 .3) K .lactis -5.58 (11 9.43) -KLLA0A1 1858g (TDH2 ) Glycer aldehy de 3-ph ospha te deh ydrogena se (EC:1 .2.1.12 ) K .lactis -4.68 (18 4.66) -KLLA0E0 7569g (FBA1) Fructo se 1 6-bisph ospha te aldo lase (EC:4 .1.2.13 ) K .lactis -2.79 (97 .16) -KLLA0E1 6303g (PD C1) Pyruvate dec arboxyl ase (EC:4.1 .1.1) K .lactis -3.38 (16 3.45) -KLLA0F 2098 8g (GAP1 ) Glycer aldehy de-3 -phosph ate dehyd rogen ase (EC:1 .2.1.12 ) K .lactis -2.47 (80 .16) -3.41 (11.8 7) KLLA0F 2339 7g (PYK1) Pyruvate kina se (EC :2.7.1 .40) K .lactis -3.85 (50 .88) -LLACS 3_0309 5 (gap) Glycer aldehy de-3 -phosph ate dehyd rogen ase (EC:1 .2.1.12 ) L .lactis -5.00 (51 85.82) -LLACS 3_0172 5 (gap) Glycer aldehy de-3 -phosph ate dehyd rogen ase (EC:1 .2.1.12 ) L .lactis -5.80 (53 02.58) -LLACS 3_0976 0 (eno) Enolas e (EC:4 .2.1.11 ) L .lactis -6.13 (44 9.67) -LLACS 3_0229 5 (adhE) Aldehy de-al cohol dehy droge nase (EC :1.1.1.1 ; EC:1.2.1 .10) L .lactis -3.44 (79 .61) -LLACS 3_0418 5 (gnd) Phosp hogluc onate dehyd rogen ase (EC :1.1 .1.44) L .lactis -4.87 (33 3.29) -LLACS 3_0655 0 (deoB) Phosp hopento mutase (EC :5.4.2.7 ) L .lactis -5.76 (49 1.42) -CCAS_0 1315 (py c) Pyruvate car boxylas e (EC :6.4.1.1 ) C .casei -4.4 1 (24.97) CCAS_0 5260 2-methy lcitrate dehyd ratas e (EC :4.2 .1.79) C .casei -4.9 6 (118.78 ) HALV_ 03660 (adhE ) Aldehy de-al cohol dehy droge nase (EC :1.1.1.1 ; EC:1.2.1 .10) H .al vei -3.3 5 (36.21) HALV_ 13325 (fba) Fructo se-bisp hosph ate aldola se class II (EC :4.1 .2.13) H .al vei -3.5 6 (73.94) Carbo hydrat e uptake LLACS 3_0146 0 (manX) PTS system mannos e-spec ifi c EIIAB compo nent (EC:2 .7.1.69 ) L .lactis -4.54 (72 .28) -LLACS 3_0146 5 (manY) PTS system mannos e-spec ifi c EIIC com ponent L .lactis -4.51 (74 .66) -LLACS 3_1190 5 (lacE) PTS system lactos e-spec ifi c IIBC comp onent (EC:2 .7.1.69 ) L .lactis -3.43 (16 9.59) -(Co ntinued )
Table 4. (Co ntinued ) Locus tag (gene ) Produ ct (EC num ber) Sepc ies Log2 fol d c h ange Day 14 vs. Day 1 (me an) Log2 fold cha nge Day 31 vs. Day 14 (me an) LLACS 3_1193 0 (lacA) Galac tose-6-pho sphate isome rase sub unit lacA (EC:5 .3.1.26 ) L .lactis -3.64 (18 9.96) -LLACS 3_0771 5 (ptsI) Phosp hoenol pyruvate prote in phosp hotran sferase (EC:2 .7.3.9) L .lactis -4.95 (26 56.44) -LLACS 3_0772 0 (ptsH) Phosp hocarri er prote in HPr (EC:2 .7.11 .-) L .lactis -6.80 (21 26.77) -Protein de gradation GECA 06s04 927g (PR D1) Zinc m etalloen dopepti dase G .candidu m 6. 59 (191.1 7) -2.65 (186 .53) GECA 01s02 760g (PEP 4) Vacuo lar asp artyl protea se (pr oteinas e A ) (EC:3 .4.23.2 5) G .candidu m 4. 26 (118.8 6) 1.0 2 (293.28 ) GECA 10s04 102g (CP S1) Vacuo lar car boxypep tidase yscS (EC :3.4.17 .4) G .candidu m --1.58 (62.0 4) GECA 01s04 322g (O PT2) Oligop eptide trans porter G .candidu m --4.46 (129 .07) LLACS 3_0221 5 (ftsH) ATP-dep endent zinc me tallopr otease (EC :3.4.2 4.-) L .lactis -3.55 (91 .99) -CCAS_1 3715 Xaa-Pro dipepti dase (EC:3 .4.13.9 ) C .casei -2.9 6 (18.35) HALV_ 05100 (h flB ) ATP-dep endent meta llopepti dase (EC:3 .4.24 .-) H .al vei -2.9 7 (16.07) HALV_ 13275 (pepP ) Prolin e-spec ifi c aminope ptidas e (EC :3.4 .11.5) H .al vei -4.9 7 (11.34) Amino aci d d e gradation GECA 04s04 949g (AAT2 ) Cytosol ic aspa rtate am inotra nsfera se (EC :2.6.1 .1) G .candidu m 6. 10 (76.20 ) 2.1 8 (349.16 ) GECA 22s00 494g (CA R2) L-ornithi ne trans aminas e (OTAs e) (EC :2.6.1.1 3) G .candidu m --2.37 (99.2 0) GECA 03s01 374g (G AP1) Gener al amino acid perme ase G .candidu m --3.74 (113 .88) GECA 04s00 373g (PPZ2 ) Serine /threoni ne protei n phos phatas e Z (EC :3.1 .3.16) G .candidu m -3.6 1 (481.29 ) GECA 05s04 498g (DU R1) Urea am idoly ase (EC:6.3 .4.6; EC:3.5.1.54) G .candidu m -2.2 0 (116.57 ) GECA 20s00 296g (LA P3) Cystein e aminope ptidas e (EC :3.4 .22.40 ) G .candidu m --4.12 (62.5 9) GECA 06s00 802g (G DH2) NAD(+) -depe ndent gluta mate dehy droge nase (EC:1 .4.1.2) G .candidu m 5. 17 (350.9 8) -GECA 09s02 639g (CY S3) Cystathi onine gamm a-lyas e (EC:4.4 .1.1) G .candidu m 3. 11 (47.57 ) -HALV_ 00935 (tdcC) Threon ine/serin e tran sporte r H .al vei -4.4 5 (52.07) HALV_ 13395 (speA ) Argini ne decarbo xylase (EC :4.1.1 .19) H .al vei -3.3 5 (14.06) Sulfur metabolism GECA 07s04 267g Putati ve sulfa te per mease G .candidu m -1.6 4 (253.70 ) GECA 18s00 835g (ME T6) Coba lamin-indepen dent me thionin e s y nthase (EC:2 .1.1.14 ) G .candidu m -2.4 4 (255.35 ) Respir ation an d iron transp ort DEHA_mCDS 7140 (COB ) Apocyt ochrome b D .hanse nii 2. 96 (99.64 ) -DEHA_mCDS 20585 (COX1) Cytochr om e c oxida se subu nit 1 (EC:1.9 .3.1) D .hanse nii 2. 52 (359.2 6) 1.1 1 (818.11 ) GECA _mCDS1 5388 (COB) Apocyt ochrome b G .candidu m 2. 39 (598.7 5) -0.90 (659 .71) GECA _mCDS2 4166 (COX1) Cytochr om e c oxida se subu nit 1 (EC:1.9 .3.1) G .candidu m 2. 77 (841.1 8) -GECA 05s03 805g (FET 3) Ferro -O2-ox idored uctas e G .candidu m 7. 16 (67.98 ) -6.71 (58.2 1) GECA 12s01 770g (SIT 1) Ferrioxamin e B trans porter G .candidu m 6. 14 (112.9 6) -4.92 (97.9 2) (Co ntinued )
Table 4. (Co ntinued ) Locus tag (gene ) Produ ct (EC num ber) Sepc ies Log2 fol d c h ange Day 14 vs. Day 1 (me an) Log2 fold cha nge Day 31 vs. Day 14 (me an) GECA 26s00 230g (FT R1) High af finity iron per mease G .candidu m --1.21 (89.0 6) KLLA_mC DS2 0667 (COB) Apocyt ochrome b K .lactis -4.74 (43 1.07) -KLLA_mC DS2 7490 (COX1) Cytochr om e c oxida se subu nit 1 (EC:1.9 .3.1) K .lactis -4.72 (81 3.44) -CCAS_1 2555 Iron-sid eroph ore A B C trans porter C .casei -5.9 9 (53.33) Stress respon se LLACS 3_0667 5 (dnaK) Chap erone prote in DnaK L .lactis -5.94 (10 536.90) 1.2 2 (475.75 ) LLACS 3_0863 5 (clpB) Chap erone prote in ClpB L .lactis -5.89 (15 396.23) -LLACS 3_0065 0 (sodA ) Supero xide dismu tase (EC :1.1 5.1.1) L .lactis -6.40 (60 02.79) -CCAS_0 1895 Catala se (EC :1.11 .1.6) C .casei -4.9 1 (47.50) GECA 07s02 177g (RIM1 01) Trans criptiona l rep ressor invo lved in respons e to p H G .candidu m -1.4 1 (221.55 ) Lipid met abolism GECA 13s03 354g (G UT1) Glycer ol kinase (EC :2.7.1.3 0) G .candidu m 2. 49 (147.0 8) -2.09 (131 .76) Endocyt osis GECA 06s02 496g (AL Y2) Alpha arrestin , endoc ytos is G .candidu m -1.3 0 (82.97) Hyphal gro wth GECA 07s00 142g (MIT 1) Trans criptiona l reg ulator of ps eudohy phal growth G .candidu m -2.1 7 (82.88) The log2 fold chan ge and th e ave rage number of read s (mean ) are indica ted only if th e gene rev ealed a signi fican t diffe rence betwee n the two ripe ning ti mes (ad justed p-value < 0.05). doi:10.1371/journal.p one.0124360.t004
has already revealed that sodA gene overexpression is associated with oxidative stress response during milk fermentation [74], and that genes encoding chaperones induction reflects the growth arrest of L. lactis in cheese observed almost 24h post-inoculation [75]. In our study, model cheeses were analyzed as a whole, thus including both surface and core parts. However, local conditions might have a great influence on physiochemical stresses encountered by L. lac-tis and thus should be taken into account for data interpretation.
Brief description of differentially expressed genes between D14 and D31. The compara-tive analysis of D14 vs. D31 revealed a shift of the metabolism of G. candidum towards peptide (OPT2, PRD1, LAP3, CPS1) and amino acid (GAP1, AAT2, CAR2) catabolism/transport com-pared to D1/D14. Another interesting feature is the detection of genes related to iron capture and/or transport, higher in D14 compared to D31 for G. candidum (SIT1, FET3, FTR1), but lower in C. casei (iron-siderophore ABC transporter). This indicated that iron capture is crucial for microbial species living on the cheese surface, as demonstrated by Monnet et al. [26]. In C. casei, we observed the highest abundance at D31 of CCAS_05260 encoding a 2-methylcitrate dehydratase (EC:4.2.1.79), an important enzyme involved in the methylcitrate pathway. In H. alvei, gene transcripts involved in peptide/amino acid transport (meoA, tdcC) and degradation (speA, pepP, hlfB) were also more abundant at D31, revealing the catabolic activity of this spe-cies at the end of ripening. Finally, two transcripts involved in sulfur metabolism, encoding a putative sulfate permease (GECA07s04267g) and a methionine synthase (MET6), were more highly detected at D31 in G. candidum. They could be involved in sulfur metabolism through sulfur recycling from various sulfur compounds, including volatile ones, which are released in great quantity at the surface of ripened cheeses [7].
Conclusion
In this study, we used a combination of microbiological, biochemical, metagenomic and meta-transcriptomic methods to obtain a detailed picture of an experimental surface-ripened cheese ecosystem that functions during the ripening process. Overall, we were able to reveal the major contribution of the most dominant microbial species (e.g. L. lactis, K. lactis, G. candidum, D. han-senii and C. casei) and possible interactions regarding key functions involved in the dairy matrix degradation. L. lactis and K. lactis activities during the early stage of ripening enabled the rapid consumption of lactose. Lactate, produced from lactose by L. lactis, was then rapidly consumed by D. hansenii and G. candidum for which we detected high levels of lactate dehydrogenase tran-scripts. Regarding protein and lipid metabolism, the great majority of RNA-Seq reads mapped G. candidum genes, which suggested a strong influence of this species on casein and fat degradation. At the end of ripening, our dataset indicated the expression of amino acid degradation-related genes by G. candidum and acid-sensitive bacteria such as C. casei and H. alvei, which were linked to their late development at the cheese surface. We demonstrated that global gene expression data collected at the ecosystem scale were in good accordance with the observed phenomena (e.g., bio-chemical and microbiological data) and provided the unique opportunity to simultaneously ad-dress questions related to different metabolisms and involving several individual species.
Furthermore, statistical methods based on differential expression analysis made it possible to select a short list of potential biomarkers. This valuable tool might be particularly useful for more precise and in-depth studies aiming at understanding and/or simply following the contri-bution of different strains or species in the ripening process, sustaining the production of dif-ferent surface-ripened cheeses.
Altogether, metatranscriptomic analysis revealed the proportion of the genes that are actual-ly expressed within a food microbial community composed of both eukaryotes and prokary-otes. When combined with biochemical data, it may also indicate the microbial populations
that are metabolically active and how they respond to a perturbation. Thus, it may be applied to detect near-instantaneous responses to environmental perturbations (e.g. biotic and abiotic constraints) which could occur during the ripening process and other related food fermenta-tion processes. Currently, the main limitafermenta-tion of this approach remains the difficulty to detect low-abundant species which could also contribute to the matrix transformation. The combina-tion of both using efficient rRNA deplecombina-tion methods and increasing the sequencing depth might enable to partly overcome this limitation.
Supporting Information
S1 Fig. Metabolic pathways detected in the metatranscriptomic dataset.Genes exhibiting an average of> 5 normalized reads were mapped in black onto KEGG general metabolic pathways (ko01100). E: complete ecosystem. LL: Lactococcus lactis. KL: Kluyveromyces lactis. GC: Geotri-chum candidum. DH: Debaryomyces hansenii. CC: Corynebacterium casei. HA: Hafnia alvei. (TIF)
S2 Fig. Expression profile of the oxidative phosphorylation pathway during surface-rip-ened cheese maturation.Histogram charts represent the cumulative number of normalized reads per sampling day and per microbial species. CC: Corynebacterium casei, HA: Hafnia alvei, AA: Arthrobacter arilaitensis, BA: Brevibacterium aurantiacum, SE: Staphylococcus equorum, LL: Lactococcus lactis, KL: Kluyveromyces lactis, DH: Debaryomyces hansenii, GC: Geotrichum candidum.
(TIF)
S3 Fig. Expression profile of carbohydrate metabolic pathways.Histogram charts represent the expression dynamics (cumulative number of normalized reads per sampling day and per microbial species) of the galactose metabolism (A), glycolysis-gluconeogenesis pathway (B) and pentose phosphate pathway (C). CC: Corynebacterium casei, HA: Hafnia alvei, AA: Arthrobac-ter arilaitensis, BA: BrevibacArthrobac-terium aurantiacum, SE: Staphylococcus equorum, LL: Lactococcus lactis, KL: Kluyveromyces lactis, DH: Debaryomyces hansenii, GC: Geotrichum candidum. (TIF)
S4 Fig. Extracellular protease assay.Yarrowia lipoltica 1E07 (Yl), Kluyveromyces lactis 3550 (Kl), Debaryomyces hansenii 304 (Dh) and Geotrichum candidum ATCC 204307 (Gc) were spotted on protease assay medium (0.67% yeast nitrogen base without ammonium sulfate and amino acids (Difco Laboratories), 0.1% glucose, 50 mM phosphate buffer, pH 6.8, 2% skim milk (Difco Laboratories)), and incubated 6 days at 18°C. Clarification zone around the colony indicated extracellular protease activity.
(TIF)
S5 Fig. Lipolysis index measurement during surface-ripened cheese maturation. (TIF)
S1 Table. Metagenome and metatranscriptome statistics. (XLSX)
S2 Table. Expression data for all CDSs detected in the metatranscriptome (read numbers were normalized to 50,000 reads per sampling day).
(XLSX)
S3 Table. Expression data for CDSs encoding peptidases and proteases (read numbers were normalized to 50,000 reads per sampling day).
S4 Table. Gene transcripts showing a differential abundance between Day 1 and Day 14. (XLSX)
S5 Table. Gene transcripts showing a differential abundance between Day 14 and Day 31. (XLSX)
S1 File. Supplementary methods: experimental surface ripened-cheese production. (DOC)
Acknowledgments
We thank Serge Casaregola and Guillaume Morel (INRA, UMR1319 Micalis, Thiverval-Grignon, France) for providing the genome of G. candidum ATCC 204307, and Anne Sophie Sarthou and Jessie Castellote (INRA, UMR782 GMPA, Thiverval-Grignon, France) for techni-cal assistance. We are grateful to our undergraduate bioinformatics students Maxime Ferrier, Roxane Boyer and Joeffrey Boggio (IUT Génie Biologique option bioinfomatique, Aurillac, France) for the development of scripts for functional classification, and Nicolas Parisot (Uni-versité d’Auvergne, Clermont-Ferrand, France) for supervising their work.
Author Contributions
Conceived and designed the experiments: P. Bonnarme JMB CM FI DS. Performed the experi-ments: CS CM FI SL SK DO MNLP SF. Analyzed the data: EDB CS P. Bento VL NP AT JA FF EG. Contributed reagents/materials/analysis tools: P. Bonnarme JMB JFG. Wrote the paper: EDB CS P. Bonnarme JMB DS.
References
1. Montel MC, Buchin S, Mallet A, Delbes-Paus C, Vuitton DA, Desmasures N, et al. Traditional cheeses: Rich and diverse microbiota with associated benefits. Int J Food Microbiol. 2014; 177: 136–154. doi:
10.1016/j.ijfoodmicro.2014.02.019PMID:24642348
2. Irlinger F, Mounier J. Microbial interactions in cheese: implications for cheese quality and safety. Curr Opin Biotechnol. 2009; 20: 142–148. doi:10.1016/j.copbio.2009.02.016PMID:19342218
3. Sousa MJ, Ardö Y, McSweeney PLH. Advances in the study of proteolysis during cheese ripening. Int Dairy J. 2001; 11: 327–345.
4. Collins YF, McSweeney PLH, Wilkinson MG. Lipolysis and free fatty acid catabolism in cheese: a re-view of current knowledge. Int Dairy J. 2003; 13: 841–866. doi:10.1016/S0958-6946(03)00109-2
5. Yvon M, Rijnen L. Cheese flavour formation by amino acid catabolism. Int Dairy J. 2001; 11: 185–201. 6. Marilley L. Flavours of cheese products: metabolic pathways, analytical tools and identification of
pro-ducing strains. Int J Food Microbiol. 2004; 90: 139–159. doi:10.1016/S0168-1605(03)00304-0PMID:
14698096
7. Landaud S, Helinck S, Bonnarme P. Formation of volatile sulfur compounds and metabolism of methio-nine and other sulfur compounds in fermented food. Appl Microbiol Biotechnol. 2008; 77: 1191–1205. doi:10.1007/s00253-007-1288-yPMID:18064452
8. Van Hijum SA, Vaughan EE, Vogel RF. Application of state-of-art sequencing technologies to indige-nous food fermentations. Curr Opin Biotechnol. 2013; 24: 178–186. doi:10.1016/j.copbio.2012.08.004
PMID:22960050
9. Ercolini D. High-Throughput Sequencing and Metagenomics: Moving Forward in the Culture-Indepen-dent Analysis of Food Microbial Ecology. Appl Environ Microbiol. 2013; 79: 3148–3155. doi:10.1128/ AEM.00256-13PMID:23475615
10. Quigley L, O’Sullivan O, Beresford TP, Ross RP, Fitzgerald GF, Cotter PD. High-Throughput Sequenc-ing for Detection of Subpopulations of Bacteria Not Previously Associated with Artisanal Cheeses. Appl Environ Microbiol. 2012; 78: 5717–5723. doi:10.1128/AEM.00918-12PMID:22685131
11. Bokulich NA, Mills DA. Facility-Specific“House” Microbiome Drives Microbial Landscapes of Artisan Cheesemaking Plants. Appl Environ Microbiol. 2013; 79: 5214–5223. doi:10.1128/AEM.00934-13
12. Wolfe BE, Button JE, Santarelli M, Dutton RJ. Cheese Rind Communities Provide Tractable Systems for In Situ and In Vitro Studies of Microbial Diversity. Cell. 2014; 158: 422–433. doi:10.1016/j.cell.2014. 05.041PMID:25036636
13. Delcenserie V, Taminiau B, Delhalle L, Nezer C, Doyen P, Crevecoeur S, et al. Microbiota characteriza-tion of a Belgian protected designacharacteriza-tion of origin cheese, Herve cheese, using metagenomic analysis. J Dairy Sci. 2014; 97: 6046–6056. doi:10.3168/jds.2014-8225PMID:25064656
14. Dujon B, Sherman D, Fischer G, Durrens P, Casaregola S, Lafontaine I, et al. Genome evolution in yeasts. Nature. 2004; 430: 35–44. PMID:15229592
15. Cheeseman K, Ropars J, Renault P, Dupont J, Gouzy J, Branca A, et al. Multiple recent horizontal transfers of a large genomic region in cheese making fungi. Nat Commun. 2014; 5. doi:10.1038/ ncomms3876
16. Almeida M, Hébert A, Abraham AL, Rasmussen S, Monnet C, Pons N, et al. Construction of a dairy mi-crobial genome catalog opens new perspectives for the metagenomic analysis of dairy fermented prod-ucts. BMC Genomics. 2014; 15: 1101. doi:10.1186/1471-2164-15-1101PMID:25496341
17. Lessard MH, Viel C, Boyle B, St-Gelais D, Labrie S. Metatranscriptome analysis of fungal strains Peni-cillium camemberti and Geotrichum candidum reveal cheese matrix breakdown and potential develop-ment of sensory properties of ripened Camembert-type cheese. BMC Genomics. 2014; 15: 235. doi:
10.1186/1471-2164-15-235PMID:24670012
18. Bonaïti C, Irlinger F, Spinnler HE, Engel E. An Iterative Sensory Procedure to Select Odor-Active Asso-ciations in Complex Consortia of Microorganisms: Application to the Construction of a Cheese Model. J Dairy Sci. 2005; 88: 1671–1684. doi:10.3168/jds.S0022-0302(05)72839-3PMID:15829658
19. Mounier J, Monnet C, Vallaeys T, Arditi R, Sarthou AS, Helias A, et al. Microbial Interactions within a Cheese Microbial Community. Appl Environ Microbiol. 2008; 74: 172–181. doi:10.1128/AEM.01338-07
PMID:17981942
20. Leclercq-Perlat MN, Oumer A, Bergere JL, Spinnler HE, Corrieu G. Growth of Debaryomyces hansenii on a bacterial surface-ripened soft cheese. J Dairy Res. 1999; 66: 271–281. null
21. Doi E, Shibata D, Matoba T. Modified colorimetric ninhydrin methods for peptidase assay. Anal Bio-chem. 1981; 118: 173–184. doi:10.1016/0003-2697(81)90175-5PMID:7039409
22. Leclercq-Perlat MN, Oumer A, Buono F, Bergere JL, Spinnler HE, Corrieu G. Behavior of Brevibacter-ium linens and Debaryomyces hansenii as ripening flora in controlled production of soft smear cheese from reconstituted milk: protein degradation. J Dairy Sci. 2000; 83: 1674–1683. doi:10.3168/jds. S0022-0302(00)75036-3PMID:10984142
23. Mouillet L, Luquet FM, Nicod H, Boudier JF, Mahieu H. La lipolyse des laits. Etude d’une méthode rapide de mesure. Le Lait. 1981; 61: 171–186.
24. Baruzzi F, Matarante A, Caputo L, Morea M. Development of a Culture-Independent Polymerase Chain Reaction-Based Assay for the Detection of Lactobacilli in Stretched Cheese. J Rapid Methods Autom Microbiol. 2005; 13: 177–192. doi:10.1111/j.1745-4581.2005.00018.x
25. Leclercq-Perlat MN, Picque D, Martin del Campo Barba ST, Monnet C. Dynamics of Penicillium camemberti growth quantified by real-time PCR on Camembert-type cheeses under different conditions of temperature and relative humidity. J Dairy Sci. 2013; 96: 4031–4040. doi:10.3168/jds.2012-6372
PMID:23587382
26. Monnet C, Back A, Irlinger F. Growth of Aerobic Ripening Bacteria at the Cheese Surface Is Limited by the Availability of Iron. Appl Environ Microbiol. 2012; 78: 3185–3192. doi:10.1128/AEM.00085-12
PMID:22367081
27. Langmead B, Trapnell C, Pop M, Salzberg SL. Ultrafast and memory-efficient alignment of short DNA sequences to the human genome. Genome Biol. 2009; 10: R25. doi:10.1186/gb-2009-10-3-r25PMID:
19261174
28. Cotillard A, Kennedy SP, Kong LC, Prifti E, Pons N, Le Chatelier E, et al. Dietary intervention impact on gut microbial gene richness. Nature. 2013; 500: 585–588. doi:10.1038/nature12480PMID:23985875
29. Lander ES, Waterman MS. Genomic mapping by fingerprinting random clones: A mathematical analy-sis. Genomics. 1988; 2: 231–239. doi:10.1016/0888-7543(88)90007-9PMID:3294162
30. Kanehisa M, Goto S, Sato Y, Furumichi M, Tanabe M. KEGG for integration and interpretation of large-scale molecular data sets. Nucleic Acids Res. 2012; 40: D109–D114. doi:10.1093/nar/gkr988PMID:
22080510
31. Love MI, Huber W, Anders S. Moderated estimation of fold change and dispersion for RNA-seq data with DESeq2. bioRxiv. 2014; 002832. doi:10.1101/002832
32. Gentleman RC, Carey VJ, Bates DM, Bolstad B, Dettling M, Dudoit S, et al. Bioconductor: open soft-ware development for computational biology and bioinformatics. Genome Biol. 2004; 5: R80. doi:10. 1186/gb-2004-5-10-r80PMID:15461798