HAL Id: hal-02267014
https://hal.archives-ouvertes.fr/hal-02267014v2
Submitted on 8 Mar 2021
HAL is a multi-disciplinary open access
archive for the deposit and dissemination of
sci-entific research documents, whether they are
pub-lished or not. The documents may come from
teaching and research institutions in France or
abroad, or from public or private research centers.
L’archive ouverte pluridisciplinaire HAL, est
destinée au dépôt et à la diffusion de documents
scientifiques de niveau recherche, publiés ou non,
émanant des établissements d’enseignement et de
recherche français ou étrangers, des laboratoires
publics ou privés.
and Virological Responses to Therapeutic Vaccination
With Dendritic Cells in HIV-Infected Individuals
Rodolphe Thiébaut, Boris Hejblum, Hakim Hocini, Henri Bonnabau, Jason
Skinner, Monica Montes, Christine Lacabaratz, Laura Richert, Karolina
Palucka, Jacques Banchereau, et al.
To cite this version:
Rodolphe Thiébaut, Boris Hejblum, Hakim Hocini, Henri Bonnabau, Jason Skinner, et al.. Gene
Expression Signatures Associated With Immune and Virological Responses to Therapeutic Vaccination
With Dendritic Cells in HIV-Infected Individuals. Frontiers in Immunology, Frontiers, 2019, 10,
�10.3389/fimmu.2019.00874�. �hal-02267014v2�
Edited by: José Mordoh, Leloir Institute Foundation (FIL), Argentina
Reviewed by: Sampa Santra, Beth Israel Deaconess Medical Center and Harvard Medical School, United States Petronela Ancuta, Université de Montréal, Canada
*Correspondence: Rodolphe Thiébaut rodolphe.thiebaut@u-bordeaux.fr Yves Lévy yves.levy@inserm.fr †Present Address:
Karolina Palucka and Jacques Banchereau, The Jackson Laboratory, Farmington, CT, United States
Specialty section: This article was submitted to Vaccines and Molecular Therapeutics, a section of the journal Frontiers in Immunology
Received: 22 May 2018 Accepted: 05 April 2019 Published: 24 April 2019 Citation: Thiébaut R, Hejblum BP, Hocini H, Bonnabau H, Skinner J, Montes M, Lacabaratz C, Richert L, Palucka K, Banchereau J and Lévy Y (2019) Gene Expression Signatures Associated With Immune and Virological Responses to Therapeutic Vaccination With Dendritic Cells in HIV-Infected Individuals. Front. Immunol. 10:874. doi: 10.3389/fimmu.2019.00874
Gene Expression Signatures
Associated With Immune and
Virological Responses to Therapeutic
Vaccination With Dendritic Cells in
HIV-Infected Individuals
Rodolphe Thiébaut1,2,3*, Boris P. Hejblum1,2,3, Hakim Hocini3,4,5, Henri Bonnabau1,2,3,
Jason Skinner6, Monica Montes6, Christine Lacabaratz3,4,5, Laura Richert1,2,3,
Karolina Palucka6†, Jacques Banchereau6†and Yves Lévy3,4,5*
1Inserm, Bordeaux Population Health Research Center, UMR 1219, Univ. Bordeaux, ISPED, Bordeaux, France,2INRIA,
SISTM, Bordeaux, France,3VACCINE RESEARCH INSTITUTE – VRI, Groupe Henri-Mondor Albert-Chenevier, Créteil,
France,4INSERM, Unité U955, Créteil, France,5Université Paris-Est, Faculté de Médecine, UMR-S 955 Créteil, France, 6Baylor Institute for Immunology Research, Ralph Steinman Center for Cancer Vaccines, Dallas, TX, United States
The goal of HIV therapeutic vaccination is to induce HIV-specific immune response able to control HIV replication. We previously reported that vaccination with ex vivo generated Dendritic Cells (DC) loaded with HIV-lipopeptides in HIV-infected patients (n = 19) on antiretroviral therapy (ART) was well-tolerated and immunogenic. Vaccine-elicited HIV-specific T cell responses were associated with improved control of viral replication following antiretroviral interruption (ATI from w24 to w48). We show an inverse relationship between HIV-specific responses (production of IL-2, IL-13, IL-21, IFN-g, CD4 polyfunctionality, i.e., production of at least two cytokines) and the peak of viral load during ATI. Here we have performed an integrative systems vaccinology analysis including: (i) post vaccination (w16) immune responses assessed by cytometry, cytokine secretion, and Interferon-γ ELISPOT assays; (ii) whole blood and cellular gene expression measured during vaccination; and (iii) viral parameters following ATI, with the objective to disentangle the relationships between these markers and to identify vaccine signatures. During vaccination, 69 gene expression modules out of 260 varied significantly including (by order of significance) modules related to inflammation (Chaussabel Modules M3.2, M4.13, M4.6, M5.7, M7.1, M4.2), plasma cells (M4.11) and T cells (M4.1, 4.15). Cellular immune responses were positively correlated to genes belonging to T cell functional modules (M4.1, M4.15) at w16 and negatively correlated to genes belonging to inflammation modules (M7.1, M5.7, M3.2, M4.13, M4.2). More specifically, we show that prolonged increased abundance of inflammatory gene pathways related to toll-like receptor signaling (especially TLR4) are associated with both lower vaccine immune responses and control of viral replication post ATI. Further comparison of DC vaccine
gene signatures with previously reported non-HIV vaccine signatures, such as flu and pneumococcal vaccines, revealed common pathways across vaccines. Overall, these results show that too long duration and too high intensity of vaccine inflammatory responses hamper the magnitude of effector responses.
Keywords: dendritic cell, HIV, antiretroviral therapy interruption, therapeutic vaccine, gene expression, systems biology
INTRODUCTION
Systems biology approaches applied to immunology and vaccinology aim at analyzing the whole data available from various high throughput technologies to better understand and predict diseases and mechanisms of interventions (1–3). In vaccinology, these approaches have been successfully used in several applications such as yellow fever (4), influenza (5–
9), malaria (10), pneumococcus and meningococcus (11, 12), and HIV vaccines (13) to identify gene signatures associated with vaccine responses. This is exemplified by early changes of expression of some genes following Yellow Fever vaccination, such as TNFRSF17, which represent a signature predictive of cellular and humoral responses to this vaccine (4). In the same line, innate immune pathways associated with responses to rVSV-ZEBOV Ebola vaccine have been identified recently (14). These studies of changes in gene expression of components of the innate immune system help to identify relationships between various pathways involved in responses to vaccines (15,16) and may contribute to understand variations in vaccine responses according to individual characteristics such as the age (17), sex (6), or seasons (18). There is also a recent trend toward comparing the signatures of various vaccines to distinguish common and specific pathways modulated by each vaccine (11,12).
After more than 25 years of developing HIV therapeutic vaccines, overall the clinical effects of candidate vaccines remain disappointing [review in (19)]. Despite the capability of eliciting strong immune responses, the ability of the candidate vaccines to fully control HIV replication following antiretroviral treatment interruption remains modest and inconsistent across trials (20,
21). One of the major obstacles for therapeutic HIV vaccine development is the lack of clear understanding of mechanisms of action of the majority of the candidate vaccines and of immune correlates of HIV control. Here, we take the opportunity to apply a systems vaccinology approach to integrate virological, immunological and transcriptomic data from a clinical trial of vaccination with ex vivo generated Dendritic Cells (DC) loaded with HIV-lipopeptides in HIV infected patients on antiretroviral therapy (ART). The primary report of this study (DALIA study) showed that the vaccination strategy was well-tolerated and immunogenic (22). Vaccine-elicited HIV-specific T cell responses were associated with improved control of viral replication following antiretroviral interruption (ATI). Here, we report results from an integrative analysis taking advantage of repeated sampling and a large array of immuno-monitoring assays including whole blood and cellular gene expression,
as well as phenotypic and cytokine production in response to HIV vaccine antigens. We show here correlations between gene signatures, cellular responses measured before ATI and the magnitude of HIV rebound following ATI in vaccinated individuals. Especially, inflammatory pathways linked to TLR 4 were associated with poor vaccine responses whereas T cell modules induced by the vaccination were associated with viral control. Finally, by applying new statistical tools (23,24) to the re-analysis of existing data on the responses to other vaccines (11), we reveal common pathways associated with the response to different vaccines.
METHODS
DALIA Phase 1/2 Trial
The ANRS/VRI DALIA 1 is a phase I single-center study (North Texas Infectious Diseases Consultants, Dallas, TX) sponsored by the Baylor Institute for Immunology Research and the Agence Nationale de Recherches sur le SIDA et les hepatites (INSERM ANRS). The study was approved by the IRB of Baylor Research Institute (BRI) (NCT 00796770). All patients gave written informed consent.
The study design is shown in Figure 1. Eligible patients were asymptomatic HIV-1-infected adults with CD4+ T cell counts >500 cells/µL, CD4+ T cells ≥25%, plasma HIV RNA <50 copies/mL at screening and within the previous 3 months while on ART, with CD4+ nadir ≥300 cells/µL, and no history of AIDS-defining events. Nineteen patients were enrolled.
Participants received four vaccinations at w0, 4, 8, and 12. At w22, patients who had HIV-1 RNA <400 copies/mL were proposed to interrupt ART from w24 to w48. ART could be resumed from w24 to w48 at any time according to the following criteria: (i) if the patients or their doctors wished so; (ii) if CD4+ T cell count was <350 cells/µL and <25% of total lymphocytes at two consecutive measurements 2-weeks apart; and (iii) in the case of occurrence of an opportunistic infection or a serious non-AIDS defining event.
Post vaccination (w16) immune responses assessment by cytometry, cytokine secretion, and Interferon-γ ELISPOT assays were described elsewhere (22).
RNA Isolation and Microarray Sample
Preparation
Whole blood RNA was purified using TempusTM Spin RNA
Isolation Kit (ThermoFisher scientific). PBMC, CD4- and CD8-lymphocytes RNA were purified on Qiagen RNeasy Micro Kit. RNA was quantified using a ND-8000 spectrophotometer
FIGURE 1 | Outline of the ANRS/VRI DALIA 1 clinical trial. Gene abundance in whole blood has been evaluated at any single time point. Gene abundance following PBMC isolation and stimulation has been done with sample coming from baseline (W-4) and after vaccination (W16). At W16, a deep immunological evaluation has been performed with Multiplex, intracellular staining and ELISPOT.
(NanoDrop Technologies, Fisher Scientific, Ilkirch Cedex, France) before being checked for integrity on a 2100 BioAnalyzer (Agilent Technologies, Massy Cedex, France). cDNA was synthesized and biotin-labeled cRNA was generated by an in vitro transcription reaction using Ambion Illumina TotalPrep RNA Amplification Kits (Applied Biosystem/Ambion, Saint-Aubin, France). Labeled cRNA were hybridized on Illumina Human HT-12V4 BeadChips. All steps were done following the manufacturers’ protocols.
In vitro
Stimulation of Purified PBMC With
HIV Peptides for Gene Expression and
Cytokines Profile Analyses
For cytokine profile analysis, in vitro stimulation of purified PBMC with HIV antigens has been performed as previously reported (22). For gene expression analysis, 106 of thawed PBMC resuspended in RPMI 1640 media with L-Glutamax supplemented with Penicillin/Streptomycin and 10% HS (R-10HS) were stimulated for 6 and 20 h in 48-well plates with 2 µg/ml of HIV LIPO-5 vaccine itself, a pool of 5 long peptides corresponding to LIPO-5 vaccine sequences (Gag17– 35, Gag253–284, Pol325–355, Nef66–97, and Nef116–145) at 2 µM/peptide, or a pool of 36 peptides (15-mers overlapping by 11 amino acids, covering LIPO-5 vaccine sequences) at 2 µg/ml/peptide, in a humidified 37◦C cell incubator with 5%
CO2. Cells were then transferred in eppendorf tubes, pelleted,
resuspended in 350 µL lysis buffer and frozen immediately at −80◦C until transcriptomic analysis as described (25).
Published Data of Whole Blood
Transcriptional Response to Influenza and
Pneumococcal Vaccines
Data of the whole blood transcriptional response to influenza and pneumococcal vaccines of 46 individuals were publicly available in the NCBI Gene Expression Omnibus under code GSE30101 (11).
Statistical Analyses
Statistical analyses were performed using R software version 3.2.2 (The R foundation for Statistical Computing, Vienna, Austria). Gene transcription data were pre-processed (25,26) and corrected for potential batch effects (27). Statistical comparisons between groups of interest were based on empirical Bayes moderated t-statistics (28). An adaptive FDR procedure was used to control for test multiplicity (29). Unsupervised hierarchical clustering heatmap analysis was performed on scaled raw expression using Euclidean distance matrix and Ward’s linkage method (30). Canonical pathway and biological function analyses were then carried out using genes differentially expressed between groups with adaptive FDR-adjusted P < 0.05 and fold-change |FC| >1.5.
Time-course gene set analysis was performed using TcGSA, an innovative approach relying on mixed regression models and
likelihood ratio test to identify gene sets the expression which is significantly changing over time (23). It uses pre-defined gene sets, such as the Chaussabel’s modules or the BTMs (12). TcGSA accounts for patient heterogeneity and allows gene sets to be broken down into several distinct gene subsets with different dynamics. Gene expression from the DALIA trial was analyzed separately before and after antiretroviral treatment interruption due to the large and noticeable impact of the viral rebound, with a cubic polynomial time-basis for modeling gene-specific non-linear dynamics. Bootstrap analyses were performed to check the consistency of these results and allowed reporting the proportion (among 1,000 bootstrap samples) that a given module was selected. Gene abundances from the studies reported in Obermoser et al. (11) were modeled by a constant expression over time plus a spike at D1 (where the majority of the signal was observed for both the flu and the pneumococcal vaccines).
A transcriptomic signature was then derived through an integrative analysis of the gene expression at w16 from the significant modules identified by TcGSA together with the viro-immunological measurements at w16 in the DALIA trial, performed using sparse group Partial Least Squares (sgPLS) with leave-one-out cross-validation (31). This is a recent variable selection method for high-dimensional data that can account for an essential grouping structure in the data (i.e., the gene sets for the gene expression) and that is based on the maximization of the covariance between two data matrices (namely the viro-immune response and the gene abundances). A regularization approach based on Lasso penalty selects the most contributive variables. This allows to down-select the gene abundances at w16 most associated with the viro-immune response at w16. A complete description of the methods can be found in Liquet et al. (31).
Functional analysis of the immune signature was performed with Ingenuity Pathway Analysis software (IPA , Qiagen,R
Redwood City, California, Spring Release March 2018) and CluePedia and ClueGO in Cytoscape (32,33).
All microarray data is MIAME compliant and the raw and normalized data have been deposited in the MIAME compliant database Gene Expression Omnibus (http://www.ncbi.nlm.nih. gov/geo/, GEO Series accession number GSE46734).
RESULTS
Changes in Whole Blood Gene Expression
in Individuals Immunized With ex vivo
Generated DC HIV Vaccine
All 19 included patients received the four vaccinations as planned (Figure 1) with no changes in vaccine dose. Among them, 16 had all data available for the integrative analysis. Their characteristics are reported in Table 1. First, we analyzed changes in transcriptomic whole blood gene expression throughout the study; i.e., every 4 weeks from baseline, including time points before each vaccination at weeks 0, 4, 8, and 12 and at week 22, i.e., 2 weeks before ATI. For this, we developed a specific statistical method, the time course gene set analysis, to detect significant change of gene abundance in groups of genes over time taking into account the heterogeneity of the dynamics
TABLE 1 | Baseline characteristics.
n =16
Male n(%) 14 (88)
Age (years) Median (IQR) 45 (36–49)
Race/Ethnicity
White n(%) 11 (69)
Black/African American n(%) 2 (13)
Hispanic/Latino n(%) 3 (19)
Body Mass Index (kg/m2) Median (IQR) 27 (25–28)
(19–25) n(%) 4 (25)
(25–30) n(%) 11 (69)
>=30 n(%) 1 (6)
Mode of transmission (type of sexual contact)
Homosexual/bisexual n(%) 13 (81)
Heterosexual n(%) 3 (19)
HIV clinical stage
A n(%) 15 (94)
B n(%) 1 (6)
Nadir CD4+ (/mm3) Median (IQR) 346 (318–411) CD4+ (/mm3) at W-8 Median (IQR) 711 (635–930) CD4+ (/mm3) at W0 Median (IQR) 647 (545–757) HAART With NRTI n(%) 16 (100) With NNRTI n(%) 14 (88) With PI n(%) 3 (19)
Time between the start date of the first HAART regimen and inclusion (years)
Median (IQR) 10 (6.7–13.7)
Time between the start date of current HAART regimen and inclusion (years)
Median (IQR) 2.8 (1–3.8)
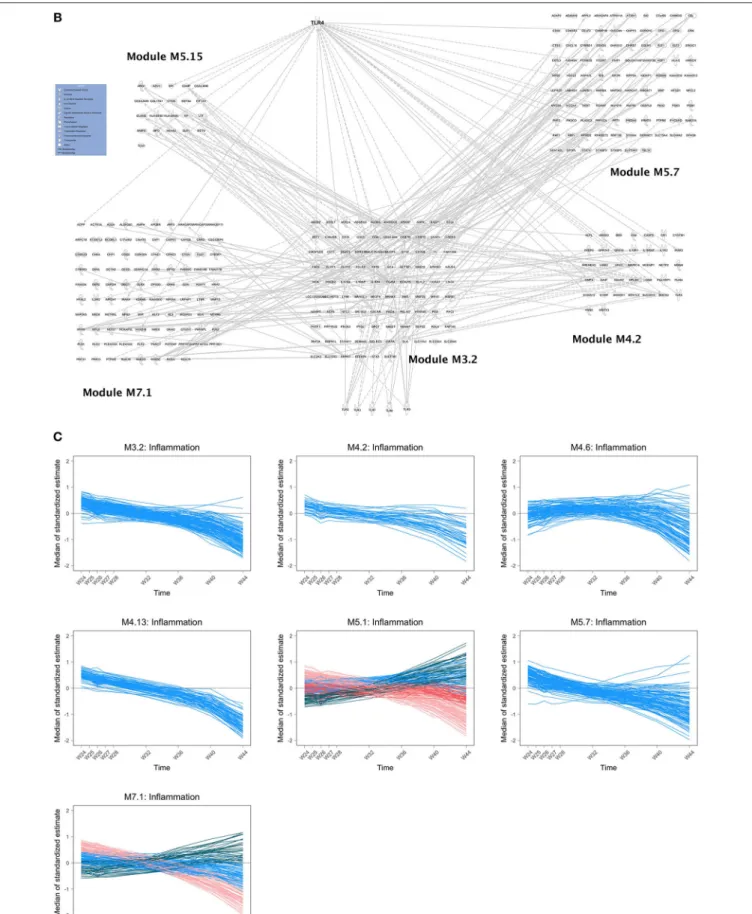
among a given group (23). A simple gene by gene analysis did not reveal significant changes after correction for test multiplicity (False Discovery rate <5%). The analysis of the time course of gene sets, as defined by Chaussabel et al. (34), revealed 69 modules with dynamics that changed over time before ATI. As shown in Figure 2A, the modules exhibiting significant changes (as reported by order of significance through the percentile distribution of the statistics) were modules annotated: (i) “inflammation” (M3.2, M4.13, M4.6, M5.7, M7.1, M4.2, M5.1) and; (ii) and T cell activation (M4.1, M4.15). The dynamics of gene abundances over time varied between modules (Figure 2A). Inflammation modules M3.2, M4.2, M4.6, M4.13, M5.7 decreased in average abundance during the period of vaccination and then increased to reach levels above baseline before treatment interruption (at w16). Interestingly, the T cell modules (M4.1, M4.15) presented inverse dynamics. The inflammation modules M5.1 and M7.1 increased continuously during the vaccination period.
The composition of M3.2 was mainly based on genes related to toll-like receptor signaling pathway, especially TLR4 (Figure 2B) and genes related to neutrophil activation involved in immune
response (e.g., ADGRG3, ALOX5, BST1, CD55, CD63, CDA, CKAP4, CRISPLD2, FOLR3, FPR2, GCA, ITGAM, LILRA3, MME, MMP25, OSCAR). Ingenuity Pathway analysis (IPA) revealed an interaction of the different inflammatory modules centered on the M3.2 module and the TLR4 pathway (Figure 2B). The module M4.6 that includes MYD88 is enriched in genes related to type 1 and type 2 (IFNγ) interferon signaling pathways.
The modules M4.13, annotated “activation and cell division of leukocytes,” M5.7 and M7.1 (Figure 2B) are related to cell activation, and so is module M5.1, which is associated to myeloid cells and neutrophils activation (including TYROBP gene related to several processes). Regarding T cell activation modules, changes in gene expression during the vaccination period concerned more specifically the module M4.1, which is composed of genes related to T cell selection (e.g., BCL11B, BCL2, CCR7, CD28) and diversification of TCR (e.g., BCL11B, LEF1, TCF7); and the module M4.15, which is also related to T cell selection (LY9, THEMIS, ZAP70) and differentiation (e.g., CD2, CD27, GPR18, ITK, LCK, LY9, RASGRP1). In addition, other modules
related to platelets (M1.1), mitochondrial respiration and stress (M5.10, M5.6, M6.2), erythrocytes (M3.1, M2.3), plasma cells (M4.11) exhibited significant changes during the vaccination period.
Following ATI (from week 24 onwards), changes in gene expression were assessed every week until week 28 and every 4 weeks until week 44. The abundance of the genes in the inflammatory modules tended to decrease over time up to 44 weeks (Figure 2C). The dynamics of the genes from some modules (M5.1, M7.1) was more complex, with subsets of the genes showing distinct dynamics. During this period, there was a significant increase in the abundance of type-1 interferon genes, as previously described in HIV/SIV primary infection (35), and enriched in the module M1.2, M3.4, and M5.12 (Figure 2D).
In a robustness analysis, the analysis of the dynamics of the genes during vaccination (preATI) was performed with the Blood Transcriptional Modules (BTMs) that are other gene sets generated using another approach than Chaussabel et al. (12). Overall, the results were consistent with the initial analysis
FIGURE 2 | (A) Dynamics of gene abundance before antiretroviral treatment interruption. Dynamics of the gene abundance in various modules that changed significantly over time including inflammatory modules (M3.2, M4.13, M4.6, M5.7, M7.1, M4.2, M5.1) and T cell module (M4.1). Lines are smoothed trajectories predicted by the longitudinal statistical model (23). (B) Composition of inflammatory modules and relationship with TLRs. Relationships between inflammatory modules M3.2 and M4.2, M5.7, M7.1, and M5.15 (annotated “Neutrophils”) and TLR genes using Pathexplorer in IPA. Links between modules that are not concerning M3.2 are not represented. Links between inflammatory modules other than M3.2 and TLRs other than TLR4 are not represented. (C) Dynamics of gene abundance after antiretroviral treatment interruption: inflammatory modules. Dynamics of gene abundance in “inflammatory modules” that changed significantly over time. Various colors reflects different trajectories in the same modules defined by unsupervised clustering (23). (D) Dynamics of gene abundance after antiretroviral treatment interruption: interferon modules.
using the Chaussabel’s modules. There was a significant variation of 26 modules enriched in activated dendritic cells/monocytes (BTM64), in monocytes (BTM11.0, BTM118.0, BTM37.1, BTM163), in T cells (BTM7.0, BTM223) and modules annotated “immune activation” (BTM37.0), “T cell activation” (BTM7.1), “TLR and inflammatory signaling (BTM16). The other modules were “blood coagulation” (BTM11.1), “platelet activation” (BTM32.0, M32.1), and 6 modules were not annotated (see
Supplementary Table 1).
Changes in Cellular Gene Expression in
Response to HIV Antigens in Vaccinated
Individuals
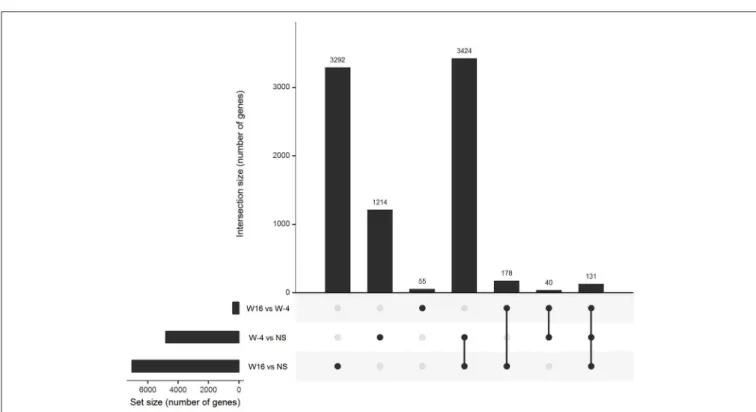
PBMC collected at baseline and at week 16, 4 weeks after the last vaccination, were stimulated with 15-mers overlapping HIV peptides carried by ex vivo DC vaccines (see section Methods) during 20 h. The stimulation by 15-mers led to a differential expression of a large number of genes compared to unstimulated cells (Figure 3). At baseline, the comparison between stimulated and unstimulated conditions showed a differential expression of 4,638 genes, including 1,214 that were differentially expressed at baseline only and not at week 16. The genes differentially expressed at baseline only belonged to various pathways including defense pathways, especially the type 1 interferon signaling pathway (Figures 4A,B). At w16, the comparison revealed a differential expression of 6,716 genes, including 3,292 that were differentially expressed at w16 only. At week 16, even more pathways were mobilized, from general cellular processes to immune response processes (Figure 4C). When looking at the 404 genes that significantly changed between baseline and week 16 after stimulation, there is a clear enrichment of the genes involved in pathways related to response to cytokines: CXCL9, 10, 11, 13, FOXO3, FYN, HLADP, DQ, DR (Figure 4D). More specifically, it involved Th1 and Th2 pathways, T Helper
cell differentiation, dendritic cell maturation, and antigen presentation pathways.
Integrative Systems Vaccinology: Linking
Changes in Gene Expression,
Vaccine-Elicited Immune Responses, and
Viral Dynamics Post ATI
Then, we assessed whether changes in whole blood gene expression identified through module variations at week 16 (4 weeks after the last vaccination and before ATI) were correlated to HIV-specific cellular immune response at the same time point and the viral dynamics following ATI. As previously published (36), the vaccination led to an increase in the magnitude and breath of HIV-specific T-cell responses as measured by IFN-γ ELISPOT after stimulation by HIV peptides pools. HIV-specific CD4+ and CD8+ T responses were polyfunctional (producing 2 or more cytokine) as measured by ICS. Also, vaccination induced a broad repertoire of cytokine-secreting cells as assessed by Luminex assay (IL-2, IL-13, IL-17, IL-21, IP10). The different types of T-cell responses were summarized by a polyfunctionality U-score for multivariate data [see section Methods and reference in (22)]. The cellular responses measured at week 16 after vaccination and before ART interruption were associated with the peak of viral load measured after ATI (22).
We found that a large part of the inflammatory modules (M3.2, M4.2, M4.13, M5.7, M7.1) was negatively correlated to vaccine-elicited HIV specific cellular immune responses. The module 5.15, annotated “Neutrophils,” was also negatively correlated to the immune response (Figure 5). All these modules were associated with each other and especially with M3.2 (Figure 2B). In contrast, modules related to the T cell response (M4.1 and M4.15) were positively correlated to these cellular immune responses. Inflammatory gene expression changes were positively correlated with the maximum HIV RNA values post ATI, whereas T cell activation gene expression changes were
FIGURE 3 | Gene expression in stimulated PBMC. Upset diagram of the genes differentially expressed in PBMC after 20 h of stimulation with 15 mers at week-4 (baseline) and week 16 in comparison of unstimulated cells and between week-4 and week 16.
negatively correlated with this virological parameter (Figure 5). Thus, the patients who mobilized predominantly inflammatory genes in response to vaccination were those who presented the worst immune responses to the vaccine and the highest HIV RNA levels after ATI. The average correlation between gene abundance of inflammation modules and maximum viral load after ATI was 0.53 (Supplementary Figure 1). Interestingly, the inverse correlation identified between inflammatory gene expression and vaccine response at week 16 was already consistently detectable at earlier time points (at weeks 4, 8, and 12) (Supplementary Table 2).
Highlighting a Common Inflammatory
Pathway to Different Vaccines
In order to better characterize mechanisms of dendritic cell-based vaccine immunogenicity, we compared whole blood gene expression signatures identified in our trial with those described with other vaccines, for which protective correlates have been identified. We took the opportunity of published studies in which the same methods for measuring transcriptomic changes were used as the ones in the present study. For this, we revisited published data using our statistical approach based on gene set analyses of longitudinal data [here and detailed in (23)]. Obermauser et al. reported the early commitment of inflammation modules following Pneumococcus and Influenzae vaccinations in healthy humans (11), with a lower inflammatory signal with the Influenzae vaccine. We found a consistent commitment of the inflammatory modules especially M3.2
(including RGL4, CDA, NFIL3), M4.13 (including TREML2), and M4.2 (including S100P) both in our therapeutic HIV vaccine trial and in the Pneumoccocus and Influenzae vaccine data sets (23). Furthermore, an increased abundance of the genes of these modules was associated with a poorer response to the Pneumoccocus vaccine [as reported in (11)] and to the Influenzae vaccine, in accordance with the lower response to dendritic cell-HIV vaccine in our trial.
DISCUSSION
By taking advantage of both blood and cellular analyses, a longitudinal study design and the comparison between a pre- and post ATI period, we were able to demonstrate an association between the mobilization of inflammatory pathways, the magnitude of vaccine elicited HIV cellular responses and the viral dynamics after ATI after experimental therapeutic DC-based vaccination in HIV-infected patients. The results reported here contribute to identify gene signatures of a therapeutic DC-based vaccine against HIV and to a better understanding of the actions of these vaccines.
Longitudinal analysis of whole blood gene expression revealed changes in gene abundance from modules involved in “inflammation” and “activation” and “differentiation of T cell.” Interestingly, changes in abundance of genes involved in myeloid activation and trafficking were detectable at early vaccination time points. Although activation of inflammatory pathways is known as a physiological response to vaccinations, our results
FIGURE 4 | Pathways of differentially expressed genes in stimulated PBMC. Pathways of differentially expressed genes between stimulated and unstimulated cells at: (A) W-4 (N = 1,214) Overview chart with functional groups and (B) Functionally grouped network with terms as nodes linked based on their kappa score (C) W16 (N = 3,292) and (D) genes which expression changed significantly between week-4 (baseline) and week 16 (N = 404) after stimulation. Analysis performed with CLUEGO (GO Biological and Immune System processes ontologies, Network specificity: Global).
FIGURE 5 | Integrative analysis of changes in gene expressions and cellular immune responses at W16 and viral dynamics after ATI. Correlations from −1 (blue) to +1 (red) estimated from sparse partial least square approach. Peak HIV RNA plasma viral load Post ATI is the maximum observed value of HIV RNA viral load after ATI. Other immune markers have been measured at week 16: IL-21, IFN-γ, IL-2, IL-13 by LUMINEX and CD4 polyfunctionality by ICS. LUMIscore and TH1score are calculated scores using several cytokine measurements at W16 (see section methods).
revealed also that modifications of genes related to differentiation and activation of T cells following vaccination behave in the opposite way at the same time points. Consistently, genes related to toll-like receptor signaling pathways and Interferon type 1
and 2 were mobilized in the blood of vaccinated individuals. Comparison between pre- and post-vaccination (w16) changes in gene expression induced by HIV antigen stimulation enriched these observations showing an induction of genes related to
cellular immune responses to cytokines, T cell, and dendritic cell responses.
A very specific feature of our study consists in the timing of whole blood sampling for gene expression that was performed every 4 weeks. This schedule is very different from previous studies that usually took blood few hours after vaccination [e.g., (10, 11, 13)]. Here, we thus studied long-term trends of gene abundance that could be associated to changes in equilibrium states of biological functions or changes in the representation of cell populations. The intensity of the signals in the whole blood associated with the vaccinations was high enough to detect the changes of genes abundance and did not require additional analyses taking into account cell populations (37). Analyses at the module (i.e., gene set) level were needed to detect the signals in this study during the vaccination period (23) because this type of analysis is much more powerful than a gene-by-gene analysis (38). By not measuring changes of gene abundance at early days after vaccination, we may have missed the dynamics of the innate response detectable at day 1 and day 3 after vaccination (10, 11, 14, 39). Nevertheless, it is interesting to note that subtle changes are still detectable later on (i.e., after day 7) when using geneset/module approaches with appropriate statistical methods (23). This is confirmed also by our re-analysis of public datasets of transcriptomic changes after Pneumococcus or Influenzae vaccination in humans (11). Modules including genes associated with inflammation (M3.2, M4.2, M5.1, M5.7) were detected day 1 after pneumococcal vaccine but also with flu vaccine when using the same analytical approach than in this paper (11). The same observation was made following Meningococcus vaccine as reported in Li et al. (12). TLR and inflammatory signaling (BTM 16), enrichment in neutrophils (BTM37.1), in monocytes (BTM11.0, BTM118.0) were found 6 h after a vaccination with a recombinant HIV-1 envelop glycoprotein adjuvanted with the TLR4 agonist GLA-AF (13). The same inflammatory/TLR/chemokines BTMs signatures were reported day 1 and day 2 following malaria vaccine based on Ad35 vector or virus-like particles based on a mixture of the fusion reconstruct (RTS) with native HBsAg (S) (10). Therefore, it is interesting to note that signatures mostly reported at early time points were also found later in our study.
A too high and long-standing change in abundance of gene expression associated with toll-like receptor signaling pathways and monocyte/neutrophil activation appeared to be deleterious for the immune response to the vaccine. This may have an important impact on the use of adjuvants that are needed but may require refined adjustments (16) to avoid excessive inflammation that could be deleterious (40). The idea of counter-regulatory mechanisms induced by vaccines has already been discussed such as the role of monocytes limiting the vaccine response (14,41). This mechanism should be clearly distinguished from the TLR and inflammasome signals that amplify the T cell responses (42) as this last phenomenon occurs at the place of the immune response, that is in the lymph nodes, as an early event in response to vaccine (43). Interestingly, these transcriptional signature in whole blood were also found to be associated to the response to other vaccines such as Pneumococcus (11) and Malaria (10). For instance, in the case of pneumococcal vaccine group, Obermoser et al. reported a negative correlation between
serology results and day 7 modular transcriptional data for module associated with inflammation (M3.2, M4.2, and M4.13). The direction of the association between the gene signature and the immunological response may change over time. The cellular CD4-T cell response measured at day 14 after vaccination with Ad35 followed by RTS,S/AS01 was positively associated with the inflammatory/TLR/chemokines responses (including BTM16) at day 1 and negatively at day 6 [see Figure S5 in (10)]. Therefore, the deleterious association of persistent inflammatory signature in whole blood several days after vaccination with the immune response to vaccine has been reported in several vaccine platforms. This cross-validates the phenomenon and indicates a potential broad mechanism driving the immune response to vaccine. Although additional information on single-cell would be of interest to better understand the mechanisms leading to the variation of the vaccine response, key results are biologically relevant and may be further explored by tracing some cell populations such as inflammatory monocytes (41). There are other examples where the transcriptome has helped in deciphering the role of cell populations that was then specifically quantified as in Obermauser et al. (11) where the change of the abundance of genes (e.g., TNFRSF17) that constitutes a plasma cell precursor signature (M4.11) was in line with the dynamics of the concentration of plasmablasts.
The involvement of pathways including TLR4 and MYD88 raises the hypothesis that gut translocation may interfere with the responses to the vaccine as it does with other immunotherapy (44). Other mechanisms could induce TLR4 signaling. It has been established that soluble gp120 has a pro-inflammatory action through induction of TNFα, IL-8, IL-6, CCL2 (45, 46). Inflammatory response can also be triggered by the direct interaction of HIV-gp120 and TLR4 molecule (47). This interaction leads to both the production of proinflammatory cytokines and to increase the HIV replication. Furthermore, TLR expression and function can be up-regulated in response to HIV-1 infection, emphasizing the inflammatory response (48).
These types of result should help improving the potency of vaccines by combining vaccines and immunomodulatory tools (49). For instance, TLR7 agonist has been used successfully to activate the reservoir of SIV-infected monkeys and enhance immunological response of a recombinant adenovirus serotype 26 (Ad26) prime and modified vaccinia Ankara (MVA) boost vaccine (50). However, it is unclear whether the beneficial effect of the TLR7 agonist reflected its potential role as a vaccine adjuvant or as a latency reversing agent. The effect of TLR7 agonist could actually have reduced the immunological effect of the vaccine in case of an exaggerated inflammatory response as described in the present study.
In conclusion, inflammatory pathways related to toll-like receptor signaling pathways that were committed in response to this DC-based therapeutic HIV vaccine were associated with a poorer immune response to vaccination and poorer viral control after ATI. Given a similar involvement and impact of these pathways in responses to other vaccines, it is important to control the kinetics of inflammatory responses induced by vaccines. In total, these results are helpful for the design of further strategies combining vaccines with adjuvants and/or immunomodulators.
ETHICS STATEMENT
The study was approved by the IRB of Baylor Research Institute (BRI) (NCT 00796770). All patients gave written informed consent.
AUTHOR CONTRIBUTIONS
YL and JB conceived the project and designed the experiments. HH and JS conducted the transcriptomics analyses. CL and MM conducted the immunological analyses. RT, BH, HB, and LR conducted the statistical analyses. RT and YL analyzed the data and wrote the manuscript. All the authors provided critical feedback on the manuscript prior to publication and have agreed to the final content.
FUNDING
This study was supported by a grant from the Agence Nationale de Recherches sur le SIDA et les hépatites virales (ANRS). LR received a Ph.D. scholarship financed by Sidaction. This work was supported by the Investissements d’Avenir program managed by the ANR under reference
ANR-10-LABX-77-01 funding the Vaccine Research Institute (VRI).
ACKNOWLEDGMENTS
The authors wish to thank all participants of the ANRS/VRI DALIA 1 trial and the members of the trial committees and of the ANRS/VRI DALIA 1 study team. DSMB members: William Duncan, Roy M. Gulick, Daniel R. Kuritzkes, James Neaton, Richard Pollard (Chair). Event Validation Committee members: Joseph Fay, Ronald Mitsuyasu, Jean-Paul Viard. Trial management: Derek Blankenship, Carson Harrod, David Jutras, Bryan King, Christine Lacabaratz, Sophie P’erusat, Elisa Priest, Charlie Quinn, Anna Laura Ross, Louis Sloan. Apheresis Team at Baylor University Medical Center (BUMC) led by Dr Luis Pineiro. Vaccine/GMP team: Susan Burkeholder, Amanda Cobb, Charles McWilliams, Jennifer Finholt-Perry, Lee Roberts, David Schackmann.
SUPPLEMENTARY MATERIAL
The Supplementary Material for this article can be found online at: https://www.frontiersin.org/articles/10.3389/fimmu. 2019.00874/full#supplementary-material
REFERENCES
1. Trautmann L, Sekaly R-P. Solving vaccine mysteries: a systems biology perspective. Nat Immunol. (2011) 12:729–731. doi: 10.1038/ni.2078 2. Pulendran B, Li S, Nakaya HI. Systems vaccinology. Immunity. (2010) 33:516–
29. doi: 10.1016/j.immuni.2010.10.006
3. Chuang H-Y, Hofree M, Ideker T. A decade of systems biology. Annu Rev Cell Dev Biol. (2010) 26:721–44. doi: 10.1146/annurev-cellbio-100109-104122 4. Querec TD, Akondy RS, Lee EK, Cao W, Nakaya HI, Teuwen D, et al. Systems
biology approach predicts immunogenicity of the yellow fever vaccine in humans. Nat Immunol. (2009) 10:116–25. doi: 10.1038/ni.1688
5. Nakaya HI, Wrammert J, Lee EK, Racioppi L, Marie-Kunze S, Haining WN, et al. Systems biology of vaccination for seasonal influenza in humans. Nat Immunol. 12:786–95. doi: 10.1038/ni.2067
6. Furman D, Hejblum BP, Simon N, Jojic V, Dekker CL, Thiébaut R, et al. Systems analysis of sex differences reveals an immunosuppressive role for testosterone in the response to influenza vaccination. Proc Natl Acad Sci USA. (2013) 111:869–74. doi: 10.1073/pnas.1321060111
7. Tsang JS, Schwartzberg PL, Kotliarov Y, Biancotto A, Xie Z, Germain RN, et al. Global analyses of human immune variation reveal baseline predictors of postvaccination responses. Cell. (2014) 157:499–513. doi: 10.1016/j.cell.2014.03.031
8. Bucasas KL, Franco LM, Shaw CA, Bray MS, Wells JM, Niño D, et al. Early patterns of gene expression correlate with the humoral immune response to influenza vaccination in humans. J Infect Dis. (2011) 203:921– 9. doi: 10.1093/infdis/jiq156
9. Henn AD, Wu S, Qiu X, Ruda M, Stover M, Yang H, et al. High-resolution temporal response patterns to influenza vaccine reveal a distinct human plasma cell gene signature. Sci Rep. (2013) 3:2327. doi: 10.1038/srep 02327
10. Kazmin D, Nakaya HI, Lee EK, Johnson MJ, van der Most R, van den Berg RA, et al. Systems analysis of protective immune responses to RTS,S malaria vaccination in humans. Proc Natl Acad Sci USA. (2017) 114:2425– 30. doi: 10.1073/pnas.1621489114
11. Obermoser G, Presnell S, Domico K, Xu H, Wang Y, Anguiano E, et al. Systems scale interactive exploration reveals quantitative and qualitative
differences in response to influenza and pneumococcal vaccines. Immunity. (2013) 38:831–44. doi: 10.1016/j.immuni.2012.12.008
12. Li S, Rouphael N, Duraisingham S, Romero-Steiner S, Presnell S, Davis C, et al. Molecular signatures of antibody responses derived from a systems biology study of five human vaccines. Nat Immunol. (2013) 15:195– 204. doi: 10.1038/ni.2789
13. Anderson J, Olafsdottir TA, Kratochvil S, McKay PF, Östensson M, Persson J, et al. Molecular signatures of a TLR4 agonist-adjuvanted HIV-1 vaccine candidate in humans. Front Immunol. (2017) 9:301. doi: 10.3389/fimmu.2018.00301
14. Rechtien A, Richert L, Lorenzo H, Martrus G, Hejblum B, Dahlke C, et al. Systems vaccinology identifies an early innate immune signature as a correlate of antibody responses to the ebola vaccine rVSV-ZEBOV. Cell Rep. (2017) 20:2251–61. doi: 10.1016/j.celrep.2017.08.023
15. Pulendran B. Learning immunology from the yellow fever vaccine: innate immunity to systems vaccinology. Nat Rev Immunol. (2009) 9:741– 7. doi: 10.1038/nri2629
16. Kasturi SP, Skountzou I, Albrecht RA, Koutsonanos D, Hua T, Nakaya HI, et al. Programming the magnitude and persistence of antibody responses with innate immunity. Nature. (2011) 470:543–7. doi: 10.1038/nature 09737
17. Sobolev O, Binda E, O’Farrell S, Lorenc A, Pradines J, Huang Y, et al. Adjuvanted influenza-H1N1 vaccination reveals lymphoid signatures of age-dependent early responses and of clinical adverse events. Nat Immunol. (2016) 17:204–13. doi: 10.1038/ni.3328
18. Dopico XC, Evangelou M, Ferreira RC, Guo H, Pekalski ML, Smyth DJ, et al. Widespread seasonal gene expression reveals annual differences in human immunity and physiology. Nat Commun. (2015) 6:7000. doi: 10.1038/ncomms8000
19. Pantaleo G, Lévy Y. Vaccine and immunotherapeutic interventions. Curr Opin HIV AIDS. (2013) 8:236–42. doi: 10.1097/COH.0b013e32835 fd5cd
20. Barouch DH, Whitney JB, Moldt B, Klein F, Oliveira TY, Liu J, et al. Therapeutic efficacy of potent neutralizing HIV-1-specific monoclonal antibodies in SHIV-infected rhesus monkeys. Nature. (2013) 503:224– 8. doi: 10.1038/nature12744
21. Garcia F, Climent N, Guardo AC, Gil C, Leon A, Autran B,
et al. A dendritic cell-based vaccine elicits T cell responses
associated with control of HIV-1 replication. Sci Transl Med. (2013) 5:166ra2. doi: 10.1126/scitranslmed.3004682
22. Lévy Y, Thiébaut R, Montes M, Lacabaratz C, Sloan L, King B, et al. Dendritic cell-based therapeutic vaccine elicits polyfunctional HIV-specific T-cell immunity associated with control of viral load. Eur J Immunol. (2014) 44:2802–10. doi: 10.1002/eji.201344433
23. Hejblum BP, Skinner J, Thiébaut R. Time-course gene set analysis for longitudinal gene expression data. PLoS Comput Biol. (2015) 11:e1004310. doi: 10.1371/journal.pcbi.1004310
24. Liquet B, Cao KL, Hocini H, Thiébaut R. A novel approach for biomarker selection and the integration of repeated measures experiments from two assays. BMC Bioinformatics. (2012) 13:325. doi: 10.1186/1471-2105-13-325 25. Bolstad BM, Irizarry RA, Astrand M, Speed TP. A comparison
of normalization methods for high density oligonucleotide
array data based on variance and bias. Bioinformatics. (2003)
19:185–93. doi: 10.1093/bioinformatics/19.2.185
26. Xie Y, Wang X, Story M. Statistical methods of background
correction for Illumina BeadArray data. Bioinformatics. (2009)
25:751–7. doi: 10.1093/bioinformatics/btp040
27. Johnson WE, Li C, Rabinovic A. Adjusting batch effects in microarray expression data using empirical Bayes methods. Biostatistics. (2007) 8:118– 27. doi: 10.1093/biostatistics/kxj037
28. Smyth GK. Linear models and empirical bayes methods for assessing differential expression in microarray experiments. Stat Appl Genet Mol Biol. (2004) 3:Article3. doi: 10.2202/1544-6115.1027
29. Benjamini Y, Krieger AM, Yekutieli D. Adaptive linear step-up procedures that control the false discovery rate. Biometrika. (2006) 93:491–507. doi: 10.1093/biomet/93.3.491
30. Eisen MB, Spellman PT, Brown PO, Botstein D. Cluster analysis and display of genome-wide expression patterns. Proc Natl Acad Sci USA. (1998) 95:14863– 8. doi: 10.1073/pnas.95.25.14863
31. Liquet B, De Micheaux PL, Hejblum BP, Thiébaut R. Group and sparse group partial least square approaches applied in genomics context. Bioinformatics. (2015) 32:35–42. doi: 10.1093/bioinformatics/btv535
32. Bindea G, Galon J, Mlecnik B. CluePedia Cytoscape plugin: pathway insights using integrated experimental and in silico data. Bioinformatics. (2013) 29:661–3. doi: 10.1093/bioinformatics/btt019
33. Bindea G, Mlecnik B, Hackl H, Charoentong P, Tosolini M, Kirilovsky A, et al. ClueGO: a Cytoscape plug-in to decipher functionally grouped gene ontology and pathway annotation networks. Bioinformatics. (2009) 25:1091– 3. doi: 10.1093/bioinformatics/btp101
34. Chaussabel D, Quinn C, Shen J, Patel P, Glaser C, Baldwin N, et al. A modular analysis framework for blood genomics studies:
application to systemic lupus erythematosus. Immunity. (2008)
29:150–64. doi: 10.1016/j.immuni.2008.05.012
35. Jacquelin B, Mayau V, Targat B, Liovat AS, Kunkel D, Petitjean G, et al. Nonpathogenic SIV infection of African green monkeys induces a strong but rapidly controlled type I IFN response. J Clin Invest. (2009) 119:3544– 55. doi: 10.1172/JCI40093
36. Levy JA, Scott I, Mackewicz C. Protection from HIV/AIDS:
the importance of innate immunity. Clin Immunol. (2003)
108:167–74. doi: 10.1016/S1521-6616(03)00178-5
37. Shen-Orr SS, Tibshirani R, Khatri P, Bodian DL, Staedtler F, Perry NM, et al. Cell type-specific gene expression differences in complex tissues. Nat Methods. (2010) 7:287–9. doi: 10.1038/nmeth.1439
38. Subramanian A, Tamayo P, Mootha VK, Mukherjee S, Ebert BL, Gillette MA, et al. Gene set enrichment analysis: a knowledge-based approach for
interpreting genome-wide expression profiles. Proc Natl Acad Sci USA. (2005) 102:15545–50. doi: 10.1073/pnas.0506580102
39. Nakaya HI, Hagan T, Sai S, Blomberg BB. Systems analysis of immunity to influenza vaccination across multiple years and in diverse resource systems analysis of immunity to influenza vaccination across multiple years and in diverse populations reveals shared molecular signatures. Immunity. (2015) 43:1186–98. doi: 10.1016/j.immuni.2015.11.012
40. Lindqvist M, Nookaew I, Brinkenberg I, Samuelson E, Thörn K, Nielsen J, et al. Unraveling molecular signatures of immunostimulatory adjuvants in the female genital tract through systems biology. PLoS ONE. (2011) 6:e20448. doi: 10.1371/journal.pone.0020448
41. Mitchell LA, Henderson AJ, Dow SW. Suppression of vaccine
immunity by inflammatory monocytes. J Immunol. (2012)
189:5612–21. doi: 10.4049/jimmunol.1202151
42. O’Donnell H, Pham OH, Li L, Atif SM, Lee SJ, Ravesloot MM, et al. Toll-like receptor and inflammasome signals converge to amplify the innate bactericidal capacity of T helper 1 cells. Immunity. (2014) 40:213– 24. doi: 10.1016/j.immuni.2013.12.013
43. Sagoo P, Garcia Z, Breart B, Lemaître F, Michonneau D, Albert ML, et al. In vivo imaging of inflammasome activation reveals a subcapsular macrophage burst response that mobilizes innate and adaptive immunity. Nat Med. (2016) 22:64–71. doi: 10.1038/nm.4016
44. Routy B, Le Chatelier E, Derosa L, Duong CPM, Alou MT, Daillère R, et al. Gut microbiome influences efficacy of PD-1–based immunotherapy against epithelial tumors. Science. (2018) 359:91–7. doi: 10.1126/science.aan3706 45. Rychert J, Strick D, Bazner S, Robinson J, Rosenberg E. Detection of
HIV gp120 in plasma during early HIV infection is associated with increased proinflammatory and immunoregulatory cytokines. AIDS Res Hum Retroviruses. (2010) 26:1139–45. doi: 10.1089/aid.2009.0290
46. Del Corno M, Donninelli G, Varano B, Da Sacco L, Masotti A, Gessani S. HIV-1 gpHIV-120 activates the STAT3/interleukin-6 axis in primary human monocyte-derived dendritic cells. J Virol. (2014) 88:11045–55. doi: 10.1128/JVI.00307-14 47. Del Cornò M, Cappon A, Donninelli G, Varano B, Marra F, Gessani S. HIV-1 gp120 signaling through TLR4 modulates innate immune activation in human macrophages and the biology of hepatic stellate cells. J Leukoc Biol. (2016) 100:599–606. doi: 10.1189/jlb.4A1215-534R
48. Hernández JC, Stevenson M, Latz E, Urcuqui-inchima S. HIV type 1 infection up-regulates TLR2 and TLR4 expression and function in vivo and in vitro. AIDS Res Hum Retroviruses. (2012) 28:1313–28. doi: 10.1089/aid.2011.0297 49. Alter G, Sekaly RP. Beyond adjuvants: antagonizing inflammation
to enhance vaccine immunity. Vaccine. (2015) 33:B55–
9. doi: 10.1016/j.vaccine.2015.03.058
50. Borducchi EN, Cabral C, Stephenson KE, Liu J, Abbink P, Ng’ang’a D, et al. Ad26/MVA therapeutic vaccination with TLR7 stimulation in SIV-infected rhesus monkeys. Nature. (2016) 540:284–7. doi: 10.1038/nature 20583
Conflict of Interest Statement: The authors declare that the research was conducted in the absence of any commercial or financial relationships that could be construed as a potential conflict of interest.
Copyright © 2019 Thiébaut, Hejblum, Hocini, Bonnabau, Skinner, Montes, Lacabaratz, Richert, Palucka, Banchereau and Lévy. This is an open-access article distributed under the terms of the Creative Commons Attribution License (CC BY). The use, distribution or reproduction in other forums is permitted, provided the original author(s) and the copyright owner(s) are credited and that the original publication in this journal is cited, in accordance with accepted academic practice. No use, distribution or reproduction is permitted which does not comply with these terms.