HAL Id: hal-03126950
https://hal-univ-pau.archives-ouvertes.fr/hal-03126950
Submitted on 19 Mar 2021HAL is a multi-disciplinary open access archive for the deposit and dissemination of sci-entific research documents, whether they are pub-lished or not. The documents may come from teaching and research institutions in France or abroad, or from public or private research centers.
L’archive ouverte pluridisciplinaire HAL, est destinée au dépôt et à la diffusion de documents scientifiques de niveau recherche, publiés ou non, émanant des établissements d’enseignement et de recherche français ou étrangers, des laboratoires publics ou privés.
Unlocking anionic redox activity in O3-type sodium 3d
layered oxides via Li substitution
Qing Wang, Sathiya Mariyappan, Gwenaëlle Rousse, Anatolii Morozov,
Benjamin Porcheron, Rémi Dedryvère, Jinpeng Wu, Wanli Yang, Leiting
Zhang, Mohamed Chakir, et al.
To cite this version:
Qing Wang, Sathiya Mariyappan, Gwenaëlle Rousse, Anatolii Morozov, Benjamin Porcheron, et al.. Unlocking anionic redox activity in O3-type sodium 3d layered oxides via Li substitution. Nature Ma-terials, Nature Publishing Group, 2021, 20, pp.353-361. �10.1038/s41563-020-00870-8�. �hal-03126950�
1
Unlocking anionic redox activity in O3-type sodium 3d layered oxides via Li
1substitution
2Qing Wang1,2,3, Sathiya Mariyappan1,4, Gwenaëlle Rousse1,2,4, Anatoly V. Morozov5, 3
Benjamin Porcheron6, Rémi Dedryvère4,7, Jinpeng Wu8, Wanli Yang8, Leiting Zhang9, 4
Mohamed Chakir3, Maxim Avdeev10,11, Michaël Deschamps6, Young-Sang Yu8, Jordi 5
Cabana12, Marie-Liesse Doublet4,13, Artem M. Abakumov5, and Jean-Marie Tarascon1,2,4,* 6
7
1
Chimie du Solide-Energie, UMR 8260, Collège de France, 75231 Paris Cedex 05, France
8
2
Sorbonne Université, 4 Place Jussieu, 75005, Paris, France
9
3
Renault, Technocentre, 1 avenue du Golf, 78288 Guyancourt, France
10
4 Réseau sur le Stockage Electrochimique de l’Energie (RS2E), FR CNRS 3459, France
11
5Center for Energy Science and Technology, Skolkovo Institute of Science and Technology, Nobel str.
12
3, 143026 Moscow, Russia
13
6CNRS, CEMHTI UPR3079, Université d’Orléans, 1D avenue de la recherche scientifique,
14
45071 Orléans Cedex 2, France
15
7
IPREM-UMR 5254 CNRS, Université de Pau et des Pays de l’Adour, Hélioparc, 2 Avenue Pierre
16
Angot, 64053 Pau Cedex 9, France
17
8
Advanced Light Source, Lawrence Berkeley National Laboratory, One Cyclotron Road, Berkeley, CA
18
94720, USA
19
9
Electrochemistry Laboratory, Paul Scherrer Institute, Forschungsstrasse 111, 5232, Villigen PSI,
20
Switzerland
21
10School of Chemistry, The University of Sydney, Sydney, NSW 2006, Australia
22
11Australian Centre for Neuron Scattering, Australian Nuclear Science and Technology Organisation,
23
Locked Bag 2001, Kirrawee DC, NSW 2232, Australia
24
12
University of Illinois at Chicago, Department of Chemistry, Chicago Illinois 60607, United States
25
13
ICGM, Univ. Montpellier, CNRS, ENSCM, Montpellier, France.
26
.
27
*Corresponding author: [email protected] 28
Keywords: Na-ion batteries, O3-type layered oxide, water-stable, anionic redox, cation 29
migration 30
Abstract 31
Sodium ion batteries, because of their sustainability attributes, could be an attractive 32
alternative to Li-ion technology for specific applications. However, it remains challenging to 33
design high energy density and moisture stable Na-based positive electrodes by implementing 34
the anionic redox process that has recently boosted the capacity of Li-rich layered oxides. 35
Here, we report the first anionic-redox active O3-NaLi1/3Mn2/3O2 phase obtained through a
36
ceramic process by carefully controlling the delicate balance between synthesis conditions 37
and stoichiometry. It shows a sustained reversible capacity of 190 mAh g−1 by redox 38
processes on oxygen and manganese ions as deduced by combined HAXPES and mRIXS 39
spectroscopy techniques. Remarkably, unlike any other anionic-redox layered oxides so far 40
2
reported, O3-NaLi1/3Mn2/3O2 electrodes do not show voltage fade upon cycling. This finding
1
is due to switching from the interlayer to intralayer migration of the Mn cations promoted by 2
Li+ displacement towards the alkali layer upon first Na+ de-insertion. Another practical asset 3
of this material stems from its moisture stability, hence facilitating its handling and electrode 4
processing. Besides providing insightful fundamental findings pertaining to anion redox, this 5
work offers future directions towards designing high energy density electrodes for advanced 6
Na-ion batteries. 7
Introduction 8
Rechargeable lithium ion batteries have empowered the success of consumer devices, and are 9
continuing to conquer the market of electric vehicles.1 Despite the foreseeable dominance of 10
Li-ion technology within the near future, there is a rising demand for cost-effective and more 11
sustainable cathode materials for large-scale energy storage. The Na-ion technology, the 12
working principle of which mimics Li-ion batteries, offers an alternative to fill this gap, 13
provided improvements are made in terms of energy density.2,3 Inspired by the discovery of
14
anionic redox in Li-rich oxides with subsequent increase in the material capacity,4–6 great
15
efforts have been devoted to the design of Na-rich layered oxides (Na(NayM1−y)O2, 0 < y < 1,
16
M = transition metal cation(s)). Commonly, anionic redox in layered oxides is triggered by 17
the introduction of alkali metals into the MO2- layer that generates oxygen lone pairs
18
associated with oxygen non-bonding 2p-states in the electronic structure.7,8 However, 19
implementing this strategy to Na layered oxides is not simple owing to the size mismatch 20
between NaO6 and MO6 octahedra. Hence, Na-rich layered oxides with the O3-type structure
21
were successfully prepared with either larger and more covalent 4d and/or 5d metals (Ru, Ir, 22
etc.).9–13 But with 3d metals, anionic redox is solely reported with non-stoichiometric P2/P3-23
type NaxAyM1-yO2 (0 < x < 1, y < 1) phases where the non-bonding O 2p orbitals are made
24
available by increasing the O/M ratio compared to LiMO2 using Li+ / Mg2+ / Zn2+ or
25
vacancies as the A cation instead of Na+.14–20 However, practical wise P2/P3 phases fall short 26
in achieving high energy density target, because of their Na deficiency.21 Hence, the standing 27
challenge resides in the synthesis of anionic-redox active sodium layered oxides consisting of 28
3d transition metals while having full sodium stoichiometry (Na(A,M)O2 with Na/(A,M) = 1).
29
Several attempts to increase the Na content have invariably led to anionic redox 30
inactive O3-type structures which are thermodynamically favored against the P2 structure 31
when Na/(A,M) ratio approaches 1.22 This failure is most probably due to synthesis
32
difficulties in achieving the proper targeted composition.23–25 Combining the proper Li
3
content to trigger anionic redox with full Na occupancy has even been predicted by DFT and 1
confirmed experimentally since the authors synthesized P2-Na0.75Li0.25Mn0.75O2 and not
2
NaLi1/3Mn2/3O2 as they wished .26
3
Following our early study on stabilizing the NaLi1/3Ir2/3O2 phase,27 we herein explore the
4
delicate Na-Li composition balance in the NaLiyMn1−yO2 phase to stabilize anionic-redox
5
active O3 structure with full Na content and successfully synthesized a new NaLi1/3Mn2/3O2
6
phase. It delivers an abnormally high first charge capacity of ~ 250 mAh g−1 with reversible 7
capacity of ~190 mAh g−1 while showing neither voltage fade nor reactivity against moisture, 8
both of which are serious assets practical-wise. 9
Identifying structure and composition of NaLi1/3Mn2/3O2
10
A survey of various key parameters (Li/Mn ratio, nature of precursors, annealing temperature, 11
flushing gases) was conducted and the results are cumulated in Supplementary Fig. 1−3 with 12
the optimized synthesis condition explained in experimental section. Single phase was solely 13
obtained for the composition NaLi1/3Mn2/3O2 by heating a ball-milled mixture of Na2O2, Li2O,
14
and Mn2O3 at 700 °C in a tubular furnace, where the tube was flushed with argon before
15
calcination. The X-ray powder diffraction (XRD) pattern of the as-synthesized material was 16
fitted in an O3-type structure with minute amounts of an impurity phase (Supporting Fig. 1 17
and 4). Interestingly, by soaking the sample into distilled water, the impurity phase was 18
washed away while leaving the O3 phase intact, hence indicating its stability against moisture 19
(Supplementary Fig. 4 and 5). This water-washed material with a Na0.97Li0.32Mn0.68O2
20
composition deduced from inductively coupled plasma (ICP) analysis was further used for all 21
studies and hereafter referred to as “Na1Li1/3Mn2/3O2” for simplicity purpose.
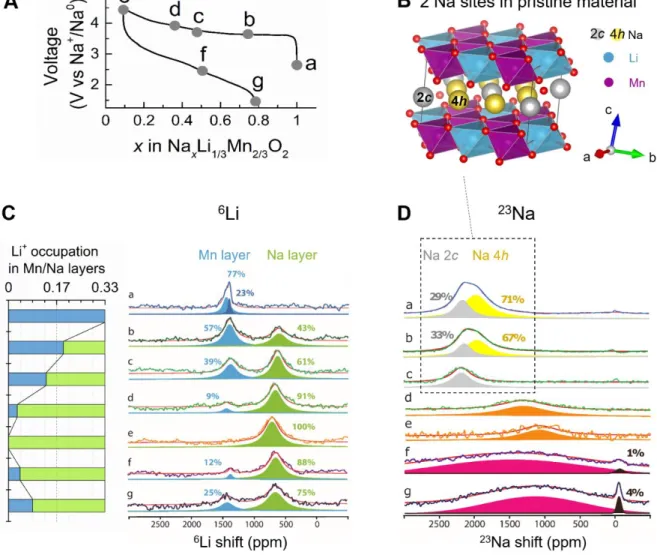
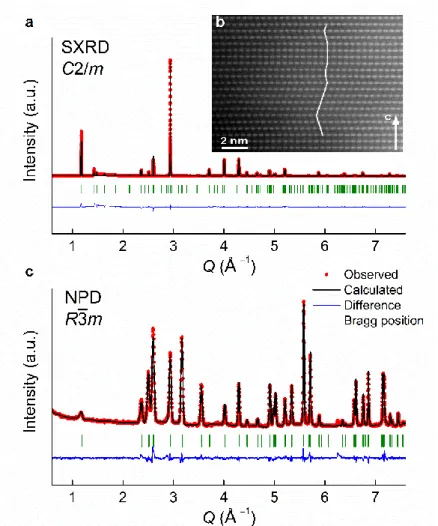
22
Figure 1a shows the synchrotron XRD (SXRD) pattern of the water-washed material. It can 23
be refined using two models, both suitable for describing an O3 structure: either in the R3̅m 24
space group with the lattice parameters a = 2.92441(1) Å, c = 15.96473(9) Å (Supplementary 25
Fig. 6, Supplementary Table 1), or in the C2/m space group with a = 5.05911(5) Å, b = 26
8.77505(6) Å, c = 5.58491(5) Å, and β = 107.6217(5)° (Fig. 1a, Supplementary Table 2). The 27
latter indexes the superstructure reflections between 5−10° 2 (Supplementary Fig. 6) that 28
were not taken into account using the R3̅ m space group and allows to describe the 29
[Li1/3Mn2/3]O2 honeycomb-ordered layers. In this model, Na is distributed in the interlayer
30
space on two Wyckoff sites, 2c and 4h. The superstructure reflections shows asymmetric 31
broadening and reduced intensities that arise from copious stacking faults as we deduced from 32
simulated X-ray diffraction patterns (Supplementary Fig. 7), with these faults propagating 33
4
along the c axis,9,11 as evidenced by [1̅10] HAADF-STEM image (Fig. 1b) and corresponding 1
SAED pattern (Supplementary Fig. 7). Both SXRD and STEM support the structure model 2
where Na takes up octahedral sites in between the [Li1/3Mn2/3]O2 slabs while Li and Mn form
3
a “honeycomb” ordering within the [Li1/3Mn2/3]O2 slabs. Lastly the neutron powder
4
diffraction (NPD) was also collected for the pristine phase (Fig.1c, Supplementary Table 3) 5
and alike XRD it is consistent with the target composition as deduced by the Rietveld 6
refinement. 7
8
Fig. 1 Structure of the water-washed pristine material. a, Rietveld refinement of the 9
SXRD pattern in C2/m space group (O3-type) of NaLi1/3Mn2/3O2 after being washed in H2O.
10
The red dots, black, and blue lines and green tick bars represent the observed, calculated, 11
difference patterns and Bragg positions, respectively. b, [1̅10] HAADF-STEM image of 12
pristine NaLi1/3Mn2/3O2 (indexes refer to the R3̅m cell). The periodicity along the stacking
13
direction of the “honeycomb” Li1/3Mn2/3O2 layers is frequently violated by stacking faults
14
appearing as lateral shifts of the layers (traced with the white line). c, Rietveld refinement of 15
the NPD pattern of H2O-washed NaLi1/3Mn2/3O2 sample. The R3̅m space group was chosen
16
instead of C2/m to fit the neutron pattern due to the bare visibility of superstructure peaks 17
from the [Li1/3Mn2/3]O2 honeycomb ordering. As the coherent neutron scattering lengths for
18
Mn and Li differ only by a factor of 2 (b (Mn) = −0.37 fm versus b (Li) = −0.19 fm) as 19
compared to a factor of 8 for XRD (Z (Mn) = 25 versus Z (Li) = 3), superstructure peaks 20
5
associated with the honeycomb ordering are barely visible in the NPD pattern than in XRD, 1
and even more attenuated in presence of stacking faults. 2
Electrochemical properties of NaLi1/3Mn2/3O2
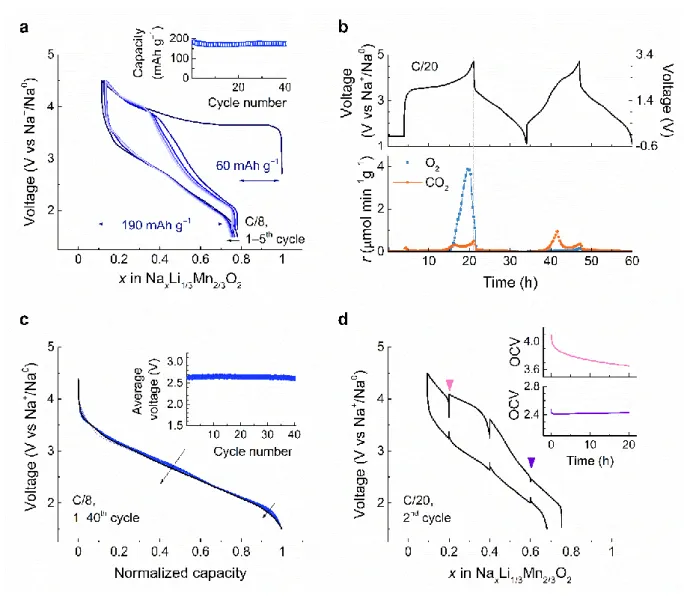
3
The electrochemical properties of NaLi1/3Mn2/3O2 were examined versus metallic Na within
4
the voltage range of 1.5−4.5 V at the rate of C/8 (1C = 285 mAh g−1) in Swagelok-type cells
5
(Fig. 2). Upon oxidation, the voltage rapidly reaches a plateau at around 3.6 V followed by a 6
sloping region to reach the “Na0.09Li1/3Mn2/3O2” composition at 4.5 V. The subsequent
7
discharge profile evolves into a nearly S-shape curve, which persists upon repeated cycles, 8
indicating an electrochemically driven structural transformation during the first charge. Out of 9
0.9 Na+ that can be removed during the first charge, solely 0.67 Na+ is reinserted on the 10
following discharge without any loss of Li from the structure as deduced from inductively 11
coupled plasma-optical emission spectrometry (ICP-OES) measurements performed on the 12
fully charged and discharged samples (Supplementary Fig. 8). This leads to a reversible 13
capacity of ~190 mAh g‒1which is stable upon continuous cycling, retaining 90% of the initial 14
capacity after 40 cycles (Fig. 2a, inset). Similar behavior with charge activation and S-shaped 15
curve evolution is usually observed for numerous anionic redox compounds28 which 16
occasionally show O2 release. To check this possibility, we carried out pressure test and
17
online electrochemical mass spectrometry (OEMS) (Fig. 2b, Supplementary Fig. 9). Both 18
techniques confirm gas release in the first charge which is predominantly O2 with the onset at
19
~0.58 Na+ removal (ca. 3.8 V vs. Na+/Na0) as shown by OEMS data in Fig. 2b. For precise
20
quantification, the OEMS analyses were carried out using Na3V2(PO4)3 (NVP) as counter
21
electrode instead of sodium metal which itself generates gases by reactions with the 22
electrolyte. Correspondingly, the amount of O2 release in the first cycle equals to 757.4 μmol
23
g−1 (equivalent to 80 mAh g-1 charge capacity, Fig. 2b), yielding the material composition
24
Na~0.09Li1/3Mn2/3O1.86 at the end of charge, whereas almost no O2 release (less than 1%) is
25
observed in the second charge. This irreversible O2 release explains part of the first cycle
26
irreversible capacity, and is likely rooted in the number of hole per oxygen (hO) generated 27
upon charge since this parameter was recently proposed as a good indicator of the 28
reversibility of the anionic process. 8 Lastly, the CO2 evolution observed through both cycles,
29
as already being noticed with other layered oxides, is most likely linked with the 30
decomposition of residual carbonates29 on the material surface and/or from the oxidative 31
decomposition of the electrolyte.30 Through parallel measurements (Supplementary Fig.9)31 32
we could conclude that the occurrence of CO2 through the second cycling is likely associated
6
with the presence of H+ generated by electrolyte decomposition as previously reported32, 1
which cannot be reduced using an NVP anode as opposed to a hard carbon or Na anode. 2
Altogether, the cycling profile and the O2 gas release in the first cycle are reminiscent of
Li-3
rich layered oxide. However, a striking difference emerges with the neatly superposition of 4
the discharge curves upon cycling (Fig. 2c). This indicates the absence of noticeable voltage 5
fade in NaLi1/3Mn2/3O2 that we further confirmed by plotting the average discharge voltage
6
for the first 40 cycles that remains constant (Fig. 2c, inset). Interestingly, such a feature is not 7
mirrored in charge, which shows a gradual evolution in the shape of the charge curve on 8
repeated cycling (Supplementary Fig. 10). 9
10
Figure 2 Electrochemical behavior of NaLi1/3Mn2/3O2. a, Voltage profile of first five galvanostatic
11
cycles (dark to light blue) of NaLi1/3Mn2/3O2 against metallic sodium at C/8 rate between 1.5−4.5 V. 12
Inset shows the capacity retention over 40 cycles. b, OEMS gas analysis during the first and second 13
cycles of NaLi1/3Mn2/3O2 cycled versus Na3V2(PO4)3 between −0.5−3.1 V (right axis), which is 14
converted to 1.2−4.7 V vs Na+/Na0 (left axis) as presented in the upper panel. Gas evolution rates 15
(μmol.min−1.g−1) were monitored for O2 (m/z = 32) and CO2 (m/z = 44) as shown in the bottom panel 16
and the amount of O2 release in the first cycle equals to 757.4 μmol g−1 (equivalent to 80 mAh g−1 17
7
charge capacity). c, Normalized discharge curves of the NaLi1/3Mn2/3O2/Na half cell data shown in Fig. 1
2a for 40 cycles. Inset shows the average discharge voltage calculated by dividing the specific energy 2
by capacity omitting the iR drop upon cycling. d, GITT measurements conducted on the second cycle 3
at a current rate of C/20, with a 20-hour relaxation period for every 4 hours (0.2 Na+ exchange). Inset 4
shows OCV evolution during 20 hours’ relaxation at weakly and highly charged states. 5
To understand the asymmetric behavior between charge/discharge, we followed the variation 6
of equilibrium potential process by galvanostatic intermittent titration technique (GITT). The 7
GITT voltage profile for the second cycle (Fig. 2d) shows a large voltage gap (300 ~ 500 mV) 8
between OCVs at charge vs. discharge despite very long rest periods of 20 hours. This 9
suggests that the hysteresis is of thermodynamic nature. The comparison between the GITT 10
measurements and a cell cycling at C/50 rate (Supplementary Fig. 11) also suggests slow 11
equilibration dynamics. To better understand the hysteresis, we progressively opened the
12
charge window with each cycle by increasing the upper cut-off voltage (Supplementary Fig. 13
12). Charge profiles are identical but discharge profiles drop gradually upon reaching the high 14
voltage redox process (> 3.3 V) with simultaneous rapid growth of the overpotential, 15
therefore pointing that the hysteresis is triggered towards the last 50% of charge. Moreover, 16
the magnification of the voltage relation profile for weakly and highly charged states (arrows 17
in Fig.2d) shows two different time of equilibrium. The voltage of the highly charged state 18
(top insert in Fig.2d) did not fully relax even for rest period close to one day, hence indicating 19
a process with a large time constant. This contrasts with the small time constant observed for 20
the low voltage charge state (bottom insert in Fig.2d) and equally for various discharge 21
voltage states. 22
The origin of such a difference was explored experimentally through operando XRD 23
on NaLi1/3Mn2/3O2/Na half cell. The cell was cycled at a C/20 rate and XRD patterns were
24
collected for every change in sodium stoichiometry of 0.05 (Supplementary Fig. 13). Our data 25
reveal several electrochemically driven biphasic and solid solution regions. Initially, a 26
biphasic process is observed with the appearance of a new phase O3 (II) having an increased c 27
lattice parameter (~5.64 Å) compared to the pristine O3 (I) phase (~5.58 Å). Further pursuing 28
the desodiation leads to a narrow solid solution through which the c lattice parameter initially 29
contracts prior to decrease rapidly, once the O2 evolution potential is reached, leading to the
30
O3(III) phase at the very end of charge. An in-depth exploration of the crystal structure 31
evolution in different states of charge and discharge was undertaken using synchrotron XRD 32
(Fig. 3). Rietveld refinements (Supplementary Table 4−5) show that all patterns (middle, end 33
of charge and discharge) can be indexed with O3 (R3̅m) structures that solely differ in lattice 34
parameters while containing copious amount of micro-strain. Note that we did not use the 35
8
C2/m space group to refine the patterns, because the [Li1/3Mn2/3]O2 honeycomb superstructure
1
reflections are barely visible and no splitting resulting from a monoclinic distortion is 2
observed. We therefore conclude that the O3-P3 phase transition, very frequently reported 3
upon removal of Na+ in O3 sodium layered oxide is not observed with NaLi1/3Mn2/3O2. This
4
suggests the absence of Na-vacancy ordering in Na1−xLi1/3Mn2/3O2 that is usually proposed as
5
the origin of the O3-P3 phase transition22 in Na-based layered oxides. 6
Turning to oxygen deficiency, two models with and without oxygen vacancies (as 7
deduced by OEMS) were tried for the fully charged Na0.09Li1/3Mn2/3O2 sample but both giving
8
refinements of comparable quality preventing reliable assignment (Supplementary Fig.14). In 9
contrast, models having Mn placed in either octahedral or tetrahedral sites within the Na 10
interlayer spaces deteriorate the refinement with respect to the one having Mn solely located 11
in the transition metal layers (Supplementary Fig.15), hence suggesting the absence of 12
manganese migration to the alkali layer. This was confirmed by refining the NPD pattern 13
collected for the fully charged sample of which the best fit was obtained with Mn in the metal 14
layers together with all the Li and remaining Na atoms being in the alkali layers so that the 15
resulting chemical formula can be written as [Na0.09Li1/3]interlayer[(cat)1/3Mn2/3]metalO1.86 (Fig.3d,
16
Supplementary Table 6). Lastly, it is of paramount importance to note, that the peaks in
17
SXRD corresponding to the honeycomb superstructure largely reduce in intensity through the 18
first charge and discharge processes. Such disappearance of superstructure peaks can be either 19
associated with the collapse of the honeycomb ordering due to metal ion migration within the 20
metal layers or with an increased amount of stacking faults that reduce the long range 21
ordering. 22
9 1
Fig. 3 Structural evolution in the first cycle. a, (left) SXRD patterns of pristine (blue), ex 2
situ samples stopped at mid-charge (green), end of charge (orange) and end of discharge (purple) of
3
the initial cycle. Zoomed view of superstructure peaks (marked by asterisks) together with the ex 4
situ points on the electrochemistry curve are illustrated on the right. b, c, Rietveld refinement of the
5
SXRD patterns of the fully charged and fully discharged samples, respectively. All the SXRD were 6
indexed in R3̅m space group (O3 structure) having the lattice parameters, a = 2.92441(1) Å, c = 7
15.96473(9) Å, V = 118.241(1) Å3 for pristine; a = 2.86135(6) Å, c = 16.067(1) Å, V = 113.922(9) 8
Å3 as the major phase for the mid-charged Na
0.45Li1/3Mn2/3O2; a =2.85957(3) Å, c = 14.4371(4) 9
Å, V = 102.238(3) Å3 for the fully charged Na
0.09Li1/3Mn2/3O1.86; and a =2.90226(2) Å, c = 15.3823(6) 10
Å, V =112.208(4) Å3 for the fully discharged Na
0.78Li1/3Mn2/3O1.86. d, Rietveld refinement of the NPD 11
pattern of the fully charged sample in R3̅m space group (O3 structure) with a = 2.83307(7) Å and c = 12
14.005(2) Å, V =97.35(1) Å3. The oxygen content was fixed to 1.86 per formula unit, and different 13
structural models were tested that differ in the Mn, Li and Na distribution in the metal layer and/or 14
10
interlayer sites. The best fit was obtained with Mn in the metal layers, and interlayers accommodating 1
all Li atoms and remaining Na, so that the resulting chemical formula can be written as 2
[Li1/3Na0.09]interlayer[(cat)1/3Mn2/3]metalO1.86 (see Supplementary Table 6 for more details). 3
High angle annular dark field scanning transmission electron microscopy (HAADF-4
STEM) was next used to grasp further insights into local structure of NaLi1/3Mn2/3O2 upon
5
Na+ removal and uptake. Our data confirms the presence of O3-type layered structure for the 6
pristine sample that is maintained in the samples charged to 4.5 V and discharged to 1.5 V, as 7
evidenced by the [010] SAED patterns in Fig. 4. The [010] HAADF-STEM images also 8
confirm the O3-type stacking demonstrating the lateral displacement of the [Li1/3Mn2/3]O2
9
layers by 1/3 of the distance between two neighboring dots denoting the Mn columns (Fig. 4). 10
No additional intensity was observed between the [Li1/3Mn2/3]O2 layers in the HAADF
11
intensity profiles (except of very faint dots of the Na columns barely visible at the thicker part 12
of the pristine NaLi1/3Mn2/3O2 crystallite (Fig. 4a, left)) that agrees well with the absence of
13
Mn migration to the Na sites in the charged 4.5 V and discharged to 1.5 V states, as deduced 14
from SXRD. After charge and discharge for 10 cycles, the O3 structure remained 15
(Supplementary Fig.16). The reflections in the SAED patterns are very broad and streaked 16
with diffuse intensity along the c* axis, which is not surprising given the enormous 17
anisotropic broadening observed from SXRD (Supplementary Fig.17). HAADF-STEM 18
images show that the reflection broadening and diffuse intensity originate from pronounced 19
local structure distortions, where the [Li1/3Mn2/3]O2 layers become wavy, demonstrating
20
strong local variations of the interlayer distance. The HAADF-STEM images of the sample 21
after 10 cycles show that Mn migration to the interlayer space occurs only at the top surface 22
areas, and not in the more bulky parts. Another feature is the significant suppression of the 23
honeycomb ordering visible in both SAED pattern and the HAADF-STEM image 24
(Supplementary Fig.16). Overall, combined SXRD and TEM results unambiguously confirm 25
the absence of out-of-plane Mn migration in NaLi1/3Mn2/3O2 with therefore signs of in-plane
26
migration increasing with cycling. 27
11 1
Fig. 4. Structural analysis by microscopy. [010] HAADF-STEM images and corresponding HAADF 2
intensity profiles across the [Li1/3Mn2/3]O2 layers in the outlined rectangular areas for (a) pristine, (b) 3
charged to 4.5 V and (c) discharged to 1.5 V NaLi1/3Mn2/3O2. Corresponding [010] SAED patterns are 4
given in the insets; the patterns are indexed as the O3 R3̅m phase. The peaks in the HAADF intensity 5
profiles correspond to the Mn columns solely at the [Li1/3Mn2/3]O2 layers, whereas absence of the 6
intensity between the peaks indicates no Mn migration into the Na layers. 7
In absence of Li+ loss from the structure, as deduced from ICP-OES, a legitimate
8
question regards its structural role through the Na (de)insertion process. To evaluate its 9
impact, both 6Li and 23Na Nuclear Magnetic Resonance (NMR) spectra were recorded on Na
1-10
xLi1/3Mn2/3O2 at various states of charge and discharge (Fig. 5). Both 6Li (Fig.5C) and 23Na
11
(Fig.5D) spectra show two signals for the pristine material with in each case a nearly 1 to 2 12
balance. The doublet for Na is consistent with the C2/m structure having two different sites 13
(2c and 4h) for Na+ (Fig. 5B). The large shift to ~1400 ppm in the 6Li Lorentzian line is 14
indicative of the presence of lithium in transition metal [Li1/3Mn2/3]O2 layer33. Moreover, the 15
two slightly different environments causing two lines at 1400 and 1450 ppm most likely arise 16
from the difference in Li position due to the frequent violation of periodicity along the 17
stacking direction of the honeycomb TM layers (see Fig.1b, Supplementary Fig.7). Upon 18
charging, this signal (blue) progressively disappears to the expense of a new one (green) with 19
a significantly different chemical shift centered around ~700 ppm that becomes unique for the 20
fully charged sample. In light of previous studies, this new signal is assigned to Li+ ions 21
12
sitting in octahedral coordination within the alkali metal layers,34,35 in full agreement with the 1
NPD data (Fig.3d, Supplementary Table 6). An additional feature is the partial irreversibility 2
of this Li-site migration upon discharge since the peak at 700 ppm remains large (75% of the 3
total) for the fully discharged sample (spectrum g in Fig. 5C). The irreversible migration of 4
lithium is likely responsible for the wavy nature of the [Li1/3Mn2/3]O2 layers and the strong
5
local variations of the interlayer distances observed by HAADF-STEM. Lastly, the integration 6
of the 6Li signal through the process remains constant further confirming that no Li is lost (as 7
seen from ICP-OES measurements in Supplementary Fig. 8) and all 6Li spins are detected by 8
NMR. This is in contrast to previous studies, where a similar behavior of lithium was 9
observed but lithium loss could not be prevented.36,37 10
The 23Na NMR spectra upon charging first show the progressive disappearance of the 11
1980 ppm shift (yellow) to the benefit of the 2170 ppm one (grey) implying that the Na+ ions
12
are initially removed from the 4h position. This signal becomes unique, showing an almost 13
single Na environment after removal of 0.55 Na+ corresponding to the 2c positions (spectrum
14
c in Fig. 5D), indicative of a reorganization of Na sub-lattice associated to the early Li 15
displacement. Afterwards, there is a dramatic change in the sodium environment and the 16
signal is now shifted to lower chemical shifts (1300 ppm) and much broadened (800 ppm vs 17
250-500 ppm), signifying an increase in the local disorder around the remaining sodium ions, 18
which amount to nearly ~ 0.09 Na per formula unit in the fully charged sample. The origin of 19
such disorder is most likely linked to the onset of O2 release, which starts between points c
20
and d in Fig.5A according to the OEMS measurement. Moreover, the existence of a very 21
broad peak is also compatible with the slow Na+ dynamics which prevents the averaging of 22
the shift, and may explain the hysteresis observed in GITT measurements at high potential. 23
Upon discharge, the initial signals are not recovered since the reinsertion of Na+ leads to a 24
very broad (> 1300 ppm) Gaussian distribution of environments, indicative of the persistence 25
of a massive structural disorder resulting from a broader distribution of Na-O-Mn angles 26
which govern the NMR shifts37. Note that the 23Na NMR spectrum for a subsequently 27
recharged sample (Supplementary Fig.18) shows a broad line, centered at a lower shift of 910 28
ppm, but with a width of 650 ppm that is solely half as wide as at the end of the first charge, 29
indicating that, somehow, some local order is restored during the second cycle. 30
Consistently, similar broad 23Na NMR signals were previously reported for the fully
31
NaxNi0.5Mn0.5O2 phase with disordered Na occupation.38 Thus, this scenario could in fact
32
explain the difference in cycling curve between first charge-discharge and also the absence 33
13
O3 to P3 phase transition (operando XRD in Supplementary Fig.13) since the irreversibly 1
migrated lithium may arrest the long range zig-zag ordering of Na and vacancy which is 2
required to stabilize the P3 phase22. 3
Altogether, NMR results show that upon Na+ removal, Na1−xLi1/3Mn2/3O2 undergoes a
4
partially irreversible migration of Li+ to the Na layers that creates cation vacancies and 5
disorder within the [Li1/3Mn2/3]O2 layers. Due to such an intense modification of the structure,
6
some of the Na+ cannot any longer fully return to their initial sites as some of them are 7
irreversibly occupied by 0.25 lithium ions per unit formula (explaining the irreversible loss of 8
0.23 Na during the first charge/discharge cycle). Therefore, they will occupy sites having 9
changed coordination, explaining the broadened spectra. 10
11
Fig. 5 6Li and 23Na MAS NMR spectroscopy results. A, First-cycle charge-discharge voltage profile
12
with points indicating states of charge/ discharge at which the ex situ samples were extracted. B, 13
Crystal structure of the pristine NaLi1/3Mn2/3O2 (space group C2/m) showing two Wyckoff sites (2c 14
and 4h) for Na+. C, 6Li MAS NMR spectra showing two types of peaks corresponding to the isotropic 15
shifts for Li in the [Li1/3Mn2/3]O2 layers (blue) and alkali layers (green). Li+ population in both 16
14
environments are compared in stacked bar chart on the left as guide to the eye. D, 23Na MAS NMR 1
results showing peak shifts and broadening. The two Na+ signals in the pristine material can be 2
understood by the two distinct crystal sites shown in figure panel B (see text). The two sharp peaks at 3
nearly 0 ppm in f and g are due to trace amounts of remaining Na salt from the electrolyte that left 4
unwashed. 5
Next we interrogate the nature of the electrochemically driven redox processes and 6
their interplay with local structural changes in Na1−xLi1/3Mn2/3O2. Complementary operando
7
X-ray Absorption (XAS), ex situ Hard X-ray Photoelectron Spectroscopy (HAXPES) and 8
mapping of Resonant Inelastic X-ray Scattering (mRIXS) were used to probe the sample at 9
various depths (particles are of > 0.5 m size as seen by SEM, Supplementary Fig. 19). 10
During the first charge (Fig. 6, a−c) all the techniques show features related solely to oxygen 11
oxidation. The O1s HAXPES spectra (Fig. 6a, Supplementary Fig. 20, 21, left) of the pristine 12
and fully charged samples differ by the appearance of a new peak at binding energy (BE) of 13
530.5 eV for the fully oxidized sample that corresponds, in light of previous reports,39 to 14
oxidized lattice oxygen On− (n < 2). This oxygen activity is unambiguously confirmed by the 15
appearance of a new feature in mRIXS (outlined by an ellipse in Fig. 6b), at an excitation and 16
emission energy of 531.0 eV and 523.7 eV, respectively, that is characteristic of On− species.40 17
This feature disappears and reappears on subsequent charge-discharge confirming the 18
reversibility of the anionic redox process (Supplementary Fig. 22). Turning to the outcome of 19
Mn4+ during the first oxidation process, Mn2p HAXPES (Supplementary Fig. 20, 21, right),
20
Mn L3 mRIXS (Supplementary Fig. 23, 24), ex situ and operando XAS on Mn K edge
21
(Supplementary Fig. 25, 26) indicate that Mn4+ is redox inactive on first charge since there is 22
no evolution in the Mn oxidation state in neither of the techniques between pristine and fully 23
charged sample. 24
15 1
Fig.6 Charge compensation mechanism in NaLi1/3Mn2/3O2. a, ex situ HAXPES (hυ = 6900 eV) O1s
2
spectra of pristine (P) and charged to 4.5 V samples (1C). b, ex situ O K-edge mRIXS spectra of 3
pristine (P) and sample charged to 4.5 V (1C). Red arrows and circles at 531.0 eV excitation energy 4
and 523.7 eV emission energy indicate the oxidized oxygen feature at charged state. c, Mn K-edge 5
XANES spectra of pristine (blue solid) and sample charged to 4.5 V (orange solid), compared to 6
references of Mn4+ (purple dashed) and Mn3+ (cyan dotted). d, Concentration of Mn3+ species derived 7
from ex situ HAXPES, mRIXS and XAS in the 1st, 2nd, and 10th discharged 1.5 V samples. e, First 8
cycle charge-discharge curve with points indicating the state of charge/ discharge at which ex situ 9
samples for magnetic measurements were extracted from. f, Effective magnetic moment deduced from 10
magnetic susceptibility measurements. P, MC, 1C, MD and 1D represents pristine, mid-charge, first 11
charge, mid-discharge and first discharge samples, respectively. Dashed lines indicate theoretical 12
values of spin-only effective magnetic moments of Mn at different oxidation states and spin states. 13
On discharge, all the techniques converge in showing conjointly a nearly reversible 14
oxygen redox process together with a varying degree of reduction from Mn4+ to Mn3+ 15
(Supplementary Fig. 20−26). However, they show discrepancies in quantifying the amount of 16
Mn3+ (Fig. 6d). For instance, HAXPES, which is mainly a surface technique (~30 nm in 17
depth), indicates nearly 60% of Mn3+ in the fully discharged sample as opposed to solely ~30 % 18
with mRIXS, which has a probe depth of ~150 nm, compared to a total thickness of the 19
cathode of ~40 m. 20
A comprehensive view of the electrode ensemble can be acquired from XAS 21
measurements at the Mn K-edge, which was collected in transmission geometry. Despite the 22
clear trend of Mn reduction as the edge shift to lower energies in discharge (Supplementary 23
Fig. 25, 26), quantification via linear combination fits of references, as performed for Mn L3
16
mRIXS, was not possible because the position and shape of the Mn spectra at K-edge heavily 1
depend on both formal oxidation state and coordination environment of Mn.41 To account for 2
variations in line shape introduced by changes in coordination environment, the spectra were 3
analyzed following the integration method proposed by Dau et al.42 Such approach rendered 4
an approximate average oxidation state of ~3.6+ for the discharged (1D) sample 5
(Supplementary Fig. 25b), consistent with the quantification from Mn L3 mRIXS
6
(Supplementary Fig. 24, Figure 6d). It is worth noting that we found the linear fit in this 7
method is still rather sensitive to the choice of reference spectra, leading to a larger 8
uncertainty than with other methods. The difference between HAXPES and the mRIXS and 9
XAS results could be ascribed to differentiated surface reactivity worth exploring in future 10
work, but, in all, it is clear that partial reduction of Mn4+ into Mn3+ occurred during the first 11
discharge, reminiscent to the behavior of the parent Li2MnO3.43 However, the degree of Mn
12
reduction was lower than expected from the measured capacities, pointing to complex charge 13
compensation. Lastly, independent of the spectroscopy employed, the changes in Mn spectra 14
were reproduced upon extensive cycling, proving that Mn redox couple was activated after 15
the first charge (Supplementary Fig. 21, 24, 25). 16
Alternatively, ex situ magnetic susceptibility measurements from 2 to 400 K carried out on 17
the samples at various states of charge and discharge (Fig. 6e) (Supplementary Fig. 27, 18
Supplementary Table 7) confirm the presence of Mn4+ with a magnetic moment close to the 19
expected value in the pristine material (eff ~3.7μB vs. 3.9, Fig6f) and displaying a
valley-20
like variation upon cycling Such a mirror variation in charge/charge is surprising 21
considering that the partial reduction of Mn4+→ Mn3+ should lead to an increase of
eff. Given
22
the significant amount of Mn3+ determined by spectroscopy, the small increase of eff in the
23
discharge sample compared to the pristine one (3.79 vs. 3.7 ) strongly suggests charge 24
transfer between Mn and O during oxidation. This indirectly supports the participation of 25
anions in the redox activity of NaLi1/3Mn2/3O2, as corroborated by our recent theoretical
26
calculations on Na2/3[Mg1/3Mn2/3]244 showing that the coupling unpaired electrons on both Mn
27
and O the decreases the total magnetization of the cell. However, it is beyond the scope of this 28
paper to quantitatively decouple the Mn from the O contribution for eff values, whose
29
robustness is ensured by having duplicated twice our measurements on different samples. 30
Overall, we report a novel anionic redox active O3 NaLi1/3Mn2/3O2 layered phase vs. Na
31
showing no voltage fade and oxygen redox not associated with 3d metal migration to the 32
alkali layer, unlike most Li-rich layered oxides. Moreover, it turns out that NaLi1/3Mn2/3O2 is
17
an ideal model compound to clarify the key role of the alkali metal in Li(Na)-rich layered 1
oxides with respect to both voltage fade and 3d cation migration owing to its versatility to 2
intercalate Na and Li as shown next. A nearly Na-free electrode, Na0.09Li1/3Mn2/3O1.86, was
3
recovered and washed from a NaLi1/3Mn2/3O2/Na Swagelok cell that was fully charged to 4.5
4
V, prior to be used in a new Swagelok with Li metal as a negative electrode and 1M LiPF6 in
5
EC-DMC (v/v = 50/50, LP30) as electrolyte. The voltage profile for the Na0.09Li1/3Mn2/3O2/Li
6
cell (Fig. 7a) shows the reversible uptake of 0.4 Li+ per formula unit together with good 7
capacity retention upon cycling, yet accompanied by large voltage decay. From combined 8
coulombic titration and ICP analysis, the chemical composition of the fully discharged sample 9
was identified as Na0.09Li0.73Mn2/3O2.
10
Evidence for Mn migration upon Li insertion in this material was obtained by TEM. The [010] 11
HAADF-STEM images and corresponding HAADF intensity profiles across the 12
[Li1/3Mn2/3]O2 layers are reported after one (Fig. 7c) and ten (Fig. 7d) charge-discharge cycles
13
in Li-ion half cells. The outlined rectangular areas reveal the Mn cation migrations that are 14
enhanced with cycling. The peaks in the HAADF intensity profiles (bottom) correspond to 15
the Mn columns at the [Li1/3Mn2/3]O2 layers, whereas the intensity between the peaks (marked
16
with black arrowheads) indicates the migration of the Mn cations into the interlayer space. 17
Note that the Mn migration is more pronounced in the sample after 10 cycles which indicates 18
only partially irreversible character of this migration. This drastically contrasts with similar 19
images taken on the material cycled vs. Na in Na-based electrolytes where no Mn migration 20
towards the alkali layer can be spotted. 21
18 1
Fig. 7 Voltage fade and cation migration in Li half cells. a, First five cycles of voltage-composition 2
profiles of the desodiated Na0.09Li1/3Mn2/3O1.86 cycled in Li half cells with LP30 electrolyte. b, 3
normalized discharge curves of the same cell for 40 cycles with dQ/dV of selected cycles, showing the 4
evolution of low voltage redox process and voltage fade upon cycling in the Li cell. The actual 5
discharge profile before normalization is given in Supplementary Fig. 28. [010] HAADF-STEM 6
images and corresponding HAADF intensity profiles show increasing cation migration from the c, 1st 7
discharged to d, 10th discharged sample in the Li cell. 8
Discussion 9
Altogether, the electrochemical activity of Na (Li) in the alkali-rich NaLi1/3Mn2/3O2 phase
10
provides valuable information for clarifying the complex interplay between anionic redox, 11
cationic migration, voltage hysteresis and voltage fade in layered 3d transition metal oxides. It 12
now pertains to confront these findings with existing literature data to move one-step forward 13
in the general understanding of the anionic redox mechanism. 14
Among the Na-based anionic redox active layered compounds so far reported, O3-15
NaLi1/3Mn2/3O2 is the one that shows the lowest oxygen redox potential (~3.6 V vs Na+/Na).
16
To rationalize this finding DFT calculations were performed on the C2/m structural model of 17
multiple variations of partially charged O3-NaxLi1/3Mn2/3O2 structures with the Li+/Na+
18
cations distributed over three crystallographic positions 2b (Mn layer) and 4h, 2c (alkali layer). 19
Up to the removal of 1/3 Na+, all O3 configurations with partial or total Li migration to the
20
alkali layer, namely Li(M+A) or Li(A) are significantly destabilized against those having Li 21
19
in the Mn layer, namely Li(M). This energy penalty for Li migration to the alkali layer is 1
removed upon further Na+ extraction as Li(M+A) and Li(A) configurations become as stable 2
or more stable than Li(M) configurations at Na concentration xNa = 1/3 and 1/6, respectively.
3
(Supplementary Table 8). Remarkably, the Mn4+ (0.54 Å) migration to the alkali layer is 4
energetically prevented due to a significant destabilization of the MnO6 octahedron that would
5
display much too long Mn-O bonds when sitting in the alkali layer (2.2 Å) compared to the 6
metallic layer (1.9 Å). This thermodynamic preference for Li migration is likely related to the 7
well-known interlayer electrostatic instability of layered oxides at low alkali-content and is 8
here activated once the Na/Li concentration ratio reaches 1 in Nax(Li1/3Mn2/3)O2. This ratio
9
therefore sets the critical Na concentration below which Li rather than Na should dominate 10
the crystallographic features of the O3 phase. Accordingly, Li migration at xNa ≤ 1/3 comes
11
along with a significant contraction of the c lattice parameter, which obviously affects the 12
kinetics of Na+ diffusion for further de-sodiation. Altogether, these results allow reconciling 13
the XRD, NMR and electrochemical data and help in rationalizing the role of Na on the 14
stabilization of the O3 phase. 15
Upon Na removal, a biphasic process occurs between xNa = 1 and xNa ~2/3 for which the
16
computed average potential (3.5 V) is in fair agreement with experiments (Supplementary 17
Table 8). The end-member Na2/3[Li1/3Mn2/3]O2 phase of this biphasic process displays an
18
increased c lattice parameter compared to the pristine phase, fully consistent with the O3(II) 19
phase identified by operando XRD (Supplementary Fig.13) at the very beginning of charge. 20
Removing more sodium from the structure leads to Na1/3[Li1/3Mn2/3]O2 or Na1/6[Li1/3Mn2/3]O2
21
phases having Li in the alkali layer and contracted c lattice parameters, consistent with the 22
less chemically shifted 6Li NMR signal observed in Fig.5C and the crystallographic features
23
of O3(II) just before the onset of O2 release (Supplementary Table 8). Interestingly, further
24
Na+ removal from the Li-migrated O3(II) phase (Supplementary Fig.13) should be kinetically 25
hindered by the size-constrained alkali interlayer, hence leading to the voltage polarization 26
observed in the galvanostatic curve of Fig.2 along the second process. We believe this kinetic 27
limitation of Na-ion diffusion in the structure most likely prevents the Na-ordering required 28
for the O3 to P3 transition. Moreover, it is at this stage of the Na removal process, when 29
nearly all Li has moved to the alkali layers (as deduced from 6Li NMR) that O2 release is
30
triggered. This observation is not fortuitous since Li migration to the alkali layer implies that 31
some oxygen atoms become less electrostatically bonded to the structural network due to 32
cationic vacancies in their local environment and therefore more prone to oxidation. 33
20
Noteworthy, the presence of Li vacancies in the metallic layer may also favor Mn/Livac
1
disorder in the metallic layer, as observed in the synchrotron XRD and TEM data. While no 2
evidence of ribbon ordering14 was found in the XRD patterns of the charged sample, the 3
Mn/Livac disorder is predicted to be thermodynamically achievable at low Na content (xNa =
4
1/6) which should prevent Li+ ions from moving back to the metallic layer in discharge 5
(Supplementary Table 9). Obviously, towards the very end of charge (xNa < 1/6), the phases
6
determined by DFT calculations without considering O2 release may no longer be
7
representative of the experimental ones. Therefore, a thorough analysis of O-defective phases 8
that enlists, besides O- and Na-vacancies, the migration of Mn within the metallic layer, 9
would be required to get more insights into the impact of these structural modifications on 10
further cycling. 11
Another intriguing question regards whether the O2 release leads to oxygen vacancies or
12
material densification, which has so far been associated solely to the migration of the 13
transition metal cations into the alkali metal layers in the Li-rich layered oxides. In 14
NaLi1/3Mn2/3O2 such interlayer migration can safely be excluded based on the XRD and TEM
15
structure analysis. First-principles DFT calculations confirm this point by showing that Mn 16
migration from the metallic to the alkali layer is thermodynamically less favored (by at least 17
200-300 meV/Mn, Supplementary Table 9) when the alkali layer contains Na compared to Li, 18
even at low sodium content. This suggests that the presence of Na+ ions in the alkali layer, 19
even in small amount, imposes much too large interlayer spacing (large c parameter) to 20
stabilize Mn4+ in the octahedral site. Moreover, we could also compute with DFT the 21
variation of the c parameter from the fully sodiated Na[Li1/3Mn2/3]O2 phase to the desodiated
22
Na0.125[Li1/3Mn2/3]O2 one which nicely follows the experimental data reported from XRD
23
analysis in Fig.3a only when Li migration is considered in the partially desodiated 24
Na1/3[Li1/3Mn2/3]O2 phase (Supplementary Table 8). In contrast, the c-parameter for pure-Li
25
phases is systematically smaller by at least 1.5 Å, which again confirms the greater ability of 26
Li-based phases to stabilize the Mn cations in the interlayer space. Interestingly, O3-27
Na0.09Li1/3Mn2/3O2 on Li-insertion behaves similarly to the pure Li-phases, as Li+ occupies
28
positions in both alkali and metallic layers. 29
Consequently, we could hastily eliminate the densification hypothesis prior to realizing that 30
Mn migration within the metal layers could be an alternative way to trigger densification. The 31
complete migration of Li+ cations from the [Li
1/3Mn2/3]O2 layer to the alkali layer on the first
32
charge leaves cationic vacancies (cat), and, taking into account oxygen release at high voltage,
21
the chemical formula for the fully charged state can be represented as 1
Na0.09Li1/3[(cat)1/3Mn2/3]O1.86 Realization of oxygen deficiency through anion vacancies should 2
lower the coordination number of Mn below six, but Mn K-edge XANES spectra and EXAFS 3
reveal octahedral Mn coordination at all states of charge. Thus the oxygen vacancies must be 4
eliminated by migration from bulk to the surface with subsequent annihilation and the 5
increasing Mn/O ratio is accommodated by intralayer Mn4+ cation migration to vacant cation 6
sites cat. The chemical formula at full charge can be recast as Na0.09Li0.36[(cat)0.28Mn0.72]O2.
7
Disrupting the 1:2 (cat):Mn ratio should suppress the honeycomb cation ordering and
8
promote stochastic arrangement of Mn4+ and cation vacancies in the densified 9
[(cat)0.28Mn0.72]O2 layers, as indicated by vanishing intensity of the honeycomb superlattice
10
reflections in the SXRD patterns (Fig. 3a) and confirmed by DFT calculations 11
(Supplementary Table 9) 12
Our study also showed that discharging of the O3-Na0.09Li1/3Mn2/3O1.86 material either in
Na-13
ion or in Li-ion cells promote intralayer and interlayer cation migration, respectively, 14
therefore comforting the robustness of the interplay between cationic migration and voltage 15
fade early proposed.45 The O3-NaLi1/3Mn2/3O2 phase exemplifies very clearly that if the
16
densification after first oxygen release occurs through the intralayer transition metal cation 17
migration, the material demonstrates virtually no voltage fade, whereas switching to the 18
interlayer migration mode (e.g., cycling vs. Li+/Li0) readily introduces voltage fade. Therefore, 19
a new way to mitigate voltage fade could consist in promoting the intralayer migration of 20
transition metal by controlling, via chemical composition, the structural location of vacancies 21
formed by alkali cation de-insertion with respect to the onset of oxygen release. The benefit 22
associated to the absence of voltage fade for O3-NaLi1/3Mn2/3O2 is however tarnished by the
23
fact that the Na uptake-removal in this phasecomes with a large voltage hysteresis. Numerous 24
explanations enlisting either reformation/breaking of O-O dimers46, cationic-anionic redox 25
inversion induced by small charge-transfer bandgap47 or sluggish structural rearrangements48 26
have so far been proposed to account for such hysteresis with the most favored one being 27
interlayer transition metal migration during the first oxidation.49–51 We could hypothesize that 28
the hysteresis observed in O3-NaLi1/3Mn2/3O2 is also due to intralayer Mn migration, but
29
further in depth investigation is needed. If true, the voltage hysteresis might appear as 30
unavoidable consequence of the O2 loss at the first “activation” charge to high voltage, which
31
is also responsible for most of the irreversibility obtained during the first cycle. 32
22
To conclude, we have reported the Na-rich NaLi1/3Mn2/3O2 phase having an O3-type structure
1
and showing highly reversible de-insertion/ insertion of ~0.7 Na via combined cationic and 2
anionic redox processes. At a fundamental level, with this material we could consolidate the 3
established link between cation migration and voltage fade, demonstrating that the voltage 4
fade can be arrested by switching migration of the transition metal to an intralayer mode 5
through displacement the Li+ cations from the [Li1/3Mn2/3]O2 layers to the alkali layers on the
6
first charge. At a practical level, O3-NaLi1/3Mn2/3O2 offers positive attributes such as a
7
reversible capacity of 190 mAh g−1 associated with a good capacity retention and no 8
discernable voltage fade while showing robust water stability, which is rare for stoichiometric 9
Na-based layered compounds representing a serious asset for the future applications. 10
Therefore, as the remaining voltage hysteresis in this material still stands as a roadblock, we 11
are trying to solve via the injection of a robust ordering scheme within the transition metal 12
layer. We hope these findings pave the way towards the design of novel moisture stable 13
anionic redox active O3-type Na phases having large capacity and minimized voltage fade 14
and hysteresis for the next generation of advanced Na-ion batteries. 15
Acknowledgements 16
Q.W. thanks Renault S.A.S for PhD funding. J.-M.T. acknowledges the funding from 17
European Research Council (ERC) (FP/2014)/ERC Grant-Project 670116-ARPEMA. A.M.A 18
and A.V.M are grateful to Russian Science Foundation for the financial support (grant 20-43-19
01012). Access to the TEM facilities has been granted by Advance Imaging Core Facility of 20
Skoltech. We thank the ROCK beamline at SOLEIL (Gif-sur-Yvette, France) for X-ray 21
spectroscopy experiments (financed by the French National Research Agency (ANR) as a part 22
of the “Investissements d'Avenir” program, reference: ANR-10-EQPX-45; proposal 23
#20171234 and #20190596). HAXPES measurements were performed at GALAXIES 24
beamline at SOLEIL Synchrotron, France under proposal #20171035 and #20190646. This 25
work used resources of the Advanced Photon Source (11-BM), a U.S. Department of Energy 26
(DOE) Office of Science User Facility operated for the DOE Office of Science by Argonne 27
National Laboratory under Contract No. DE-AC02-06CH11357. NPD measurements were 28
performed using the ECHIDNA instrument at ANSTO (Sydney, Australia). The authors are 29
grateful to A. Iadecola for the help during XAS measurements. The authors thank C. 30
Masquelier, S. Trabesinger, D. Giaume, M.F. Lagadec, W. Yin, A. Perez, B. Li, G. Yan, G. 31
Assat and J. Vergnet for fruitful discussions. The authors acknowledge the staff of the MPBT 32
(physical properties – low temperature) platform of Sorbonne Université for their support. 33
23 Author contributions
1
Q.W, S.M. and J.-M.T. conceived the idea and designed the experiments. M.D. and B.P. 2
performed NMR measurements. J.C./Y.-S.Y., R.D. and J.W./W.Y. performed and interpreted 3
the XANES/EXAFS, HXAPES and mRIXS measurements. M.A. collected the NPD data, 4
G.R. analyzed and interpreted the SXRD and NPD patterns and performed the magnetic 5
measurements while A.V. M and A. A collected and interpreted all the microscopy data. 6
Lastly, L. Z. performed the OEMS measurements and M.C. supervised the project. M-L.D 7
performed the theoretical calculations and contributed to the overall interpretation of the 8
results. J.-M.T, A.A, S.M and Q.W. wrote the paper, with contributions from all authors. 9
Competing interests 10
The authors declare no competing interest. The material O3-Na(Li1/3Mn2/3)O2 is patented with
11
patent application number B19-5233FR. 12
References 13
1. Tarascon, J. M. The Li-Ion Battery: 25 Years of Exciting and Enriching Experiences. 14
Electrochem. Soc. Interface 25, 79–83 (2016).
15
2. Yabuuchi, N., Kubota, K., Dahbi, M. & Komaba, S. Research Development on Sodium-16
Ion Batteries. Chemical Reviews 114, 11636–11682 (2014). 17
3. Hwang, J.-Y., Myung, S.-T. & Sun, Y.-K. Sodium-ion batteries: present and future. 18
Chemical Society Reviews 46, 3529–3614 (2017).
19
4. Rozier, P. & Tarascon, J. M. Review—Li-Rich Layered Oxide Cathodes for Next-20
Generation Li-Ion Batteries: Chances and Challenges. J. Electrochem. Soc. 162, A2490– 21
A2499 (2015). 22
5. Lu, Z. & Dahn, J. R. Understanding the Anomalous Capacity of Li / Li [ Ni x Li ( 1 / 3 − 23
2x / 3 ) Mn ( 2 / 3 − x / 3 ) ] O 2 Cells Using In Situ X-Ray Diffraction and 24
Electrochemical Studies. J. Electrochem. Soc. 149, A815–A822 (2002). 25
6. M. Thackeray, M., S. Johnson, C., T. Vaughey, J., Li, N. & A. Hackney, S. Advances in 26
manganese- oxide ‘composite’ electrodes for lithium-ion batteries. Journal of Materials 27
Chemistry 15, 2257–2267 (2005).
28
7. Xie, Y., Saubanère, M. & Doublet, M.-L. Requirements for reversible extra-capacity in 29
Li-rich layered oxides for Li-ion batteries. Energy Environ. Sci. 10, 266–274 (2017). 30
8. Ben Yahia, M., Vergnet, J., Saubanère, M. & Doublet, M.-L. Unified picture of anionic 31
redox in Li/Na-ion batteries. Nature Materials 18, 496–502 (2019). 32
24
9. Rozier, P. et al. Anionic redox chemistry in Na-rich Na2Ru1−ySnyO3 positive electrode 1
material for Na-ion batteries. Electrochemistry Communications 53, 29–32 (2015). 2
10. Assadi, M. H. N., Okubo, M., Yamada, A. & Tateyama, Y. Oxygen Redox Promoted by 3
Na Excess and Covalency in Hexagonal and Monoclinic Na2−xRuO3 Polymorphs. J. 4
Electrochem. Soc. 166, A5343–A5348 (2019).
5
11. Mortemard de Boisse, B. et al. Intermediate honeycomb ordering to trigger oxygen redox 6
chemistry in layered battery electrode. Nature Communications 7, 11397 (2016). 7
12. Perez, A. J. et al. Strong Oxygen Participation in the Redox Governing the Structural and 8
Electrochemical Properties of Na-Rich Layered Oxide Na2IrO3. Chem. Mater. 28, 8278– 9
8288 (2016). 10
13. Zhang, X. et al. Manganese-Based Na-Rich Materials Boost Anionic Redox in High-11
Performance Layered Cathodes for Sodium-Ion Batteries. Advanced Materials 31, 12
1807770 (2019). 13
14. House, R. A. et al. Superstructure control of first-cycle voltage hysteresis in O-redox 14
cathodes. Nature 577, 502–508 (2020). 15
15. Maitra, U. et al. Oxygen redox chemistry without excess alkali-metal ions in 16
Na2/3[Mg0.28Mn0.72]O2. Nature Chemistry 10, 288–295 (2018). 17
16. Du, K. et al. Exploring reversible oxidation of oxygen in a manganese oxide. Energy 18
Environ. Sci. 9, 2575–2577 (2016).
19
17. Rong, X. et al. Anionic Redox Reaction-Induced High-Capacity and Low-Strain Cathode 20
with Suppressed Phase Transition. Joule 3, 503–517 (2019). 21
18. Bai, X. et al. Anionic Redox Activity in a Newly Zn-Doped Sodium Layered Oxide P2-22
Na2/3Mn1−yZnyO2 (0 < y < 0.23). Advanced Energy Materials 8, 1802379 (2018). 23
19. Bai, X., Iadecola, A., Tarascon, J.-M. & Rozier, P. Decoupling the effect of vacancies and 24
electropositive cations on the anionic redox processes in Na based P2-type layered oxides. 25
Energy Storage Materials (2020) doi:10.1016/j.ensm.2020.05.032.
26
20. Ma, C. et al. Exploring Oxygen Activity in the High Energy P2-Type 27
Na0.78Ni0.23Mn0.69O2 Cathode Material for Na-Ion Batteries. J. Am. Chem. Soc. 139, 28
4835–4845 (2017). 29
21. Mariyappan, S., Wang, Q. & Tarascon, J. M. Will Sodium Layered Oxides Ever Be 30
Competitive for Sodium Ion Battery Applications? J. Electrochem. Soc. 165, A3714– 31
A3722 (2018). 32
22. Vinckevičiu̅ tė, J., Radin, M. D. & Van der Ven, A. Stacking-Sequence Changes and Na 33
Ordering in Layered Intercalation Materials. Chem. Mater. 28, 8640–8650 (2016). 34
25
23. Xu, J., Liu, H. & Meng, Y. S. Exploring Li substituted O3-structured layered oxides 1
NaLixNi1/3−xMn1/3+xCo1/3−xO2 (x = 0.07, 0.13, and 0.2) as promising cathode 2
materials for rechargeable Na batteries. Electrochemistry Communications 60, 13–16 3
(2015). 4
24. Zheng, S. et al. Exploring the working mechanism of Li + in O3-type NaLi 0.1 Ni 0.35 Mn
5
0.55 O 2 cathode materials for rechargeable Na-ion batteries. Journal of Materials
6
Chemistry A 4, 9054–9062 (2016).
7
25. Kim, D. et al. Enabling Sodium Batteries Using Lithium-Substituted Sodium Layered 8
Transition Metal Oxide Cathodes. Advanced Energy Materials 1, 333–336 (2011). 9
26. Kim, D., Cho, M. & Cho, K. Rational Design of Na(Li 1/3 Mn 2/3 )O 2 Operated by
10
Anionic Redox Reactions for Advanced Sodium-Ion Batteries. Adv. Mater. 29, 1701788 11
(2017). 12
27. Perez, A. J., Rousse, G. & Tarascon, J.-M. Structural Instability Driven by Li/Na 13
Competition in Na(Li1/3Ir2/3)O2 Cathode Material for Li-Ion and Na-Ion Batteries. Inorg. 14
Chem. 58, 15644–15651 (2019).
15
28. Assat, G., Delacourt, C., Corte, D. A. D. & Tarascon, J.-M. Editors’ Choice—Practical 16
Assessment of Anionic Redox in Li-Rich Layered Oxide Cathodes: A Mixed Blessing for 17
High Energy Li-Ion Batteries. J. Electrochem. Soc. 163, A2965–A2976 (2016). 18
29. de la Llave, E. et al. Improving Energy Density and Structural Stability of Manganese 19
Oxide Cathodes for Na-Ion Batteries by Structural Lithium Substitution. Chem. Mater. 28, 20
9064–9076 (2016). 21
30. House, R. A. et al. What Triggers Oxygen Loss in Oxygen Redox Cathode Materials? 22
Chemistry of Materials 31, 3293–3300 (2019).
23
31. Guéguen, A. et al. Decomposition of LiPF 6 in High Energy Lithium-Ion Batteries
24
Studied with Online Electrochemical Mass Spectrometry. J. Electrochem. Soc. 163, 25
A1095–A1100 (2016). 26
32. Freiberg, A. T. S., Sicklinger, J., Solchenbach, S. & Gasteiger, H. A. Li2CO3 27
decomposition in Li-ion batteries induced by the electrochemical oxidation of the 28
electrolyte and of electrolyte impurities. Electrochimica Acta 346, 136271 (2020). 29
33. Grey, C. P. & Lee, Y. J. Lithium MAS NMR studies of cathode materials for lithium-ion 30
batteries. Solid State Sciences 5, 883–894 (2003). 31
34. Lee, Y. J. & Grey, C. P. Determining the Lithium Local Environments in the Lithium 32
Manganates LiZn0.5Mn1.5O4 and Li2MnO3 by Analysis of the 6Li MAS NMR Spinning 33
Sideband Manifolds. J. Phys. Chem. B 106, 3576–3582 (2002). 34

![Fig. 4. Structural analysis by microscopy. [010] HAADF-STEM images and corresponding HAADF 2](https://thumb-eu.123doks.com/thumbv2/123doknet/14527679.532828/12.892.116.788.103.557/structural-analysis-microscopy-haadf-stem-images-corresponding-haadf.webp)