HAL Id: inserm-00663705
https://www.hal.inserm.fr/inserm-00663705
Submitted on 27 Jan 2012
HAL is a multi-disciplinary open access
archive for the deposit and dissemination of
sci-entific research documents, whether they are
pub-lished or not. The documents may come from
teaching and research institutions in France or
abroad, or from public or private research centers.
L’archive ouverte pluridisciplinaire HAL, est
destinée au dépôt et à la diffusion de documents
scientifiques de niveau recherche, publiés ou non,
émanant des établissements d’enseignement et de
recherche français ou étrangers, des laboratoires
publics ou privés.
up-regulation of mitochondrial gene expression.
Jeff Klomp, David Petillo, Natalie Niemi, Karl Dykema, Jindong Chen,
Ximing Yang, Annika Sääf, Peter Zickert, Markus Aly, Ulf Bergerheim, et al.
To cite this version:
Jeff Klomp, David Petillo, Natalie Niemi, Karl Dykema, Jindong Chen, et al.. Birt-Hogg-Dubé renal
tumors are genetically distinct from other renal neoplasias and are associated with up-regulation
of mitochondrial gene expression.. BMC Medical Genomics, BioMed Central, 2010, 3 (1), pp.59.
�10.1186/1755-8794-3-59�. �inserm-00663705�
R E S E A R C H A R T I C L E
Open Access
Birt-Hogg-Dubé renal tumors are genetically
distinct from other renal neoplasias and are
associated with up-regulation of mitochondrial
gene expression
Jeff A Klomp
1, David Petillo
2, Natalie M Niemi
3, Karl J Dykema
1, Jindong Chen
2, Ximing J Yang
4, Annika Sääf
5,
Peter Zickert
6, Markus Aly
7, Ulf Bergerheim
8, Magnus Nordenskjöld
5, Sophie Gad
9, Sophie Giraud
10,11,
Yves Denoux
12, Laurent Yonneau
13, Arnaud Méjean
11,14, Viorel Vasiliu
11,15, Stéphane Richard
9, Jeffrey P MacKeigan
3,
Bin T Teh
2,16, Kyle A Furge
1,2*Abstract
Background: Germline mutations in the folliculin (FLCN) gene are associated with the development of Birt-Hogg-Dubé syndrome (BHDS), a disease characterized by papular skin lesions, a high occurrence of spontaneous pneumothorax, and the development of renal neoplasias. The majority of renal tumors that arise in BHDS-affected individuals are histologically similar to sporadic chromophobe renal cell carcinoma (RCC) and sporadic renal oncocytoma. However, most sporadic tumors lack FLCN mutations and the extent to which the BHDS-derived renal tumors share genetic defects associated with the sporadic tumors has not been well studied.
Methods: BHDS individuals were identified symptomatically and FLCN mutations were confirmed by DNA sequencing. Comparative gene expression profiling analyses were carried out on renal tumors isolated from individuals afflicted with BHDS and a panel of sporadic renal tumors of different subtypes using discriminate and clustering approaches. qRT-PCR was used to confirm selected results of the gene expression analyses. We further analyzed differentially expressed genes using gene set enrichment analysis and pathway analysis approaches. Pathway analysis results were confirmed by generation of independent pathway signatures and application to additional datasets.
Results: Renal tumors isolated from individuals with BHDS showed distinct gene expression and cytogenetic characteristics from sporadic renal oncocytoma and chromophobe RCC. The most prominent molecular feature of BHDS-derived kidney tumors was high expression of mitochondria-and oxidative phosphorylation (OXPHOS)-associated genes. This mitochondria expression phenotype was (OXPHOS)-associated with deregulation of the PGC-1a-TFAM signaling axis. Loss of FLCN expression across various tumor types is also associated with increased nuclear mitochondrial gene expression.
Conclusions: Our results support a genetic distinction between BHDS-associated tumors and other renal neoplasias. In addition, deregulation of the PGC-1a-TFAM signaling axis is most pronounced in renal tumors that harbor FLCN mutations and in tumors from other organs that have relatively low expression of FLCN. These results are consistent with the recently discovered interaction between FLCN and AMPK and support a model in which FLCN is a regulator of mitochondrial function.
* Correspondence: kyle.furge@vai.org
1
Laboratory of Computational Biology, Van Andel Research Institute, Grand Rapids, MI, USA
Full list of author information is available at the end of the article
© 2010 Klomp et al; licensee BioMed Central Ltd. This is an Open Access article distributed under the terms of the Creative Commons Attribution License (http://creativecommons.org/licenses/by/2.0), which permits unrestricted use, distribution, and reproduction in any medium, provided the original work is properly cited.
Background
Renal cell carcinomas (RCC) represent the most com-mon type of tumors that arise within the adult kidney. They can be divided into several subtypes - clear cell, papillary, chromophobe, and collecting duct - based on differences in cellular morphology, gene expression, and cytogenetic and genetic abnormalities that are found within the tumor cells [1-4]. The two most common types of RCC are clear cell and papillary, which together account for approximately 85-90% of RCCs. Chromo-phobe RCC accounts for an additional 5% of renal tumors, and a histologically similar subtype, renal onco-cytoma, represents another 5% (see [5,6] for recent reviews). Although the neoplastic cells of chromophobe RCC and renal oncocytoma share morphological fea-tures, renal oncocytomas are generally asymptomatic and nearly always present as localized lesions with low metastatic potential [7].
Though most renal tumors occur sporadically (~95%), several hereditary syndromes are associated with a high risk of renal tumor development. These syndromes include von Hippel-Lindau disease, hereditary papillary RCC, hereditary leiomyomatosis and renal cancer, and Birt-Hogg-Dubé syndrome (BHDS) [8]. In von Hippel-Lindau disease, a rare germline mutation in the VHL gene is associated with development of the disease (reviewed in [9]). Individuals with von Hippel-Lindau disease are predisposed to the development of renal tumors of the clear cell histology. In addition, somatic mutations in the VHL gene are also found in the major-ity of the sporadic cases of clear cell RCC [10]. Birt-Hogg-Dubé syndrome is an extremely rare syndrome-approximately 200 families have been described as having BHDS worldwide [11,12]. Germline inheritance of a mutated allele of the folliculin (FLCN) gene, located at chromosome location 17p11.2, is strongly associated with individuals that develop BHDS [13]. In individuals afflicted with BHDS, the majority (~85%) of renal tumors that develop are histologically similar to chro-mophobe RCC or described as oncocytic hybrid tumors, with portions appearing as both renal oncocytoma and chromophobe RCC [14,15]. Unlike VHL, somatic muta-tions in the FLCN gene are not strongly associated with the development of sporadic renal oncocytoma and chromophobe RCC [16,17]. As such, the role that FLCN plays in the development of sporadic renal oncocytoma, chromophobe RCC, and other sporadic tumors remains unclear.
The folliculin gene encodes a highly conserved, 64kD protein with no known functional domains. Recent reports support its role as a tumor suppressor [18,19] and in energy-related signaling, involving the mTOR and AMPK pathways [20-22]. FLCN has been shown to
interact with AMPK through the binding of two inter-mediary proteins, folliculin interacting protein 1 and fol-liculin interacting protein 2 (FNIP1/2) and the activity of FLCN may be altered by its subsequent phosphoryla-tion by AMPK or localizaphosphoryla-tion to the cytoplasm with its binding partners, or a combination of these two mechanism [20,23,24]. As indicated previously, while germline mutations in FLCN cause BHDS, these muta-tions are not strongly associated with either sporadic chromophobe RCC or renal oncocytoma [17]. The most well characterized somatic mutations found in these two sporadic tumor subtypes are mutations within the mito-chondrial genome [25-29]. Renal oncocytoma, in parti-cular, is characterized by the accumulation of somatic mutations in mtDNA that inactivate subunits of mito-chondrial complex I and other members of the electron transport chain, severely limiting ATP production [26,27]. In addition, both sporadic renal oncocytoma and chromophobe RCC possess mitochondria-dense cytoplasm and aberrant expression of genes associated with oxidative phosphorylation (OXPHOS) [25,27,30]. However, the mechanism by which these mitochondrial defects contribute to tumor development remains unclear and the gene expression and cellular phenotypes observed are thought to represent feedback mechanisms to compensate for mitochondrial impairment.
While expression of some key markers of renal tumors have been examined in a single BHDS-derived tumor [31], we conducted gene expression profiling of multiple renal tumors that arose in individuals with BHDS along with sporadic renal oncocytoma and chromophobe RCC to develop a better understanding of the underlying molecular genetics of these tumors. We found that tumors that arose in individuals with BHDS were geneti-cally distinct from sporadic tumors, showing distinct gene expression and cytogenetic characteristics. How-ever, similar to sporadic renal oncocytoma and chromo-phobe RCC, BHDS-derived renal tumors displayed high expression of mitochondria and OXPHOS-associated genes. Indeed, the expression of mitochondria and OXPHOS-associated genes was even more pronounced in the BHDS-derived tumors than the other sporadic tumors and was correlated to increased expression of key mitochondria transcriptional regulators. We have also noted an inverse correlation between FLCN expres-sion and mitochondria- and OXPHOS-associated genes across a variety of tumor types, most evident in tumors that possessed relatively low levels of FLCN and enrich-ment in mitochondria- and OXPHOS-associated gene expression. Taken together, our data suggest that FLCN has an important role in the regulation of genes asso-ciated with mitochondria and OXPHOS in BHDS-derived tumors and possibly others.
Methods
Tissue sample collection and DNA sequencing
Internal review board approval was obtained from each participating institution for the renal neoplasms under study. Samples isolated from individuals afflicted with BHDS were flash-frozen in liquid nitrogen and stored at -80°C following excision from patients as previously described [32]. FLCN mutation status was confirmed through DNA extraction from tumor samples and sequencing, as described previously [33], using primer sequences from Nickerson et al. [13]. The histological classification and FLCN mutation information for the BHDS-derived renal tumor samples are given in Addi-tional file 1 Table S1.
Gene expression profiling datasets
RNA was isolated and expression profiles generated from BHDS-derived tumor samples using the Affymetrix HG-U133 Plus 2.0™chipset as previously described [32]. These data are available at the Gene Expression Omnibus (GEO, GSE21816). Expression profiles for the remaining RCC subtypes and non-RCC tumors used in the analysis are publicly available from the GEO database (GSE8271, GSE11024, GSE11016, GSE7023, and GSE2109). All data analysis was performed using software available from the BioConductor Project (version 2.5) and the R statistical environment v. 2.10.1 [34,35]. Prior to analysis, the robust multi-chip average (RMA), as implemented in the Affy package (1.24.2), was used for background correc-tion and normalizacorrec-tion of raw expression image intensi-ties using updated probeset mapping [36] and data were normalized to corresponding normal tissue type. The technical replicate expression datasets from the DT017 sample of patient BHD1 were averaged prior to discrimi-nate gene and gene set analyses.
Validation of gene expression microarray data by qRT-PCR
Single-step, quantitative reverse transcription-PCR (qRT-PCR) was performed to validate expression levels for the following genes: PVALB, CDH19, RGS20, and LRRTM4, with the GAPDH gene as a control. To per-form the single-step qRT-PCR, we used the Power SYBR
®
Green PCR Master Mix with Taqman®
Gold RT-PCR enzymes (Applied Biosystems, Foster City, CA). We also conducted qRT-PCR using Taqman®
assays (Applied Biosystems) using the manufacturer’s protocol for the following genes: FLCN, FNIP2, PPARGC1A, PVALB, RGS20, TFAM, and TSC1. The reactions were run on an ABI 7500 Fast Real-Time PCR system using a dissociation curve analysis for the SYBR Green assays to confirm primer specificity. We used the PerlPrimer soft-ware [37] to design PCR primers within the exons thatwere interrogated by the Affymetrix expression chips. Primer sequences and assay ids have been made avail-able in Additional file 1 Tavail-able S4.
Clustering and differential gene expression
Prior to clustering of all RCC samples, the 1000 most variable genes were isolated using an interquartile range filter of greater than 1.54. Clustering was performed using Euclidean distance with complete linkage. For the clustering of sporadic chromophobe RCC, sporadic onco-cytoma, and BHDS-derived renal tumor samples, the 1500 most variable genes were isolated, corresponding to an interquartile range filter of greater than 0.79. Eucli-dean distance with average linkage was used, followed by resampling for node support. Bootstrap resampling for 10,000 replications and a relative sample size of 1 was used to generate the bootstrap probability values, as implemented in the pvclust package v.1.2-1 [38].
Discriminatory genes were identified using a moder-ated t-statistic as implemented in the limma package. Significance values were adjusted to correct for multiple testing using the Benjamini and Hochberg method [39]. Genes with false discovery rate (FDR) values less than 0.01 were reported as significant. Given that the sample size of BHDS-derived tumors was disproportionate to the number of either sporadic oncocytoma or chromo-phobe RCC tumors, we conducted a permutation test to decide whether the distinctiveness of BHDS-derived tumors was a result of bias from a sample size effect. The test was conducted using 1000 iterations comparing the entire data set from the six BHDS-derived tumors to five randomly selected oncocytoma data sets (without replacement). The number of significantly differentially expressed genes from this BHD-oncocytoma comparison was greater than the number derived from a similar dis-criminate analysis of five randomly selected oncocytoma data sets with the remaining six oncocytoma data sets in all of 1000 permutations. Likewise, a similar permuta-tion test using the six BHD and six randomly selected chromophobe RCC datasets was found to contain a greater number of differentially expressed genes than a comparison of six randomly chosen chromophobe with the remaining six chromophobe datasets in all of 1000 permutations.
Gene set enrichment analyses
Parametric gene set enrichment was used to identify chromosomal expression abnormalities using gene sets corresponding to chromosomal arms as implemented in the reb package [40]. For pathway analysis 1892 gene sets were obtained from the Molecular Signatures Data-base v2.5 (MsigDB, http://www.broadinstitute.org/gsea/ msigdb/). These gene sets were curated from multiple sources including online pathway databases, biomedical
literature, and mammalian microarray studies. Para-metric gene set enrichment analysis method as imple-mented in the PGSEA package was used generate enrichment scores for each pathway within each tumor sample using corresponding non-diseased kidney tissue as a reference. A moderated t-statistic as implemented in the limma package [41] was used to identify gene set enrichment scores that could discriminate between sub-types. In order to visualize the fraction of genes that overlapped between deregulated gene sets, we calculated pair-wise dissimilarity (D) scores using the formula:
D N N N A B A B = − + ⎛ + ⎝ ⎜ ⎞ ⎠ ⎟ ∩ 1 2 1 1 , where N
A∩B is the
num-ber of genes in common between gene sets A and B and NA and NBare the numbers of genes making up gene
sets A and B. The dissimilarity score was used to com-pute a hierarchical clustering dendrogram using Eucli-dean distance with average linkage.
PGC-1a signature generation
We produced a gene overexpression signature of PGC-1a using gene expression data obtained from the com-parison of PGC-1a transfected HepG2 cells to mock transfected cells (GSE5968). A moderated t-statistic was used to identify genes with expression differences that were both significant (FDR
Results
BHDS tumors have distinct gene expression patterns
Although BHDS is exceedingly rare, it is important to determine whether molecular analysis of BHDS-derived renal tumors could give insight into the development of sporadic chromophobe RCC and renal oncocytoma as well as the cellular role of FLCN-related signal transduc-tion. Therefore, we performed gene expression profiling on a set of renal tumors isolated from individuals afflicted with BHDS. We confirmed the presence of FLCN mutations in these tumors (Additional file 1 Table S1). To determine how the BHDS-derived renal tumors were related to other subtypes of renal cell car-cinomas, we used unsupervised hierarchical clustering with the most variable set of expressed genes (Figure 1A). Sporadic renal oncocytoma and chromophobe RCC have an overall distinct pattern of gene expression rela-tive to other RCC subtypes and consistent with the pre-viously described histological similarity, the expression characteristics of BHDS-derived tumors were more simi-lar to sporadic chromophobe and renal oncocytoma than the other RCC subtypes (Figure 1A). Sporadic renal oncocytoma and chromophobe RCC are thought to arise from cells that make up the distal convoluted tubule (DCT) portion of nephrons within the kidney [1]. To examine the tissue of origin of the BHDS-derived
tumors, we assessed the expression of the distal convo-luted tubule marker, PVALB [42]. This gene is expressed in sporadic renal oncocytoma and chromophobe RCC, but is absent or significantly lower in gene expression array data of clear cell and papillary tumors thought to derive from the proximal convoluted tubule and the urothelial/transitional cell carcinomas that arise from cells of the urinary tract (Figure 1C). Although not
CH BHD ON 100 96 96 100 100 Papillary RCC Clear cell RCC Normal BHD Oncocytoma Chromophobe RCC Urothelial/TCC
A
B
E
D
6 0 -6 LRRTM4 CDH19 DAPL1 HHATL 0 2 4 6 8 10 12 CDH19 BHD NO ON 0 5 10 15 20 PVALB BHD CC NO ON 0 1 2 3 4 BHD NO ON RGS20Log2 (fold change)
5 10 15 20 25 30 O N C H BH D N O C C PA P U R 0 R e la ti v e e x p re ssi o n RGS20 PVALB 33 ON20 BHD CH ON
C
R e la ti v e e x p re ssi o n R e la ti v e e x p re ssi o n R e la ti v e e x p re ssi o nFigure 1BHD tumors represent a distinct class of renal cell carcinoma. A) Hierarchical clustering of renal tumor samples (BHDS, N = 6; ON, N = 11; CH, N = 12; CC, N = 10; PAP, N = 22; UR, N = 10) and non-diseased renal tissue (N = 12) using the expression data from the 1000 most variable genes. B) Unsupervised clustering of BHD, ON, and CH tumor samples using gene expression data from the 1500 most variable genes within this group. Bootstrap probability values are given for the major nodes. C) Expression of the distal convoluted tubule marker parvalbumin, PVALB, in the RCC tumor sample data used in A. D) qRT-PCR validation of expression of PVALB, along with two identified genes with high BHDS tumor-specific expression, cadherin 19 (CDH19) and regulator of G-protein signaling 20 (RGS20). BHD, N = 2; CC, N = 3; NO, N = 3; ON, N = 3. E) Gene expression heatmap displaying expression values after median centering for the fifty genes most up-regulated in BHDS-derived tumors compared to sporadic chromophobe RCC and renal oncocytoma from A. Abbreviations: NO, normal; ON, renal oncocytoma; CH, chromophobe RCC; CC, clear cell RCC; PAP, papillary RCC; UR, urothelial/TCC RCC.
noted earlier, PVALB is highly expressed in the BHDS-derived tumors, supporting the notion that these tumors also arise from the distal convoluted tubule[31]. We further examined FLCN expression in BHDS-derived tumors as well as renal oncocytoma and chromophobe RCC. We did not find a significant difference in the FLCN transcript levels in these tumors by the gene expression array data nor by qRT-PCR of a subset of samples (Additional file 2, Figure S1A and data not shown).
In the initial gene expression analysis the BHDS-derived tumors formed a distinct branch in the cluster-ing diagram (Figures 1A, B). These gene expression differences were not due to a sample batch effect since these renal tumors were collected at multiple institu-tions and the gene expression profiles were generated at various times between 2004 through 2009 using multiple chip lots (Additional file 1, Table S1 and data not shown). A more focused examination of the DCT-derived tumors confirmed those from patients with BHDS possess distinct expression characteristics with strong node support as inferred by gene resampling (Figure 1B). Several genes were differentially expressed between BHDS-derived tumors and renal oncocytoma (n = 401) and BHDS-derived tumors and chromophobe RCC (n = 2922; FDR 1, Table S2). For comparison, we found 1050 differentially expressed genes between sporadic oncocytoma and chromophobe RCC. More-over, we saw few, if any, gene differences when we per-formed resampling with the discriminate analysis within either the sporadic renal oncocytoma or sporadic chro-mophobe samples, indicating the high numbers of dif-ferentially expressed genes between tumor subtypes were not due to differences in sample size between the tumor subtypes (p < 0.001, see Methods). The molecular distinction between BHDS-derived tumors, sporadic renal oncocytoma, and sporadic chromophobe RCC is in contrast to the similarities of VHL disease-associated tumors with sporadic clear cell RCC. In those studies, no significant differences in gene expression were identi-fied between the two entities [43]. Together, the gene expression analyses indicate that distinctions exist between BHDS-derived renal tumors and other RCC subtypes similar in magnitude to those between the other recognized subtypes of RCC, such as oncocytoma and chromophobe RCC. Notable genes that are more highly expressed in BHDS-derived tumors when com-pared to sporadic renal oncocytoma and chromophobe RCC include CDH19, RSG20, DAPL1, LRRTM4, and HHATL (Figure 1EAdditional file 2, Figure S2, and Additional file 1, Table S2). We validated the expression levels of PVALB and three of the most significantly over-expressed genes, CDH19 (cadherin 19, type 2), RGS20 (regulator of G-protein signaling 20), and
LRRTM4(leucine rich repeat transmembrane neuronal 4) using qRT-PCR (Figure 1DAdditional file 2, Figures S1B-C, and data not shown). We chose to validate these particular genes for their consistently high expression in BHD-derived tumor samples, their low expression in the other RCC subtypes examined.
BHDS-derived tumors lack evidence of cytogenetic features present in sporadic oncocytoma and chromophobe RCC tumors
Several studies have shown that is possible to detect both chromosomal translocations[44] and gains and losses of large chromosomal regions through examina-tion of gene expression data [45]. To identify potential chromosomal abnormalities that exist in BHDS samples, we examined the gene expression data for chromosome-based changes in gene expression that reflect cytoge-netic changes such as chromosomal amplifications or deletions [41,45]. As with previous cytogenetic studies, our analysis predicted losses of chromosomes 1, 2, 6, 10, and 17 in chromophobe RCC and, with the exception of chromosome 1, a lack of large chromosomal abnormal-ities in renal oncocytoma samples (Figure 2A) [46]. In addition, evidence of a recently described abnormality of chromosome 19 (chromosomal gains and somatically paired chromosomes) was also apparent in both chro-mophobe RCC and renal oncocytoma data [47]. Though we predicted one BHDS-derived tumor sample (BHD4, Additional file 1, Table S1) contains multiple abnormal-ities involving chromosomes 2, 3, 4, 5, 6, 13, and 18, a phenomenon that is sometimes observed in sporadic cases of renal oncocytoma [48], the tumor possessed histology typical of hybrid oncocytic-chromophobe BHDS-derived tumors (Additional file 2, Figures S3A-B). The BHDS-derived tumors appeared mostly devoid of chromosomal abnormalities that are typical of the sporadic tumors. Although the BHDS-derived tumors did not show loss of chromosome 17p as described in a cell line recently established from a renal cell carcinoma of a patient with BHDS [49], the resolution of this approach does not allow us to exclude the presence of small focal deletions. In addition, sporadic renal oncocy-tomas can be partitioned into two mutually exclusive groups based on cytogenetic features. One group of tumors possesses a loss of chromosome 1 and the other group of tumors has a translocation of chromosome 11q13 that has a breakpoint proximal to the cyclin D1 (CCND1) gene [50]. Consistent with this finding, we identified a subgroup of renal oncocytomas with high CCND1 expression (N = 6, Figures 2B, C) that were independent of renal oncocytomas with a predicted loss of chromosome 1 (Figure 2A). None of the BHDS-derived tumors show evidence of the CCND1 associated translocation of 11q13 or loss of chromosome 1. Taken
together, differences in the overall gene expression pro-files and differences in predicted chromosomal abnorm-alities suggest that BHDS-derived renal tumors represent a genetically distinct type of renal tumor.
A mitochondrial gene expression phenotype is a prominent feature of BHDS-derived tumors
The deregulation of signal transduction pathways have been identified through examining gene expression data of renal tumors in several cases, including the deregula-tion of VHL, MYC, PI3K, E2F, and OXPHOS in clear cell, papillary, transitional cell carcinoma of the renal
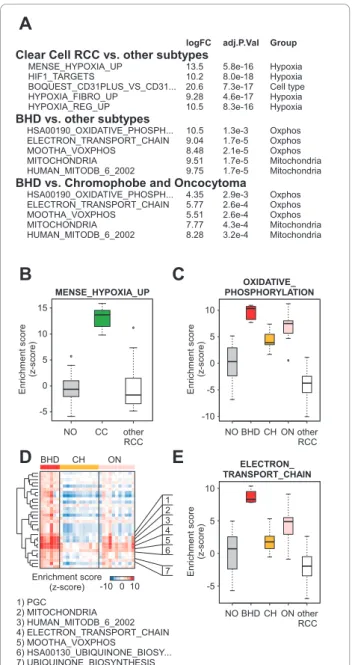
pelvis, Wilms’ tumor, and renal oncocytoma, respec-tively [51-54]. For example, inactivation of the VHL gene by somatic mutation is a common feature of clear cell subtype of RCC. Cells that lack a functional VHL protein are unable to degrade the hypoxia inducible transcription factor (HIF). As a consequence these cells have uncontrolled expression of genes controlled by the HIF transcription factor. When parametric gene set enrichment analysis (PGSEA) is used in conjunction with gene sets (n = 1892) obtained from the Molecular Signatures Database (MSigDB, see Methods), four of the top five most significantly deregulated pathways unique to the clear cell RCC subtype were associated with a cel-lular hypoxia phenotype (Figure 3A, B). In a similar comparison of BHDS-derived tumors with the other RCC subtypes, the top five most significantly deregu-lated pathways were associated with OXPHOS or mito-chondria (Figure 3A, C). This result is consistent with the high mitochondria and OXPHOS-associated gene expression observed in both sporadic oncocytoma and chromophobe RCC, tumors known to contain an abun-dance of mitochondria. In this regard, BHDS-derived tumors are similar to the other sporadic DCT-derived tumors. Since our analyses of individual gene expression supported distinctions between BHDS-derived tumors and sporadic renal oncocytoma and chromophobe RCC, we used PGSEA to assess whether any gene sets were uniquely enriched in BHDS-tumors. For clarity in pre-sentation, we have organized these differentially expressed gene sets by hierarchical clustering based on the percentage of overlapping genes within gene sets (see Materials and Methods). In this way, gene sets that were highly redundant (i.e. contained a large percentage of overlapping genes) were located within the same branch of the clustering dendrogram. Somewhat surpris-ingly, several gene sets that were associated with mito-chondrial function were also identified as being significantly up-regulated in BHDS-derived tumors when compared to sporadic renal oncocytoma and chro-mophobe RCC (Figure 3D, E). These enriched gene sets of the BHDS-derived tumors included two hand-curated gene sets reflective of peroxisome proliferator-activated receptor g coactivator 1a (PGC-1a, encoded by the PPARGC1A gene) activation, MOOTHA_VOXPHOS and PGC[55]. A full list of the pathways most deregu-lated in BHDS-derived tumors is included as Additional file 1, Table S3.
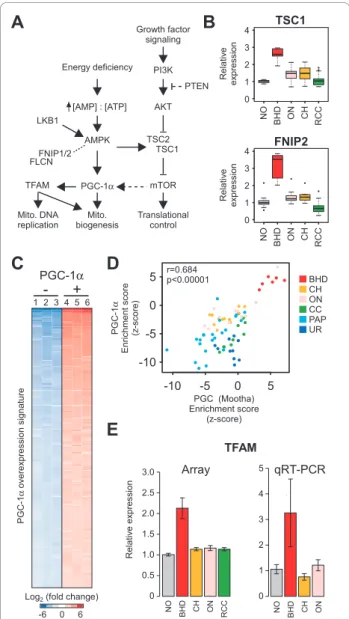
An expression phenotype involving the PGC-1a-TFAM signaling axis is unique to BHDS-derived tumors
The presence of FLCN mutations in BHDS-derived tumors suggested we might be able to identify signal transduction events associated with FLCN function (Figure 4A). Previous studies of the FLCN gene product
CCND1 0 2 4 6 8 10 12 ON20 BHD CH ON BHD CH ON R e la ti v e e x p re ssi o n Cyclin D1 4 0 -4 Log 2 (fold change)
A
B
C
1 2 3 4 5 6 7 8 9 10 11 12 13 14 15 16 17 18 19 20 21 22 X Y 67,374,323 74,917,444 Chromosome 11q13.2-11q13.4 base pair 10 0 -10 Enrichment score (z-score) p q MYEOV SAPS3 NDUFS8 ALDH3B1 NDUFV1 CTTN IL18BP FOLR3 SLCO2B1 PCF11 BHD CH ON Chromosome ArmFigure 2BHD tumors do not share the cytogenetic features of sporadic chromophobe RCC and renal oncocytoma. A) CGMA plot of BHD, CH, and ON tumor samples (columns) and
chromosomal arms (rows) (p < 0.001). Blue indicates regions with a predicted copy number loss while red indicates regions with a predicted copy number gain or somatic chromosome pairing. The vertical dashed line separates oncocytoma samples with high cyclin D1 (CCND1) expression on the left from those with low expression on the right. B) Heatmap showing expression values for CCND1 and neighboring genes on chromosome 11q, with sample columns aligned as in part A. C) Relative gene expression for CCND1, with samples arranged as given in the columns of the previous parts A and B.
have indicated a role for this protein in regulation of 5’ AMP-activated protein kinase (AMPK) and activation of the mTOR signalling pathway. Specifically, FLCN forms a complex with folliculin interacting protein 1 or 2 (FNIP1 or FNIP2) and the FLCN-FNIP complex binds to AMPK [20,23,24]. When we examined twelve genes encoding the proteins described in Figure 4A (AKT1, FLCN, FNIP1, FNIP2, PIK3C3, PPARGC1A, PRKAA2, RICTOR, RPTOR, TFAM, TSC1, and TSC2) in our gene expression array data, we noticed a slightly elevated level of FNIP1 expression in BHDS-derived tumors (data not shown) and that FNIP2 was highly deregulated in BHDS-derived tumors, suggesting that these proteins are relevant to FLCN signaling in renal tumor cells (Fig-ure 4BAdditional file 2, Fig(Fig-ure S1D). While FNIP1 and FNIP2 share a C-terminal protein domain that binds FLCN, their respective N-terminal domains are quite dissimilar and it is speculated that these proteins have non-redundant functions [23,24]. In addition, consistent with deregulation of the mTOR pathway, we also noted the deregulation of TSC1, a major regulator of mTOR, in the BHDS-derived tumors (Additional file 2, Figure S1E).
We also examined transcription levels of genes asso-ciated with AMPK signaling, as this was a likely can-didate for signaling based on our observation of mitochondrial gene set enrichment and the recently dis-covered indirect interaction between FLCN and AMPK. AMPK is a key molecule for energy sensing and a regula-tor of the PGC-1a transcription facregula-tor, a potent inducer of mitochondrial biogenesis (Figure 4A). We noted that two transcription factors, PGC-1a and TFAM (transcrip-tion factor A, mitochondrial), were also up-regulated in the BHDS-derived tumors (Figure 4E and Additional file 2, Figure S1G). Both transcription of mitochondrial genes and replication of the mitochondrial genome depend on TFAM function and the TFAM gene is uniquely over-expressed in the BHDS-derived tumors (for a review of transcriptional regulators of mitochondria, see [56-58]). PGC-1a (PPARGC1A)was also highly expressed in the BHDS-derived tumors as measured by gene expression profiling. However, the levels of PGC-1a as measured by qRT-PCR in BHDS tumors were sensitive to the probe/ primer sets used, suggesting that BHDS tumors may have a difference in the abundance of a particular PGC-1a iso-form (Additional file 2, Figure S1G). The PGC-1a bind-ing partner, nuclear receptor peroxisome proliferator-activated receptor gamma(PPARG) was highly expressed in BHDS-derived tumors as compared to non-diseased tissue, sporadic oncocytoma, and chromophobe RCC (Additional file 2, Figure S1F) while the peroxisome pro-liferator-activated receptor alpha(PPARA) was higher in BHDS-derived tumors versus sporadic oncocytoma and
Clear Cell RCC vs. other subtypes
BHD vs. Chromophobe and Oncocytoma
HSA00190_OXIDATIVE_PHOSPH... 4.35 2.9e-3 Oxphos
ELECTRON_TRANSPORT_CHAIN 5.77 2.6e-4 Oxphos
MOOTHA_VOXPHOS 5.51 2.6e-4 Oxphos
MITOCHONDRIA 7.77 4.3e-4 Mitochondria
HUMAN_MITODB_6_2002 8.28 3.2e-4 Mitochondria
MENSE_HYPOXIA_UP 13.5 5.8e-16 Hypoxia
HIF1_TARGETS 10.2 8.0e-18 Hypoxia
BOQUEST_CD31PLUS_VS_CD31... 20.6 7.3e-17 Cell type
HYPOXIA_FIBRO_UP 9.28 4.6e-17 Hypoxia
HYPOXIA_REG_UP 10.5 8.3e-16 Hypoxia
A
B
C
BHD vs. other subtypes
HSA00190_OXIDATIVE_PHOSPH... 10.5 1.3e-3 Oxphos
ELECTRON_TRANSPORT_CHAIN 9.04 1.7e-5 Oxphos
MOOTHA_VOXPHOS 8.48 2.1e-5 Oxphos
MITOCHONDRIA 9.51 1.7e-5 Mitochondria
HUMAN_MITODB_6_2002 9.75 1.7e-5 Mitochondria
D
logFC adj.P.Val Group
NO CC other RCC MENSE_HYPOXIA_UP NO BHD CH ON other RCC OXIDATIVE_ PHOSPHORYLATION ELECTRON_ TRANSPORT_CHAIN 15 10 5 0 -5 10 5 0 -5 -10 10 5 0 -5
E
En ri ch m e n t sco re (z -sco re ) En ri ch m e n t sco re (z -sco re ) En ri ch m e n t sco re (z -sco re ) 7) UBIQUINONE_BIOSYNTHESIS 6) HSA00130_UBIQUINONE_BIOSY... 5) MOOTHA_VOXPHOS 4) ELECTRON_TRANSPORT_CHAIN 3) HUMAN_MITODB_6_2002 2) MITOCHONDRIA 1) PGC BHD CH ON 1 2 3 4 5 6 7 10 0 -10 Enrichment score (z-score) NO BHD CH ON other RCCFigure 3A mitochondrial phenotype is the most prominent molecular feature of BHDS renal tumors. A) Top differentially expressed gene sets in CC and BHD tumors. The first and second groups represent those gene sets from MsigDB that are unique to CC and BHD, respectively, as compared to the other RCC subtypes given in Figure 1A. The third group is a comparison of the BHD tumor gene expression data with only CH and ON gene expression data. B) The most differentially expressed gene set in CC tumor samples compared to the other RCC subtypes. C) The most differentially expressed gene set in BHDS tumor samples compared to the other RCC subtypes. D) Heatmap of enrichment scores for the thirty most differentially expressed gene sets in BHD versus CH and ON. On the left is a dendrogram displaying the calculated pairwise distances between dissimilarities of gene set compositions. E) The most differentially expressed gene set in BHD tumors as compared with CH and ON. Note that enrichment values for the other RCC subtypes are given here for reference in B, C, and E.
chromophobe (data not shown). Moreover, we found a set of PGC-1a regulated genes, entitled “PGC,” was highly up-regulated in BHDS-derived samples (Figure 3D). To confirm this “PGC” gene set from MsigDB was representative of PGC-1a activation, we generated an independent gene expression signature from HepG2 cells that were adenovirally infected with PGC-1a versus con-trol (Figure 4C, performed by Gaillard et al.) [59]. Although there was only 11.8 percent similarity between these two independently generated PGC-1a gene sets, both gene sets were significantly up-regulated in BHDS-derived patient tumors (Figure 4D). We did not see expression changes associated with genes encoding the mitochondria-associated transcription factors NRF-1 and NRF-2. Taken together, these results indicate that dereg-ulation of FLCN function by point mutation is associated with FNIP2 deregulation and perturbation of the PGC-1a-TFAM signaling axis.
FLCNexpression inversely correlates with PGC-1a activation
Based on the data from the BHDS-derived tumors, we hypothesized that defects in FLCN may be associated with increased expression of genes related to mitochon-dria and OXPHOS. To test this hypothesis, we exam-ined the relationship between FLCN expression and gene set enrichment in a variety of other tumor tissue types, using a data set that includes tumors of the breast, cervix, colon, kidney, lung, lymph, ovary, pan-creas, prostate, stomach, thyroid, and vulva, with matched normal tissue of each tissue type. Using FLCN expression levels and PGSEA scores of the 1892 gene sets analyzed previously for this data set, we determined which gene sets were most related to FLCN gene expression. Consistent with the loss of FLCN function in BHDS-derived tumors, the top 20 gene sets identified were all negatively correlated to FLCN expression and were primarily related to metabolism and mitochondrial function (Figure 5A). Specifically, we found that the PGC gene set and other OXPHOS gene sets were highly negatively correlated with FLCN expression across these tumor types (Figure 5B). Though not included in the initial gene set correlation analysis, our PGC-1a over-expression signature (Figure 4C) was also negatively cor-related with FLCN expression (rho, -0.60, p < 0.0001). Based on our findings, it is likely that a FLCN-PGC-1a-TFAM signaling axis exists and that lack of FLCN expression may be an important feature in sporadic tumors of other organs as it is in BHDS-derived renal tumors. Energy deficiency [AMP] : [ATP] AMPK LKB1 PGC-1α FLCN mTOR TSC1 TSC2 AKT PTEN PI3K Growth factor signaling Translational control Mito. biogenesis FNIP1/2 -10 -5 0 5 PGC (Mootha) Enrichment score (z-score) -10 -5 0 5 PG C -1 α En ri ch m e n t sco re (z -sco re )
A
B
C
1 2 3 4 5 6 + -PGC-1α PG C -1 α o v e re x p re ssi o n si g n a tu reD
TFAME
R e la ti v e e x p re ssi o n 0 0.5 1.0 1.5 2.0 2.5 3.0 BH D C H N O O N R C C 2 1 3 0 4 5 , BH D C H N O O N Array qRT-PCR BHD CH ON CC PAP UR TSC1 FNIP2 N O BH D O N C H R C C 0 1 2 3 4 R e la ti v e e x p re ssi o n 0 1 2 3 4 R e la ti v e e x p re ssi o n N O BH D O N C H R C C Mito. DNA replication TFAM 6 0 -6Log2 (fold change)
r=0.684 p<0.00001
Figure 4BHDS-derived tumors possess characteristics of an active PGC-1a-TFAM signaling axis. A) Schematic of FLCN interacting proteins in signal transduction pathway. B) Relative gene expression levels for tuberous sclerosis 1 (TSC1) and folliculin interacting protein 2 (FNIP2) proteins in tumors from patients with BHDS, ON, CH, and the other RCC subtypes from Figure 1A. C) An independent PGC-1a signature from over-expression of PGC-1a in HepG2 cells (GSE5968), showing the top 150 genes (rows) that are up-regulated in PGC-1a over-expressing cells compared to controls (columns). Red indicates high expression and blue indicates low expression. D) Correlation of empirically-derived PGC-1a signature represented in C compared to the PGC signature from Figures 3A and 3D, applied to the six RCC subtypes, using Pearson’s correlation. E) Relative expression of the TFAM transcription factor involved in mitochondrial biogenesis (all p ≤ 0.01) in gene expression array data from BHD, CH, ON, and the remaining RCC subtypes, as well as non-diseased tissue and from qRT-PCR validation of a subset of those samples.
Discussion
To establish the molecular characteristics of tumors that arise in individuals afflicted with BHDS, we compared gene expression data from renal tumors of BHDS patients with expression data from sporadic renal tumors. Although previous gene expression profiling studies indicated that renal tumors isolated from indivi-duals afflicted with von Hippel-Lindau disease are indis-tinguishable from sporadic clear cell RCC[43], we show that kidney tumors from patients with BHDS also have unique genetic and cytogenetic characteristics from sporadic renal oncocytoma and chromophobe RCC. In
particular, cytogenetic defects that are typical of spora-dic oncocytoma and chromophobe RCC, including defects of chromosome 19, loss of chromosome 1, and translocations involving chromosome 11, were largely absent from BHDS-derived tumors. Interestingly, we did not find differences in FLCN expression by either our gene expression arrays nor by qRT-PCR, suggesting that the FLCN mRNA transcript may not be subject to nonsense-mediated mRNA decay. However, several indi-vidual genes are differentially expressed between BHDS-derived tumors and the sporadic tumors. One gene in particular, DAPL1 (death-associated protein-like 1), is expressed at a high level in BHDS-derived tumors. Although the function of DAPL1 is not known, it was originally termed early epithelial differentiation asso-ciated(EEDA) for its expression in stratified squamous epithelium, specifically in a population of cells of the hair follicle [60]. High expression of this gene in BHDS-derived tumors is a potentially interesting finding given the clinical presentation of fibrofolliculomas that arise in BHDS-afflicted individuals.
Several recent reports have implicated FLCN in the energy and nutrient signaling pathway through its inter-actions with FNIP1 and FNIP2 and its indirect interac-tion with AMPK (Figure 4A). These studies have also suggested that FLCN impacts the mammalian target of rapamycin (mTOR) related components of the PI3K-Akt signal transduction pathway [22]. Consistent with the existence of a FLCN-mTOR relationship, treatment with the specific mTOR inhibitor, rapamycin, delays the death of mice that possess targeted deletion of FLCN in the kidney [61,62]. We noted high expression of FNIP2 and TSC1 in BHDS-derived tumors, implicating a novel link between FLCN and both AMPK- and mTOR-mediated signaling and transcription. However, we did not see evidence of PI3K-Akt activation in BHDS-derived tumors using an expression signature that was a robust predictor of PI3K-Akt pathway activation in other renal tumors [53], nor did we see consistent enrichment of the three mTOR activation signatures from the MsigDB in the BHDS patient samples. It is possible that the up-regulation of TSC1 we have observed represents a feedback effect from the somatic mutation in FLCN. One potential rational for this obser-vation is that is has recently been noted that actiobser-vation of mTOR controls mitochondrial gene expression through signaling with PGC-1a [63]. Moreover, mTOR-mediated control of mitochondrial gene expression is inhibited by application of rapamycin. Our results sug-gest that the effects of rapamycin noted in FLCN loss-of-function mice may be through the mitochondrial effects of mTOR activation as opposed to activation of PI3K-Akt. -1.0 -0.5 0 0.5 1.0 rho = -0.64 -15 -5 -10 0 5 10 FLCN expression
(log2 - fold change)
PG C En ri ch m e n t sco re (z -sco re )
A
B
p < 0.0001 FERRANDO CHEMO RESPONSE PATHWAY -0.70 ROS MOUSE AORTA UP -0.67HSA00252 ALANINE AND ASPARTATE METABOLISM -0.67 GLYCOLYSIS AND GLUCONEOGENESIS -0.67
HSA00190 OXIDATIVE PHOSPHORYLATION -0.65
CITRATE CYCLE TCA CYCLE -0.65
HSA04530 TIGHT JUNCTION -0.65
ELECTRON TRANSPORT CHAIN -0.65
METHANE METABOLISM -0.64 HSA00020 CITRATE CYCLE -0.64
PGC -0.64
HSA00330 ARGININE AND PROLINE METABOLISM -0.64
MOOTHA VOXPHOS -0.64
PHENYLALANINE TYROSINE AND TRYPTOPHAN... -0.63 TIS7 OVEREXP DN -0.63
OXIDATIVE PHOSPHORYLATION -0.63
VENTRICLES UP -0.62 IDX TSA UP CLUSTER5 -0.62
CMV HCMV TIMECOURSE 24HRS UP -0.62 ADIPOGENESIS HMSC CLASS5 UP -0.62
Figure 5 FLCNexpression negatively correlates with PGC-1a activation. A) The twenty most highly correlated gene sets with FLCN expression levels, followed by their respective Spearman rho correlation coefficients. Bold font indicates gene sets also shown in Figure 3. The dendrogram is based on gene set dissimilarity scores (see Materials and Methods). B) Plot of FLCN expression and the enrichment scores for the PGC gene set in tumors of the breast, cervix, colon, kidney, lung, lymph, ovary, pancreas, prostate, stomach, thyroid, and vulva, with tissue type-matched normal tissue. Data for A) and B) are from the Expression Project for Oncology -International Genomics Consortium.
Throughout our analysis, we observed that one spora-dic renal oncocytoma co-clustered with the BHDS-derived tumors and showed strong PGC-1a-related gene expression (Figure 1B, F). This tumor sample also lacked the cytogenetic features typical of sporadic oncocytomas, such as loss of chromosome 1, deregulation of CCND1, and over-expression of chromosome 19 genes (Figure 2). Interestingly, this individual presented with renal oncocytoma at the age of 34 years old, while the median age of sporadic renal oncocytoma is between 65-70 [7,64]. Given that early age at diagnosis (under age 50) is often a feature of hereditary disease, we sequenced the entire FLCN open reading frame from non-diseased kidney tissue of this patient and only identified a com-mon single nucleotide polymorphism within the 5’ UTR [11]. Though somatic mutations in FLCN occur in approximately 10 percent of sporadic tumors, we lacked the tissue required to determine the FLCN status in the tumor itself. However, these results suggest that a sepa-rate BHDS-like group of sporadic renal oncocytomas could exist in the population, genetically distinct from other sporadic renal tumors.
Finally, although these DCT-derived tumors are genetically distinct, BHDS-derived tumors, sporadic renal oncocytoma, and chromophobe RCC share their histological and mitochondrial/OXHPOS gene expres-sion characteristics. Development of oncocytomas in organ sites outside of the kidney are also associated with prominent mitochondrial DNA mutations, a high production of mitochondria, and deregulated OXPHOS gene expression [65,66]. In renal oncocytoma and other mitochondrial myopathies, up-regulation of mitochon-drial gene expression is thought to represent a feedback mechanism to compensate for mitochondrial damage [67,68]. In this study, we show that the mitochondrial expression phenotype is even more pronounced in sam-ples that harbor FLCN mutations. The enhanced mito-chondrial gene expression in BHDS samples suggests that wild-type FLCN is important for efficient mitochon-drial function and that lack of functional FLCN leads to a yet unknown mitochondrial dysfunction. Deregulation of mitochondrial proteins has recently been identified in sporadic oncocytoma and chromophobe RCC [30]. Future studies will therefore help to clarify the role of FLCN in mitochondrial function.
Conclusions
Our results support a genetic distinction between BHDS-associated tumors and other sporadic renal neo-plasias. In addition, we found that deregulation of the PGC-1a-TFAM signaling axis is most pronounced in renal tumors that harbor FLCN mutations and in tumors from other organs that have relatively low expression of FLCN. These results are consistent with
the recently discovered interaction between FLCN and AMPK and support a model in which FLCN is a regula-tor of mitochondrial function.
Additional material
Additional file 1: Supplementary Tables S1-S4. This file contains four supplementary tables: Table S1- characteristics of BHD-derived tumor samples, Table S2- top 200 genes differentially expressed between BHD renal tumors and sporadic renal oncocytomas (ON) and chromophobe RCC (CH) samples, Table S3- most significantly enriched gene sets in BHDS-derived tumor samples versus sporadic oncocytoma (ON) and chromophobe RCC (CH) samples, and Table S4- primer and probe sequences for qRT-PCR validation of genes in BHDS, CH, ON, and CC tumors relative to Normal kidney.
Additional file 2: Supplementary Figures S1-S3. This file contains three supplementary figures: Figure S1- gene expression measurements for individual genes deregulated in BHDS tumors, Figure S2- heatmap of differentially expressed genes from Figure 1E in sporadic kidney tumors, and Figure S3- histological images of sample BHD4.
Acknowledgements
This work was supported by the French NCI (Institut National du Cancer, PNES rein) and the Ligue Nationale contre le Cancer (Comités du Cher et de l’Indre).
Author details
1Laboratory of Computational Biology, Van Andel Research Institute, Grand
Rapids, MI, USA.2Laboratory of Cancer Genetics, Van Andel Research
Institute, Grand Rapids, MI, USA.3Laboratory of Systems Biology, Van Andel
Research Institute, Grand Rapids, MI, USA.4Division of Surgical Pathology,
Northwestern University Feinberg School of Medicine, Chicago, IL, USA.
5
Department of Molecular Medicine and Surgery and Center for Molecular Medicine, Karolinska Institutet at Karolinska University Hospital, SE-171 76 Stockholm, Sweden.6Department of Pathology, Karolinska University Hospital, SE-182 88 Stockholm, Sweden.7Division of Urology, Department of
Clinical Sciences, Karolinska Institutet at Danderyd Hospital, SE-182 88 Stockholm, Sweden.8Department of Surgery, Karolinska Institutet at
Danderyd Hospital, SE-182 88 Stockholm, Sweden.9Génétique Oncologique
EPHE, INSERM U753, Le Kremlin-Bicêtre and Institut Gustave Roussy, Villejuif, France.10Laboratoire de Génétique, Hôpital Edouard Herriot, Hospices Civils,
Lyon, France.11
Centre de Références Cancers Rares PREDIR de l’INCa, Service d’Urologie, AP-HP, Hôpital de Bicêtre, Le Kremlin-Bicêtre, France.
12
Laboratoire d’Anatomie Pathologique, Hôpital Foch, Suresnes, France.
13
Service d’Urologie, Hôpital Foch, Suresnes, France.14
Service d’Urologie, Hôpital Necker, Paris, France.15Laboratoire d’Anatomie Pathologique, Hôpital Necker, Paris, France.16NCCS-VARI Translational Research Laboratory, National
Cancer Centre of Singapore, Singapore. Authors’ contributions
DP generated the gene expression data, while JK performed the data analysis with datasets obtained from KD. JK, DP, JC, NN and JM carried out the molecular studies. JK, XY, AS, PZ, MA, MN, UB, SG, SG, YD, LY, AM, VV, SR and BT participated in the study design, mutation detection, pathological evaluation, and sample collection. JK and KF drafted the manuscript. All authors read and approved the final manuscript.
Competing interests
The authors declare that they have no competing interests. Received: 20 May 2010 Accepted: 16 December 2010 Published: 16 December 2010
References
1. Mostofi FK, Davis CJ: WHO International Histological Classification of Tumors. Berlin: Springer 1998.
2. Kovacs G: Molecular differential pathology of renal cell tumours. Histopathology 1993, 22:1-8.
3. Higgins JP, Shinghal R, Gill H, Reese JH, Terris M, Cohen RJ, Fero M, Pollack JR, Van De Rijn M, Brooks JD: Gene expression patterns in renal cell carcinoma assessed by complementary DNA microarray. Am J Pathol 2003, 162(3):925-932.
4. Takahashi M, Yang XJ, Sugimura J, Backdahl J, Tretiakova M, Qian CN, Gray SG, Knapp R, Anema J, Kahnoski R, et al: Molecular subclassification of kidney tumors and the discovery of new diagnostic markers. Oncogene 2003, 22(43):6810-6818.
5. Yusenko MV: Molecular pathology of renal oncocytoma: a review. Int J Urol 17(7):602-612.
6. Yusenko MV: Molecular pathology of chromophobe renal cell carcinoma: a review. Int J Urol 17(7):592-600.
7. Gudbjartsson T, Hardarson S, Petursdottir V, Thoroddsen A, Magnusson J, Einarsson GV: Renal oncocytoma: a clinicopathological analysis of 45 consecutive cases. BJU Int 2005, 96(9):1275-1279.
8. Linehan WM, Pinto PA, Srinivasan R, Merino M, Choyke P, Choyke L, Coleman J, Toro J, Glenn G, Vocke C, et al: Identification of the genes for kidney cancer: opportunity for disease-specific targeted therapeutics. Clin Cancer Res 2007, 13(2 Pt 2):671s-679s.
9. Kaelin WG: The von Hippel-Lindau tumor suppressor protein and clear cell renal carcinoma. Clin Cancer Res 2007, 13:680-684.
10. Nickerson ML, Jaeger E, Shi Y, Durocher JA, Mahurkar S, Zaridze D, Matveev V, Janout V, Kollarova H, Bencko V, et al: Improved identification of von Hippel-Lindau gene alterations in clear cell renal tumors. Clin Cancer Res 2008, 14(15):4726-4734.
11. Menko FH, van Steensel MA, Giraud S, Friis-Hansen L, Richard S, Ungari S, Nordenskjold M, Hansen TV, Solly J, Maher ER: Birt-Hogg-Dube syndrome: diagnosis and management. Lancet Oncol 2009, 10(12):1199-1206. 12. Toro JR, Wei MH, Glenn GM, Weinreich M, Toure O, Vocke C, Turner M,
Choyke P, Merino MJ, Pinto PA, et al: BHD mutations, clinical and molecular genetic investigations of Birt-Hogg-Dube syndrome: a new series of 50 families and a review of published reports. J Med Genet 2008, 45(6):321-331.
13. Nickerson ML, Warren MB, Toro JR, Matrosova V, Glenn G, Turner ML, Duray P, Merino M, Choyke P, Pavlovich CP, et al: Mutations in a novel gene lead to kidney tumors, lung wall defects, and benign tumors of the hair follicle in patients with the Birt-Hogg-Dube syndrome. Cancer Cell 2002, 2(2):157-164.
14. Pavlovich CP, Walther MM, Eyler RA, Hewitt SM, Zbar B, Linehan WM, Merino MJ: Renal tumors in the Birt-Hogg-Dube syndrome. Am J Surg Pathol 2002, 26(12):1542-1552.
15. Adley BP, Smith ND, Nayar R, Yang XJ: Birt-Hogg-Dube syndrome: clinicopathologic findings and genetic alterations. Arch Pathol Lab Med 2006, 130(12):1865-1870.
16. Khoo SK, Kahnoski K, Sugimura J, Petillo D, Chen J, Shockley K, Ludlow J, Knapp R, Giraud S, Richard S, et al: Inactivation of BHD in sporadic renal tumors. Cancer Res 2003, 63(15):4583-4587.
17. Gad S, Lefevre SH, Khoo SK, Giraud S, Vieillefond A, Vasiliu V, Ferlicot S, Molinie V, Denoux Y, Thiounn N, et al: Mutations in BHD and TP53 genes, but not in HNF1beta gene, in a large series of sporadic chromophobe renal cell carcinoma. Br J Cancer 2007, 96(2):336-340.
18. Togashi Y, Kobayashi T, Momose S, Ueda M, Okimoto K, Hino O: Transgenic rescue from embryonic lethality and renal carcinogenesis in the Nihon rat model by introduction of a wild-type Bhd gene. Oncogene 2006, 25(20):2885-2889.
19. Vocke CD, Yang Y, Pavlovich CP, Schmidt LS, Nickerson ML, Torres-Cabala CA, Merino MJ, Walther MM, Zbar B, Linehan WM: High frequency of somatic frameshift BHD gene mutations in Birt-Hogg-Dube-associated renal tumors. J Natl Cancer Inst 2005, 97(12):931-935.
20. Baba M, Hong SB, Sharma N, Warren MB, Nickerson ML, Iwamatsu A, Esposito D, Gillette WK, Hopkins RF, Hartley JL, et al: Folliculin encoded by the BHD gene interacts with a binding protein, FNIP1, and AMPK, and is involved in AMPK and mTOR signaling. Proc Natl Acad Sci USA 2006, 103(42):15552-15557.
21. Hartman TR, Nicolas E, Klein-Szanto A, Al-Saleem T, Cash TP, Simon MC, Henske EP: The role of the Birt-Hogg-Dube protein in mTOR activation and renal tumorigenesis. Oncogene 2009, 28(13):1594-1604.
22. Hasumi Y, Baba M, Ajima R, Hasumi H, Valera VA, Klein ME, Haines DC, Merino MJ, Hong SB, Yamaguchi TP, et al: Homozygous loss of BHD
causes early embryonic lethality and kidney tumor development with activation of mTORC1 and mTORC2. Proc Natl Acad Sci USA 2009, 106(44):18722-18727.
23. Hasumi H, Baba M, Hong SB, Hasumi Y, Huang Y, Yao M, Valera VA, Linehan WM, Schmidt LS: Identification and characterization of a novel folliculin-interacting protein FNIP2. Gene 2008, 415(1-2):60-67. 24. Takagi Y, Kobayashi T, Shiono M, Wang L, Piao X, Sun G, Zhang D, Abe M,
Hagiwara Y, Takahashi K, et al: Interaction of folliculin (Birt-Hogg-Dube gene product) with a novel Fnip1-like (FnipL/Fnip2) protein. Oncogene 2008, 27(40):5339-5347.
25. Schuetz AN, Yin-Goen Q, Amin MB, Moreno CS, Cohen C, Hornsby CD, Yang WL, Petros JA, Issa MM, Pattaras JG, et al: Molecular classification of renal tumors by gene expression profiling. J Mol Diagn 2005, 7(2):206-218.
26. Mayr JA, Meierhofer D, Zimmermann F, Feichtinger R, Kogler C, Ratschek M, Schmeller N, Sperl W, Kofler B: Loss of complex I due to mitochondrial DNA mutations in renal oncocytoma. Clin Cancer Res 2008,
14(8):2270-2275.
27. Gasparre G, Hervouet E, de Laplanche E, Demont J, Pennisi LF, Colombel M, Mege-Lechevallier F, Scoazec JY, Bonora E, Smeets R, et al: Clonal expansion of mutated mitochondrial DNA is associated with tumor formation and complex I deficiency in the benign renal oncocytoma. Hum Mol Genet 2008, 17(7):986-995.
28. Kovacs A, Storkel S, Thoenes W, Kovacs G: Mitochondrial and chromosomal DNA alterations in human chromophobe renal cell carcinomas. J Pathol 1992, 167(3):273-277.
29. Welter C, Kovacs G, Seitz G, Blin N: Alteration of mitochondrial DNA in human oncocytomas. Genes Chromosomes Cancer 1989, 1(1):79-82. 30. Yusenko MV, Ruppert T, Kovacs G: Analysis of differentially expressed
mitochondrial proteins in chromophobe renal cell carcinomas and renal oncocytomas by 2-D gel electrophoresis. Int J Biol Sci 6(3):213-224. 31. Murakami T, Sano F, Huang Y, Komiya A, Baba M, Osada Y, Nagashima Y,
Kondo K, Nakaigawa N, Miura T, et al: Identification and characterization of Birt-Hogg-Dube associated renal carcinoma. J Pathol 2007, 211(5):524-531.
32. Yang XJ, Tan MH, Kim HL, Ditlev JA, Betten MW, Png CE, Kort EJ, Futami K, Furge KA, Takahashi M, et al: A molecular classification of papillary renal cell carcinoma. Cancer Res 2005, 65(13):5628-5637.
33. Khoo SK, Giraud S, Kahnoski K, Chen J, Motorna O, Nickolov R, Binet O, Lambert D, Friedel J, Levy R, et al: Clinical and genetic studies of Birt-Hogg-Dube syndrome. J Med Genet 2002, 39(12):906-912.
34. Ihaka R, Gentleman R: R: A language for data analysis and graphics. J Comput Graph Stat 1996, 5:299-314.
35. Gentleman RC, Carey VJ, Bates DM, Bolstad B, Dettling M, Dudoit S, Ellis B, Gautier L, Ge Y, Gentry J, et al: Bioconductor: open software development for computational biology and bioinformatics. Genome Biol 2004, 5:R80. 36. Dai M, Wang P, Boyd AD, Kostov G, Athey B, Jones EG, Bunney WE,
Myers RM, Speed TP, Akil H, et al: Evolving gene/transcript definitions significantly alter the interpretation of GeneChip data. Nucleic Acids Res 2005, 33(20):e175.
37. Marshall OJ: PerlPrimer: cross-platform, graphical primer design for standard, bisulphite and real-time PCR. Bioinformatics 2004, 20(15):2471-2472.
38. Suzuki R, Shimodaira H: Pvclust: an R package for assessing the uncertainty in hierarchical clustering. Bioinformatics 2006, 22(12):1540-1542.
39. Smyth GK: Linear models and empirical bayes methods for assessing differential expression in microarray experiments. Stat Appl Genet Mol Biol 2004, 3:Article3.
40. Furge KA, Dykema KJ, Ho C, Chen X: Comparison of array-based comparative genomic hybridization with gene expression-based regional expression biases to identify genetic abnormalities in hepatocellular carcinoma. BMC Genomics 2005, 6(1):67.
41. Furge KA, Chen J, Koeman J, Swiatek P, Dykema K, Lucin K, Kahnoski R, Yang XJ, Teh BT: Detection of DNA copy number changes and oncogenic signaling abnormalities from gene expression data reveals MYC activation in high-grade papillary renal cell carcinoma. Cancer Res 2007, 67(7):3171-3176.
42. Martignoni G, Pea M, Chilosi M, Brunelli M, Scarpa A, Colato C, Tardanico R, Zamboni G, Bonetti F: Parvalbumin is constantly expressed in
43. Beroukhim R, Brunet JP, Di Napoli A, Mertz KD, Seeley A, Pires MM, Linhart D, Worrell RA, Moch H, Rubin MA, et al: Patterns of gene expression and copy-number alterations in von-hippel lindau disease-associated and sporadic clear cell carcinoma of the kidney. Cancer Res 2009, 69(11):4674-4681.
44. Tomlins SA, Rhodes DR, Perner S, Dhanasekaran SM, Mehra R, Sun XW, Varambally S, Cao X, Tchinda J, Kuefer R, et al: Recurrent fusion of TMPRSS2 and ETS transcription factor genes in prostate cancer. Science 2005, 310(5748):644-648.
45. Hertzberg L, Betts DR, Raimondi SC, Schafer BW, Notterman DA, Domany E, Izraeli S: Prediction of chromosomal aneuploidy from gene expression data. Genes Chromosomes Cancer 2006, 46(1):75-86.
46. Paner GP, Lindgren V, Jacobson MS, Harrison K, Cao Y, Campbell SC, Flanigan RC, Picken MM: High Incidence of Chromosome 1 Abnormalities in a Series of 27 Renal Oncocytomas: Cytogenetic and Fluorecence In Situ Hybridzation Studies. Arch Path Lab Medicine 2006, 131:81-85. 47. Koeman JM, Russell RC, Tan MH, Petillo D, Westphal M, Koelzer K,
Metcalf JL, Zhang Z, Dykema KJ, Houseman HL, et al: Somatic pairing of chromosome 19 in renal oncocytoma is associated with deregulated EGLN2-mediated oxygen sensing response. PLoS Genet 2008, 4:e1000176. 48. Junker K, Weirich G, Moravek P, Podhola M, Ilse B, Hartmann A, Schubert J:
Familial and sporadic renal oncocytomas–a comparative molecular-genetic analysis. Eur Urol 2001, 40(3):330-336.
49. Yang Y, Padilla-Nash HM, Vira MA, Abu-Asab MS, Val D, Worrell R, Tsokos M, Merino MJ, Pavlovich CP, Ried T, et al: The UOK 257 cell line: a novel model for studies of the human Birt-Hogg-Dube gene pathway. Cancer Genet Cytogenet 2008, 180(2):100-109.
50. Sinke RJ, Dijkhuizen T, Janssen B, Olde Weghuis D, Merkx G, van den Berg E, Schuuring E, Meloni AM, de Jong B, Geurts van Kessel A: Fine mapping of the human renal oncocytoma-associated translocation (5;11) (q35;q13) breakpoint. Cancer Genet Cytogenet 1997, 96(2):95-101. 51. Furge KA, Tan MH, Dykema K, Kort E, Stadler W, Yao X, Zhou M, Teh BT:
Identification of deregulated oncogenic pathways in renal cell carcinoma: an integrated oncogenomic approach based on gene expression profiling. Oncogene 2007, 26(9):1346-1350.
52. Kort EJ, Farber L, Tretiakova M, Petillo D, Furge KA, Yang XJ, Cornelius A, Teh BT: The E2F3-Oncomir-1 axis is activated in Wilms’ tumor. Cancer Res 2008, 68(11):4034-4038.
53. Qian CN, Furge KA, Knol J, Huang D, Chen J, Dykema KJ, Kort EJ, Massie A, Khoo SK, Vanden Beldt K, et al: Activation of the PI3K/AKT pathway induces urothelial carcinoma of the renal pelvis: identification in human tumors and confirmation in animal models. Cancer Res 2009,
69(21):8256-8264.
54. Rohan S, Tu JJ, Kao J, Mukherjee P, Campagne F, Zhou XK, Hyjek E, Alonso MA, Chen YT: Gene expression profiling separates chromophobe renal cell carcinoma from oncocytoma and identifies vesicular transport and cell junction proteins as differentially expressed genes. Clin Cancer Res 2006, 12(23):6937-6945.
55. Mootha VK, Lindgren CM, Eriksson KF, Subramanian A, Sihag S, Lehar J, Puigserver P, Carlsson E, Ridderstrale M, Laurila E, et al: PGC-1alpha-responsive genes involved in oxidative phosphorylation are coordinately downregulated in human diabetes. Nat Genet 2003, 34(3):267-273. 56. Scarpulla RC: Transcriptional paradigms in mammalian mitochondrial
biogenesis and function. Physiol Rev 2008, 88(2):611-638.
57. Hock MB, Kralli A: Transcriptional control of mitochondrial biogenesis and function. Annu Rev Physiol 2009, 71:177-203.
58. Ventura-Clapier R, Garnier A, Veksler V: Transcriptional control of mitochondrial biogenesis: the central role of PGC-1alpha. Cardiovasc Res 2008, 79(2):208-217.
59. Gaillard S, Grasfeder LL, Haeffele CL, Lobenhofer EK, Chu TM, Wolfinger R, Kazmin D, Koves TR, Muoio DM, Chang CY, et al: Receptor-selective coactivators as tools to define the biology of specific receptor-coactivator pairs. Mol Cell 2006, 24(5):797-803.
60. Sun L, Ryan DG, Zhou M, Sun TT, Lavker RM: EEDA: a protein associated with an early stage of stratified epithelial differentiation. J Cell Physiol 2006, 206(1):103-111.
61. Baba M, Furihata M, Hong SB, Tessarollo L, Haines DC, Southon E, Patel V, Igarashi P, Alvord WG, Leighty R, et al: Kidney-targeted Birt-Hogg-Dube gene inactivation in a mouse model: Erk1/2 and Akt-mTOR activation, cell hyperproliferation, and polycystic kidneys. J Natl Cancer Inst 2008, 100(2):140-154.
62. Chen J, Futami K, Petillo D, Peng J, Wang P, Knol J, Li Y, Khoo SK, Huang D, Qian CN, et al: Deficiency of FLCN in mouse kidney led to development of polycystic kidneys and renal neoplasia. PLoS ONE 2008, 3(10):e3581. 63. Cunningham JT, Rodgers JT, Arlow DH, Vazquez F, Mootha VK, Puigserver P:
mTOR controls mitochondrial oxidative function through a YY1-PGC-1alpha transcriptional complex. Nature 2007, 450(7170):736-740. 64. Amin MB, Paner GP, Alvarado-Cabrero I, Young AN, Stricker HJ, Lyles RH,
Moch H: Chromophobe renal cell carcinoma: histomorphologic characteristics and evaluation of conventional pathologic prognostic parameters in 145 cases. Am J Surg Pathol 2008, 32(12):1822-1834. 65. Bonora E, Porcelli AM, Gasparre G, Biondi A, Ghelli A, Carelli V, Baracca A,
Tallini G, Martinuzzi A, Lenaz G, et al: Defective oxidative phosphorylation in thyroid oncocytic carcinoma is associated with pathogenic mitochondrial DNA mutations affecting complexes I and III. Cancer Res 2006, 66(12):6087-6096.
66. Savagner F, Mirebeau D, Jacques C, Guyetant S, Morgan C, Franc B, Reynier P, Malthiery Y: PGC-1-related coactivator and targets are upregulated in thyroid oncocytoma. Biochem Biophys Res Commun 2003, 310(3):779-784.
67. Heddi A, Lestienne P, Wallace DC, Stepien G: Mitochondrial DNA expression in mitochondrial myopathies and coordinated expression of nuclear genes involved in ATP production. J Biol Chem 1993,
268(16):12156-12163.
68. Srivastava S, Barrett JN, Moraes CT: PGC-1alpha/beta upregulation is associated with improved oxidative phosphorylation in cells harboring nonsense mtDNA mutations. Hum Mol Genet 2007, 16(8):993-1005. Pre-publication history
The pre-publication history for this paper can be accessed here: http://www.biomedcentral.com/1755-8794/3/59/prepub
doi:10.1186/1755-8794-3-59
Cite this article as: Klomp et al.: Birt-Hogg-Dubé renal tumors are genetically distinct from other renal neoplasias and are associated with up-regulation of mitochondrial gene expression. BMC Medical Genomics 2010 3:59.
Submit your next manuscript to BioMed Central and take full advantage of:
• Convenient online submission
• Thorough peer review
• No space constraints or color figure charges
• Immediate publication on acceptance
• Inclusion in PubMed, CAS, Scopus and Google Scholar
• Research which is freely available for redistribution
Submit your manuscript at www.biomedcentral.com/submit