HAL Id: hal-02048674
https://hal.archives-ouvertes.fr/hal-02048674
Submitted on 25 Feb 2019
HAL is a multi-disciplinary open access archive for the deposit and dissemination of sci-entific research documents, whether they are pub-lished or not. The documents may come from teaching and research institutions in France or abroad, or from public or private research centers.
L’archive ouverte pluridisciplinaire HAL, est destinée au dépôt et à la diffusion de documents scientifiques de niveau recherche, publiés ou non, émanant des établissements d’enseignement et de recherche français ou étrangers, des laboratoires publics ou privés.
Structure and properties of gallium-rich sodium
germano-gallate glasses
Téa Skopak, Scott Kroeker, Kirill Levin, Marc Dussauze, Raphaël Méreau,
Yannick Ledemi, Thierry Cardinal, Evelyne Fargin, Younès Messaddeq
To cite this version:
Téa Skopak, Scott Kroeker, Kirill Levin, Marc Dussauze, Raphaël Méreau, et al.. Structure and properties of gallium-rich sodium germano-gallate glasses. Journal of Physical Chemistry C, American Chemical Society, 2019, 123 (2), pp.1370-1378. �10.1021/acs.jpcc.8b08632�. �hal-02048674�
Structure and properties of gallium-rich sodium germano-gallate glasses
T. Skopak1,2, S. Kroeker3, K. Levin3, M. Dussauze4, R. Méreau4, Y. Ledemi2,
T. Cardinal1,*, E. Fargin1 and Y. Messaddeq2
1 Institut de Chimie de la Matière Condensée de Bordeaux, ICMCB-CNRS, Université de Bordeaux,
Bordeaux, France
2 Centre d’Optique, Photonique et Laser, COPL, Université Laval, Québec, QC, Canada 3Department of Chemistry, University of Manitoba, Winnipeg, MB, Canada
4 Institut des Sciences Moléculaires, ISM, Université de Bordeaux, Bordeaux, France
*Corresponding author email: thierry.cardinal@icmcb.cnrs.fr
Abstract
Glass compositions in the gallium-rich region of the ternary GaO3/2-GeO2-NaO1/2 vitreous system are studied
as a function of the Na/Ga cationic ratio (ranging from 1.30 to 1.61) for a fixed GeO2 content. Glass
structures are investigated by 71Ga MAS-NMR, infrared and Raman spectroscopies, and the thermal, optical
and physical properties are characterized. Vibrational spectra are interpreted with the help of density functional theory (DFT) calculations. Gallium oxide generally enters the germania network in four-fold coordination, however for Na/Ga ratio below unity, gallium cations tend to charge balance with the formation of 5- or 6-fold coordination units. When the amount of sodium is greater than gallium, non-bridging oxygens (NBOs) are formed preferably on germanate tetrahedral units. These structural descriptions are used to understand the evolution of glass properties such as glass transition temperature, density and refractive index.
Keywords: germano-gallate glasses, infrared, glass structure, vibrational spectroscopy, 71Ga NMR
1- Introduction
Optical applications in the near to mid-infrared (up to 5 m) are highly desirable notably for the detection of molecules showing absorption (vibrational modes) in this specific region (for example CO2, CH4, NOx,
SOx). Compared to common glass systems such as silicate or phosphate, gallate glass matrices present
potential applications in such a spectral range due to their low phonon energy (~550 cm-1 for some
alkali-gallate glasses or alkali-germano-alkali-gallate glasses [1]–[3]). Glass compositions such as tellurite or bismuthate are known for their extended transmission in the infrared (up to 7-8 m for a 2 mm thickness glass of Bi2O3
-PbO [4]). Nevertheless, their transmission windows are narrower due to absorption in the UV to visible region and their use can be limited due to the toxicity of their composition. Gallate and germanate glassy systems offer the advantages of lower toxicity, higher glass transition temperatures, and an extended IR transmission window.
Structurally, in the case of germanate glass, gallium oxide is assumed to act like aluminum oxide in a silicate network. In fact, it has been already shown that adding aluminum oxide to an alkali-silicate glass system leads to the substitution of Si4+ by Al3+ cations which requires charge compensation of the alumina
units by alkali ions, implying a decrease of the non-bridging oxygen content [5]–[7]. Nevertheless, it may be noted that high-coordinate aluminum is sometimes discussed without clear experimental evidence of its presence [5], [6]–[8]. As gallia and germania are chemically similar to alumina and silica, respectively, assuming the same structural behavior is a good starting point. However, several parameters influence the structure of the glasses, such as the role and content of gallium oxide, as well as the presence of other glass formers.
Several studies on germano-gallate glasses have been reported in the literature [9]–[16] but only a few have been focused on gallium-oxide-rich compositions [3], [17], [18]. Depending on the content of gallium oxide, its role can change from network modifier to network former [19]. In the presence of a glass former such as germanium oxide, gallium tends to reinforce the glass network, as can be seen in BaO-Ga2O3-GeO2
presence of high gallium content led to the suspected presence of highly coordinated gallium site in several studies [21]–[23].
This work focuses on the investigation of gallium-rich glass compositions belonging to the sodium germano-gallate ternary system with a fixed content of germanium oxide. In order to better understand the relationship between the properties and the structure of the glasses, thermal, optical and physical properties are investigated. A thorough structural study has been carried out by infrared (IR), Raman and 71Ga Magic
Angle Spinning Nuclear Magnetic Resonance (MAS-NMR) spectroscopies in order to provide new insights into the role played by gallium oxide with respect to germanium and sodium oxides.
2- Experimental details 2-1- Synthesis
Glasses in the ternary system studied here are presented with the GaO3/2, GeO2 and NaO1/2 components to
highlight the role of cations. Glasses were prepared by traditional melting technique from gallium oxide Ga2O3 (99.9%), germanium oxide GeO2 (99.999%), and sodium carbonate Na2CO3 (99.99%). After
weighing, the powders were mixed and placed in a platinum crucible for melting under nitrogen in an induction furnace at 1300-1450°C for 1 to 2 hours depending on the composition. The melted glasses were then quenched in ambient air by pouring in a mold or between two brass plates at room temperature for compositions that tend to crystallize during cooling. No annealing step was done. Finally, glasses were cut and polished on both parallel faces for further characterizations.
Crystalline KGaGeO4 was synthesized by the total recrystallization of the stoichiometric glass: 33.33GaO3/2
-33.33GeO2-33.33KO1/2 (mol%), and confirmed by powder x-ray diffraction (JCPDS – 052-1595).
2-2- Physical and thermal characterizations
Glass experimental chemical composition was determined by electron-probe micro-analysis (Wavelength Dispersive Spectroscopy) with a Microprobe Cameca SX 100. The averaged values were deduced from 10 measurements with a deviation of 2 mol.%.
Characteristic temperatures which include the glass transition temperature (Tg), the onset of crystallization
(Tx) and the maximum of the exothermic peak corresponding to the crystallization (TC) were measured by
differential scanning calorimetry on the Netzsch DSC Pegasus 404PC apparatus, on glass chunks in a Pt pan at a heating rate of 10°C/min up to 900˚C with a precision of ±2°C for Tg and Tx, the precision for TC is
estimated at ±1°C.
The vitreous state of the samples studied was evaluated by Powder X-ray diffraction (XRD) patterns which were collected on a PANalitycal X'pert PRO MPD diffractometer in Bragg-Brentano θ-θ geometry equipped with a secondary monochromator and X'Celerator multi-strip detector. Each measurement was made within an angular range of 2θ = 8-80°. The Cu-Kα radiation was generated at 45 kV and 40 mA (λ = 0.15418 nm). The partly crystallized Ga40Ge26Na34 was analyzed on the same apparatus with the same conditions.
The density, ρ, was obtained by Archimedes’ method with a Mettler Toledo XSE204 densimeter by using distilled water at room temperature as buoyant liquid. The averaged values (from 4 measurements) are estimated with an error of 0.001g/cm3.
The refractive index was measured by the M-line prism coupling technique (Metricon 2010/M) at 532, 633, 972, 1308 and 1538 nm.
The transmission spectra in the UV-Visible-NIR and the mid-IR ranges were respectively obtained from an Agilent Cary 5000 and a Perkin Elmer Frontier FTIR spectrometers on polished glass discs of about 2.5 mm (for glasses poured in a mold) and 0.7 mm (for glasses pressed between two brass plates). The short wavelength and infrared multiphonon cut-offs are taken from normalized spectra at an absorption coefficient of 10 cm-1.
2-3- Structural characterizations
The Raman spectra were obtained using a Renishaw inVia spectrometer coupled to a Leica DM2700 microscope equipped with a 633 nm laser. No interaction between the sample and the laser beam was observed. IR spectra were recorded on a Vertex 70V (Bruker) vacuum spectrometer equipped with a DTGS
detector and a MID/FIR range beam splitter. Infrared spectra in reflection mode were recorded using an external reflection attachment (Graesby, Specac) with a 12° incidence angle. The complex refractive index of glasses was obtained through Kramers-Kronig analysis of the measured specular reflectance spectra, and this allowed for the calculation of the absorption coefficient spectra [24].
71Ga magic-angle spinning (MAS) nuclear magnetic resonance (NMR) spectra of ground glass samples were
collected on a Bruker Avance II 900 (B0 = 21.1 T) with a 1.3 mm Bruker MAS probe. Quadrupolar echo
[26] experiments were done using 90°-90° excitation (νrf = 250 kHz) synchronized with a single rotor period
during sample spinning at 62.5 kHz. A recycle delay of 1 second was used - verified to be sufficient for full relaxation - to collect 8k co-added transients. Chemical shifts were referenced to a 1M Ga2(SO4)3 solution
at 0 ppm.
Spectral lineshapes were fit using DMFit2015 [26] employing the “CZSimple” model, which is a simplified version of the Czjzek distribution of chemical shifts and quadrupolar parameters. The critical exponent in the Czjzek distribution was set to 5, which corresponds to the Gaussian Isotropic Model [27] implying a statistical distribution of charges around the observed nucleus. First-order spinning sidebands were approximated using Gaussian peaks separated by twice the spinning frequency. Uncertainties were conservatively estimated by altering a given parameter and manually adjusting other parameters through chemically sensible ranges to try to compensate for the observed peak shape changes.
Density functional theory (DFT) calculations have been performed on small sized clusters. After geometry optimizations of the clusters, harmonic vibrational frequency calculations were achieved in order to obtain the IR and Raman spectra of the so obtained stable structures. Prior to any geometry optimizations, the dangling bonds originating from singly bonded oxygen atoms were neutralized by adding hydrogen-like atoms with masses equal to germanium to provide better agreement between calculated and experimental vibrational frequencies. Qualitative vibrational assignments were made by visualizing the atom displacement vectors for each mode likely responsible for experimental IR and Raman bands. In addition, a potential energy distribution (PED) analysis was performed to also quantify the contribution of internal coordinates to a specific vibrational mode. Both geometry optimization and harmonic vibrational frequency
calculations were carried out using the three-parameter hybrid B3LYP exchange-correlation functional [28, 29] associated with the 6-311++G(3df,2p) basis set. The Gaussian09 software package [30] was used for all computations.
3- Results
3-1- Physico-chemical properties
In order to have a better understanding of the evolution of the properties and structure of the Ga-rich GaO3/2
-GeO2-NaO1/2 glasses, their Na/Ga ratio was varied while their GeO2 content was fixed at 25 mol.%. The
theoretical and experimental compositions as well as the composition labels are reported in Table 1. It is worth noting that the labels employed here are based on the experimental compositions to enable a better accuracy for interpreting and discussing the properties-structure relationship. The compositions can be represented on a ternary diagram (Figure 1) following a specific line toward an increase of the GaO3/2
content. One can notice in Table 2 that the material aspects differ depending on the quenching technique (and thus the cooling speed). The appearance of the glasses is different specifically for the composition with the highest Na/Ga ratio (which corresponds to a low gallium oxide content - Ga30Ge23Na47) that has a clouded
aspect on the surface and for the composition in the lowest Na/Ga ratio (corresponding to a high GaO3/2
content – Ga40Ge25Na34) which shows crystallized areas.
The characteristic temperatures (transition temperature, onset of crystallization, maximum of crystallization and the thermal stability against crystallization) of the glasses are presented in Table 3. It can be seen that the glass transition temperature shows a minimum when Na/Ga ratio is the highest 1.54. Then, the glass transition temperature remains fairly constant with a stable T.
The density of the glasses depending on their gallium oxide content are presented in Table 3 and plotted in Figure 2. One can see a clear increase of the density with an increase of the gallium content and the decrease of the sodium amount. An increase is also well observed for the refractive index at different wavelengths, as listed in Figure 3 and presented in Table 3.
The short wavelength and infrared multiphonon cut-offs were both calculated for an absorption coefficient of 10 cm-1, and reported in Table 3. It can be seen that all the obtained glasses transmit in the infrared up to
5.9 µm while the short wavelength cut-off is minimal for a Na/Ga ratio of 1.05. The transmission in the mid-infrared range is not significantly affected by the variation of the gallium content.
3-2- NMR
The 71Ga MAS-NMR spectra collected at ultrahigh magnetic field and very fast spinning are shown in Figure
4. Dominating each spectrum is a central peak which can be assigned to 4-coordinated gallium, [4]Ga. The
shape of this peak is asymmetric due to a distribution in the second-order quadrupolar interaction, which "smears" the intensity to lower frequency for the larger CQ values within the distribution [27]. This
characteristic shape can be modeled using a Czjzek distribution [27] applicable to half-integer nuclei in isotropically disordered environments. The glass samples having the largest sodium content (i.e., Ga30Ge23Na47, Ga36Ge23Na41 and Ga37Ge24Na39) can be satisfactorily fit by a single tetrahedral gallium site
with NMR parameters typical for tetrahedral gallium in oxides (e.g., δiso = 198 ppm, CQ = 11 MHz, see Table
4) [31]. Even at the fastest accessible spinning rates there is some overlap between the spinning sidebands and the central peak. Because the fitting software does not account for spinning sidebands, these were modelled using Gaussian peaks of approximately the same width as the central peak, separated by twice the spinning frequency, as shown in Figure 5. However imperfect this approach may be, it does not interfere with the most important parts of the lineshape, namely the slope on the low-frequency side of the central peak. For the sodium-poor glass samples (Ga41Ge26Na33 and Ga40Ge26Na34), a single gallium site does not
yield a satisfactory fit to the experimental data (Figure 4 and Figure 5a). Despite extensive spectral overlap, reasonable parameters representing high-coordinate gallium produce a very good fit to the data (Figure 5b). Consistent with previous NMR data of gallate glasses, and considering the relationship between 27Al and 71Ga isotropic chemical shift [32], the putative 5-coordinate Ga should appear in the 100-120 ppm range.
Excellent fits can be obtained by including high-coordinate Ga fractions in glass Ga40Ge26Na34 ranging from
parameters from the glasses having the largest sodium content and adjusting only the high-coordinate Ga peak, a best-fit value of 22% is obtained for Ga40Ge26Na34. Considering that 5- and 6-coordinate Ga are often
found together in amorphous environments, the same spectrum was also fit using reasonable shift and quadrupolar values for [5]Ga and [6]Ga, resulting in amplitudes of 17 and 6% respectively, bringing the total
from the three-site fit into agreement with that of the two-site fit (Table 4 and Figure 5c) [33]. While these numbers are not independently reliable due to extensive spectral overlap, they illustrate that a plausible combination of two high-coordinate Ga species leads to comparable fits as a single high-coordinate site. A similar approach to the analysis of Ga41Ge26Na33 revealed 8% high-coordinate Ga (not shown).
3-3- Vibrational Spectroscopy
3-3-1 IR and Raman spectra analysis
Infrared and Raman spectra of three representative compositions with a Na/Ga ratio ranging from 0.8 to 1.54 are shown in Figure 6. All spectra can be decomposed in three main domains: 200-400, 420-600 and 700-900 cm-1. The high frequency region is composed of two main contributions one at 770 cm-1 mainly
active in IR and observed as a shoulder in Raman, the second is more active in Raman and peaking in the range 830-860 cm-1. In comparison with vibrational responses of tetrahedrally connected glassy networks
such as germanate or silicate, one can attribute the high frequency component to localized symmetric and antisymmetric stretching modes of tetrahedral units Ge-O or Ga-O bonds. At lower wavenumbers, the two envelopes can be attributed to bending modes involving mainly T-O-T bridges (T used for Ge or Ga in a tetrahedral coordination). These bending motions centered at 500 and 300 cm-1 can be attributed to oxygen
motions respectively in the plane and out of the plane formed by a bent T-O-T bridge (similar to scissoring and wagging modes, respectively). When the Na/Ga ratio increases, the main spectral variations observed in Raman occurs in the envelope around 800cm-1 which operates a gradual increase and a shift from 860 to
830 cm-1 of its high frequency contribution. In IR, the main peak slightly shifts towards the higher
wavenumbers from 760 to 785 cm-1. For the lowest Na/Ga ratio, a new contribution appears observed around
To explain these spectral changes, we first refer to the spectra reported in the literature for a germanate network [34, 35], for which both in IR and Raman, one can recognize all the vibrational modes described above. Nevertheless, for a pure GeO2 glass, the high frequency stretching modes are almost inactive in
Raman [36]. The Raman activity in this spectral range is clearly observed upon insertion of modifier elements in the matrix forming non-bridging oxygens (NBOs)[34]. Raman spectroscopy is then commonly used to determine the presence of NBOs in a germanate or silicate glassy network. As an example, for the system GeO2-K2O, the signatures of Q3 and Q2 tetrahedral units (Qn represents tetrahedral units with n the
number of bridging oxygens) are expected at 870 and 770 cm-1 respectively. If in a second step one takes as
reference Raman spectra reported for germano-gallate glasses [37], the stretching modes in the region 700-900 cm-1 are always active. The spectra reported by Henderson et al. [37] also indicate that the aluminum to
gallium substitution, keeping a ratio Na/(Al+Ga)=1, does not affect the Raman activity in the stretching mode region.
3-3-2 DFT modelling of glass vibrational response
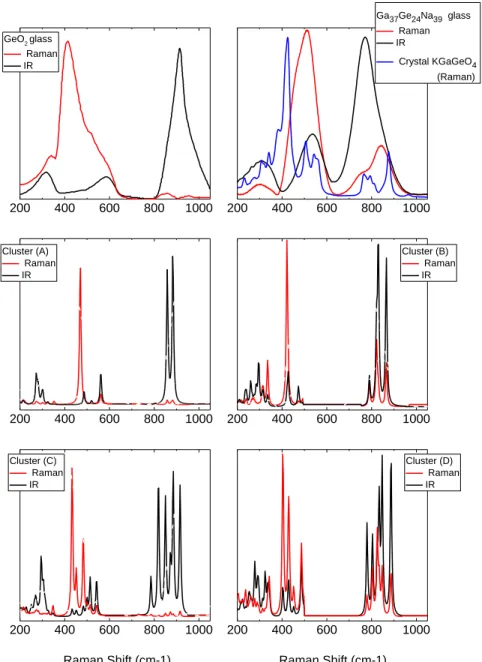
Before interpreting the spectral variations observed upon changing the Na/Ga ratio, we would like to clarify the differences concerning IR and Raman respective activities between germanate and a sodo-germano-gallate system for a ratio Na/Ga=1. In Figure 7, we have compared the IR and Raman responses of two representative glasses (a pure GeO2 glass and a germano-gallate of composition Ga37Ge24Na39) with (i) the
Raman response of a crystalline reference: KGaGeO4 and (ii) results from DFT calculations conducted on
four clusters depicted in Figure 8. Few investigations have been devoted to crystalline KGaGeO4 [38], but
several studies have been reported on isostructural compounds such as KAlSiO4 exhibiting the same
beryllonite-type structure [39]. It consists of [GaO4]- and [GeO4] tetrahedra; each [GaO4]- unit shares corners
with four [GeO4] forming ring arrangements in which alkali cations (K+ or Na+) are inserted and compensate
for the negative charge of gallate tetrahedra. For the DFT calculations, we have started from clusters inspired from the structure of our crystalline reference KGaGeO4: the two first clusters (Figure 8) consist of rings
the addition of two sodium ions to compensate for the charge of the [GaO4]- tetrahedra. Similarly, clusters
(C) and (D) are made of the chaining of 6 tetrahedral units (respectively germanate and mixed germano-gallate with the addition of sodium).
Comparing the Raman signatures of crystalline KGaGeO4 with the germano-gallate glass of composition
Ga37Ge24Na39, a very similar spectral profile is observed, differing mainly in the peak breadth. The localized
stretching modes in the range 700-900 cm-1 have a similar Raman activity in both glassy and crystalline
materials. Focusing on the DFT calculations, the results corroborate the spectral assignment of the three main categories of vibrational modes described above. The frequency correspondence is satisfactory: symmetric and antisymmetric stretching modes of Ge-O or Ga-O bonds forming tetrahedral units are calculated between 780-905 cm-1 which is slightly overestimated for the germano-gallate system and
underestimated for GeO2; the bending modes involving oxygen motions in T-O-T bridges show even better
agreements: the modes calculated for clusters (A) and (C) describe very well both IR and Raman activities of GeO2 glass in the domain 400-600 cm-1. Similarly, good agreement between cluster (B) and the KGaGeO4
crystal Raman spectrum may be observed. Finally, one should notice that the respective Raman/IR activities in calculated spectra for the four clusters are in very good agreement with the experimental observations. It confirms that for a fully interconnected network formed of only germanate tetrahedra, the localized stretching modes are almost inactive in Raman but they largely dominate the IR response, whereas for a mixed GaO4 and GeO4 fully interconnected network all modes appears both IR and Raman active. Changes
of local structural geometries are at the origin of these selection rules variations. Results from DFT calculation evidence strong differences on the atomic charges (Mulliken type) attributed to oxygens involved in the T-O-T chains. For the “GeO2 type” clusters (A) and (C), all oxygen atomic charges are
equivalent within a range of ±5%. For the germano-gallate clusters we observe a relative increase of 56% of the atomic charge for the oxygens in the vicinity of Na+ cations. In addition, the calculated Mulliken
for the germano-gallate clusters ((B) and (D)) which are either 24% lower or 17% higher depending on the sodium location.
Finally, these spectral comparisons provide a link between the entire vibrational response of the glass Ga37Ge24Na39 (ratio Na/Ga=1) and a structure formed of corner-shared interconnected tetrahedra. If
compared to a germanate system, the variations observed are mainly due to a non-uniform charge distribution along the T-O-T chains to compensate for the Na+ charge which locally modifies chains and
tetrahedral geometries at the origin of a global redistribution of the vibrational activity on both IR and Raman responses. If the ratio Na/Ga>1 (see spectrum of the Ga30Ge23Na47 glass in Figure 6, Na/Ga=1.54), the
increase in the Raman band at 830 cm-1 should be linked to the appearance of NBOs in the structure, however
as the rest of the spectral profiles do not vary significantly, a majority of the glassy structure should be considered as an interconnected tetrahedral network. On the other hand, for a ratio Na/Ga<1 (see spectrum of the Ga41Ge26Na33 glass in Figure 6, Na/Ga=0.8), the decrease of the high frequency stretching mode
Raman intensity could be explained by a decrease of the sodium content which tends to homogenize the charge distribution along the T-O-T chains decreasing the Raman activity of the localized stretching modes. Interestingly for the IR response, the new contribution observed around 670 cm-1 is not expected for a
network based on tetrahedral units. However, by analogy with the IR response of the rutile GeO2 crystalline
compound exhibiting a large band centered at 715 cm-1 [35], this spectral variation might be linked to
high-coordinated gallium ions.
4- Discussion
The optical properties, including the cut-off wavelengths and refractive indices of the samples studied here, are only weakly influenced by their structure. The short wavelength cut-off is indeed governed by electronic transitions and the presence of UV-absorbing transition metals impurities, which are expected to be similar in all the prepared samples. On the other hand, the long wavelength cut-off is governed by multiphonon absorption, which is also globally expected to be same in all the studied samples, considering their relatively similar chemical compositions (see Figure 1). The slight increase of the linear refractive indices observed
in Table 3 and Figure 3 (from Ga30Ge23Na47 to Ga41Ge26Na33) can then be directly and simply related to the
increase of gallium with respect to the sodium content, and its consequent increase in glass density. By contrast, the thermal properties are more sensitive to the structural arrangement of the vitreous network as gallium is introduced into the glass.
The key to understanding these structural changes lies in the gallium insertion into the germania network. For the high-sodium glasses (corresponding to a high Na/Ga ratio), 71Ga MAS NMR shows that the gallium
is in four-fold coordination (Figure 4). These spectra are comparable to those typically recorded for AlO4
units, where no NBOs are thought to exist [39]. In accordance with this, vibrational spectroscopy shows that a fully interconnected structure comprising tetrahedral units corresponds well to the IR/Raman signatures for glasses with a Na/Ga close to 1, in which sodium compensates for the negatively charged [GaO4-]
tetrahedral units along the T-O-T skeleton. Thus, one may consider sodium to be acting mainly as a charge compensator for the gallium sites, and Tg remains unchanged for Na/Ga ratios ranging from 0.8 to 1.13
(Table 3). When the Na/Ga ratio increases further (#1.5), the appearance of Q3 units is expected from the
vibrational spectroscopy analysis. By analogy with aluminosilicates, any NBOs are likely to reside on germanate tetrahedra (i.e., Q3 = [GeØ3O-]; Ø corresponds to a bridging oxygen). Although the 71Ga NMR
spectral signature of NBO-bearing GaO4- species has not been documented, the NMR data can be
satisfactorily modeled without considering any additional species, providing partial support for this assumption. This structural description correlates with the variation of the glass transition temperature, which is mainly related to the content of sodium ions in its role as network modifier. This function begins to appear for a Na/Ga ratio above 1.13, and up to 1.5, for which Tg decreases from 620°C to 561°C.
On the other side, once the sodium content is too low to compensate for the charges of all the gallium tetrahedra, the NMR data suggest the formation of high-coordinate (5 or 6) gallium sites, as shown in Figure 5. As it is necessary for the network to stabilize these gallium species, some degree of Ga clustering might be involved, which could lead to gallium-rich regions, and possibly phase separation and crystallization of Ga2O3-like crystalline structures containing octahedral and tetrahedral units [40], [41]. This is consistent
room temperature (see Table 2, XRD data not shown). Two phases (Ga2Ge2O7- ICDD® 00-050-0354and
(Ga2O3)3-(GeO2)2 ICDD® 00-035-0387) were identified on the crystallized portions of the Ga40Ge26Na34
sample, both involving the presence of both 4-fold and higher coordination number Ga ions [42], [43].
5- Conclusion
The gallium-rich region of the ternary GaO3/2-GeO2-NaO1/2 vitreous system was explored through glass
compositions varying as a function of the Na/Ga ratio (ranging from 0.80 to 1.54) for a fixed GeO2 content.
The thermal, physical and optical properties of the obtained glasses were characterized. Vibrational (IR/Raman) and 71Ga MAS-NMR spectroscopic techniques were used to propose a structural model of these
Ga-rich glasses for different Na/Ga ratios. In the compositions studied, the glass network is formed of mixed GeO4 and GaO4 units in which the charge is balanced by sodium ions. For Na/Ga below unity, there are not
enough sodium ions to charge balance all the tetrahedral gallium, which leads to high-coordinate gallium (5- or 6-fold). For Na/Ga above unity, all gallium is in 4-fold coordination, with short-range order consisting of [GeO4], [GeØ3O-] and [GaO4]- units, and sodium ions charge balancing the anionic tetrahedral species.
These structural configurations help explain the variations in some of the bulk properties.
Acknowledgements
This research was supported by the Canada Excellence Research Chair program (CERC) in Photonics Innovations and the Aquitaine Region. The authors are also grateful to the Fonds de Recherche Québecois sur la Nature et les Technologies (FRQNT, N° 097991), the Natural Sciences and Engineering Research Council (NSERC) of Canada, and the Canada Foundation for Innovation (CFI, N° 29191 and 32523) for the financial support. Access to the 21.1 T NMR spectrometer was provided by the National Ultrahigh-Field NMR Facility for Solids (Ottawa, Canada), a national research facility funded by a consortium of Canadian universities, supported by the National Research Council of Canada and Bruker Biospin, and managed by
the University of Ottawa. The research program was also supported by financial support from the French National Research Agency (ANR) in the frame of “the Investments for the future” Programme IdEx Bordeaux – LAPHIA (ANR-10-IDEX-03-02), as well as in the frame of the ANR program N°ANR-17-CE08-0042-01 and the French Region Nouvelle Aquitaine, with the program n° 2016 – 1R10107. We are grateful to Dr Victor Terskikh for valuable assistance with the NMR experiments. Computer time was provided by the “Pôle Modélisation” HPC facilities of the Institut des Sciences Moléculaires UMR 5255 CNRS - Université de Bordeaux, co-funded by the “Nouvelle Aquitaine” region.
Mobilities were supported by the CNRS (LIA LuMAQ) and by grants of the French Consulate in Québec (Frontenac Program), the association of Campus France and Mitacs Globalink.
References
[1] Fukumi, K.; Sakka, S. Raman spectroscopic study of the structural role of alkaline earth ions in alkaline earth gallate glasses,” J. Non. Cryst. Solids, vol. 94, pp. 251–260, 1987.
[2] Sakka, S.; Kozuka, H.; Fukumi, K.; Miyaji, F. Structures of gallate, aluminate and titanate glasses,
J. Non. Cryst. Solids 1990, vol. 123, no. 1–3, pp176–181.
[3] Skopak, T.; Hee, P.; Ledemi, Y.; Dussauze, M.; Kroeker, S.; Cardinal, T.; Fargin, E.; Messaddeq, Y. Mixture experimental design applied to gallium-rich GaO3/2-GeO2-NaO1/2 glasses, J. Non. Cryst.
Solids 2017, vol. 455, pp. 83–89.
[4] Dumbaugh, W. H.; Lapp, J. C. Heavy-Metal Oxide Glasses, J. Am. Ceram. Soc. 1992 vol. 75, no. 9, pp. 2315–2326.
[5] Brawer, S. A.; White, W. B. Raman spectroscopic investigation of the structure of silicate glasses (II). Soda-alkaline earth-alumina ternary and quaternary glasses J. Non. Cryst. Solids 1977 vol. 23, no. 2, pp. 261–278.
[6] Huang, C.; Behrman, E. C.; Structure and properties of calcium aluminosilicate glasses,”J. Non.
Cryst. Solids 1991 vol. 128, no. 3, pp. 310–321,
[7] Maekawa, H.; Maekawa, T.; Kawamura, K.; Yokokawa, T.; 29Si MAS NMR investigation of the Na2O-Al2O3-SiO2 glasses, J. Phys. Chem. 1991 vol. 95, pp. 6822–6827.
[8] Hwa, L.-G.; Hwang, S.-L.; Liu, L.-C.; Infrared and raman spectra of calcium alumino–silicate glasses
J. Non. Cryst. Solids 1998 vol. 238, pp. 193–197,
[9] Higby, P. L.; Aggarwal, I. D. Properties of barium gallium germanate glasses, J. Non. Cryst. Solids, 1993, vol. 163, no. 3, pp. 303–308.
[10] Padlyak, B. V.; Koepke, C.; Wiśniewski, K.; Grinberg, M.; Gutsze, A.; Buchynskii, P. P. Spectroscopic evaluation of the CGG (CaO–Ga2O3–GeO2) glass doped with chromium, J. Lumin. 1998 vol. 79, pp. 1–8.
system,” Radiat. Meas. 2004 vol. 38, pp. 593–597.
[12] Padlyak, B.; Vlokh, O.; Fabisiak, K.; Sagoo, K.; Kuklinski, B. Optical spectroscopy of the Er-doped glasses with 3CaO-Ga2O3-3GeO2 composition, Opt. Mater. (Amst). 2006 vol. 28, pp. 157–161. [13] Bufetov, I. A.; Dianov, E. M. Bi-doped fiber lasers, Laser Phys. Lett., 2009 vol. 6, no. 7, pp. 487–
504.
[14] Cao, G.; Lin, F.; Hu, H.; Gan, F. A new fluorogermanate glass, J. Non. Cryst. Solids, 2003 vol. 326&327, pp. 170–176.
[15] Fan, J.; Tang, B.; Wu, D.; Fan, Y.; Li, R.; Li, J.; Chen, D.; Calveza, L.; Zhang, X.; Zhang, L. Dependence of fluorescence properties on substitution of BaF2 for BaO in barium gallo-germanate glass, J. Non. Cryst. Solids 2011 vol. 357, no. 3, pp. 1106–1109.
[16] Bayya, S. S.; Harbison, B. B.; Sanghera, J. S.; Aggarwal, I. D.; BaO-Ga2O3-GeO2 glasses with enhanced properties, J. Non. Cryst. Solids 1997 vol. 212, pp. 198–207.
[17] Hwa, L.-G.; Shiau, J.-G.; Szu, S.-P.; Polarized Raman scattering in lanthanum gallogermanate glasses, J. Non. Cryst. Solids 1999 vol. 249, no. 1, pp. 55–61.
[18] Murthy M. K.; Emery, K.; Properties and structure of glasses int he systeme M2O-Ga2O3-GeO2 ( M=Li, Na, K), Phys. Chem. Glas. 1967 vol. 8, pp. 26–29.
[19] Srinivasa Reddy, M.; Naga Raju, G.; Nagarjuna, G.; Veeraiah, N.; Structural influence of aluminium, gallium and indium metal oxides by means of dielectric and spectroscopic properties of CaO-Sb2O3-B2O3 glass system, J. Alloys Compd. 2007 vol. 438, no. 1–2, pp. 41–51.
[20] Mckeown, D. A.; Merzbacher, C. I.; Raman spectroscopic studies of BaO-Ga2O3-GeO2 glasses, J.
Non. Cryst. Solids 1995 vol. 183, pp. 61–72.
[21] Whichard, G.; Day, D. E.; Glass formation and properties in the gallia-calcia system, J. Non. Cryst.
Solids 1984 vol. 66, pp. 477–487.
[22] Sakka, F.; Kozuka, S.; Fukumi, H.; Miyaji, K. Structures of gallate, aluminate and titanate glasses,
J. Non. Cryst. Solids 1990 vol. 123, pp. 176–181,.
[23] Zhong, J.; Bray, P. J.; Determination of gallium coordination in cesium gallate glasses by high-resolution pulsed NMR J. Non. Cryst. Solids 1987 vol. 94, pp. 122–132.
[24] Kamitsos, E.I.; Dussauze, M.; Varsamis, C.P.E.; Vinatier, P.; Hamon, Y. Thin Film Amorphous Electrolytes: Structure and Composition by Experimental and Simulated Infrared Spectra J. Phys.
Chem. C 2007 vol. 111, pp. 8111-8119.
[25] Antonijevic, S.; Wimperis, S. Refocussing of chemical and paramagnetic shift anisotropies in 2H NMR using the quadrupolar-echo experiment, J. Magn. Reson. 2003 vol. 164, no. 2, pp. 343–350. [26] Massiot, D.; Fayon, F.; Capron, M.; King, I.; Le Calvé, S.; Alonso, B.; Durand, J.-O.; Bujoli, B.;
Gan, Z.; Hoatson, G. Modelling one- and two-dimensional solid-state NMR spectra, Magn. Reson.
Chem. 2002 vol. 40, no. 1, pp. 70–76.
[27] Neuville, D. R.; Cormier, L.; Massiot, D. Al environment in tectosilicate and peraluminous glasses: A 27Al MQ-MAS NMR, Raman, and XANES investigation, Geochim. Cosmochim. Acta 2004 vol. 68, no. 24, pp. 5071–5079.
[28] Becke, A. D. J. Density‐functional thermochemistry. III. The role of exact exchange" Chem. Phys., 1993 vol. 98, pp. 5648.
[29] Lee, C.; Yang, W.; Parr, R. G. Development of the Colle-Salvetti correlation-energy formula into a functional of the electron density Phys. Rev. B 1988 vol. 37, pp. 785.
[30] Gaussian 09 (Revision A.2 ed.), Frisch, M. J. Inc. Wallingford CT, 2009.
[31] T. Vosegaard, I. P. Byriel, L. Binet, D. Massiot, and H. J. Jakobsen, Crystal structure studies by single-crystal NMR spectroscopy. 71Ga and 69Ga single-crystal NMR of beta-Ga2O3 twins, J. Am.
Chem. Soc. 1998 vol. 120, pp. 8184–8188.
[32] Massiot, D.; Vosegaard, T.; Magneron, N.; Trumeau, D. 71Ga NMR of reference Ga IV , Ga V , and Ga VI compounds by MAS and QPASS, extension of galliumraluminum NMR parameter correlation, Solid State Nucl. Magn. Reson. 1999 pp. 159–169.
[33] Gomez-Cerezo, N.; Verron, E.; Montouillout, V.; Fayon, F.; Lagadec, P.; Bouler, J. M.; Bujoli, B.; Arcos, D.; Vallet-Regi, M. Acta Biomaterialia, 2018 volume 76, pp 333-343.
[34] Furukawa, T.; White, W. B. Raman spectroscopic investigation of the structure and crystallization of binary alkali germanate glasses, J. Mater. Sci. 1980 vol. 15, no. 7, pp. 1648–1662.
[35] Kamitsos, E.I.; Yiannopoloulos, Y.D.; Karakassides, M.A.; Chryssikos, G.D.; Jain, H. Raman and Infrared Structural Investigation of xRb2O·(1 − x)GeO2 Glasses J. Phys. Chem., 1996 vol. 100, pp. 11755-11765.
[36] F.L. Galeener and G. Lucovsky, " Longitudinal Optical Vibrations in Glasses: GeO2 and SiO2" Phys.
Rev. Letter 1976 vol. 37, pp. 1474.
[37] Henderson, G.S.; Brancroft, G.M.; Fleet, M.E. Raman spectra of gallium and germanium substituted silicate glasses: variations in intermediate range order American Mineralogist 1985 vol. 70, pp. 946-960.
[38] Barbier, J; Fleet, M. E.; Investigation of Structural States in the Series MGaSi04, MAIGeO, MGaGeO, (M = Na, K), J. of Solid State Chemistry, 1987 71, pp. 361–370.
[39] Creighton, J.A.; Deckman, H.W.; Newsam, J.M. Computer simulation and interpretation of the infrared and Raman spectra of sodalite frameworks" J. Phys. Chem. 1994 vol. 98, pp. 448-459. [40] Geller, S. Crystal structure of beta-Ga2O3, J. Chem. Phys. 1960 vol. 33, no. 3, pp. 676–684. [41] Bermudez, V. M.; The structure of low-index surfaces of beta-Ga2O3, Chem. Phys., 2006 vol. 323,
pp. 193–203.
[42] Agafonov, V.; Kahn, A.; Michel, D.; Perez y Jorba, M. BRIEF COMMUNICATION : Crystal structure of new digermanate : Al2Ge2O7, J. Solid State Chem. 1986 vol. 62, pp. 402–404.
[43] Meinhold, R. H.; Mackenzie, K. J. D. The system Ga2O3(Al2O3)-GeO2(SiO2) studied by NMR, XRD, IR and DTA, J. Mater. Chem. 2000 vol. 10, pp. 701–707.
Table Captions
Table 1. Studied glass theoretical and experimental compositions in cationic percent (mol.%) with the Na/Ga and the Ga/Ge ratios (corresponding respectively to the ratio of NaO1/2/GaO3/2 and the ratio
GaO3/2/GeO2).
Table 2. Studied glass compositions used quenching technique and observed aspects of the resulting materials.
Table 3. Main characteristics of the Ga-rich GaGeNa glasses studied - Onset of vitreous transition temperature (Tg), Onset of crystallization (Tx), Maximum of crystallization (TC), Thermal stability (ΔT =
Tx-Tg), Density (ρ), Short wavelength cut-off (λUV), IR cut-off edge (λIR) and the refractive index at 532nm
(n532).
Table 4. NMR parameters obtained from lineshape fitting of sodium germano-gallate glasses.
Figure Captions
Figure 1. Representation of the studied glass compositions (each composition has one shape), in purple the theoretical compositions, in yellow the resulting experimental composition. The vitreous domain (in light green) determined by Murthy et al. [42] is as well represented in the GaO3/2-GeO2-NaO1/2 ternary
diagram with the delimited Ga>Ge border.
Figure 2. Density of the studied glasses as a function of their gallium oxide content.
Figure 3. Refractive index at different wavelengths of the studied glasses as a function of their gallium oxide content.
Figure 4. 71Ga MAS-NMR spectra of the sodium germanogallate glasses with overlaid fits (in red) based
on a single 4-coordinate Ga site.
Figure 5. 71Ga MAS-NMR spectrum of Ga
40Ge26Na34 with three modeling scenarios (see text for details):
a) single [4]Ga site, b) a [4]Ga and [5]Ga site, c) [4]Ga, [5]Ga and [6]Ga sites. Red traces represent the overall fit;
blue, green and purple indicate four-, five- and six-coordinate Ga, respectively. See Table 4 for fitting parameters and uncertainties.
Figure 6 a) Raman spectra normalized to the principal band at about 500 cm-1 and b) Infrared spectra of the studied glasses.
Figure 7. Right part, Raman and IR spectra of a GeO2 glass and Raman and IR calculated spectra from
DFT clusters (A) and (C) depicted in Figure 8. Left part, Raman spectra of the crystallized phase KGaGeO4
(blue), Raman and IR spectra of the glass Ga37Ge24Na39 glass and Raman and IR calculated spectra from
DFT clusters (B) and (D) depicted in Figure 8.
Figure 8: DFT cluster defined to compare germanate and sodo-germano-gallate vibrational response and charge distribution within the structure. Cluster (A) and (B). are formed four GeO4 or of a mixed
arrangement of two GeO4 and two GaO4 with the addition of two sodium ions. Similarly, cluster (C) and
(D) are made of the chaining of 6 tetrahedral units (germanate or mixed germano-gallate with the addition of sodium). At the periphery of the clusters, hydrogen-like atoms with masses equal to germanium have been used.
Table 1. Studied glass theoretical and experimental compositions in cationic percent (mol.%) with the Na/Ga and the
Ga/Ge ratios (corresponding respectively to the ratio of NaO1/2/GaO3/2 and the ratio GaO3/2/GeO2).
Sample GaO3/2 (mol.%) GeO2 (mol.%) NaO1/2
(mol.%) Na/Ga Ga/Ge
Theo. Exp.
(±2) Theo.
Exp.
( ±2) Theo.
Exp.
(±2) Theo. Exp. Theo. Exp.
Ga30Ge23Na47 31 30 25 23 44 47 1.42 1.54 ±0.17 1.24 1.30 ±0.20 Ga36Ge23Na41 37.5 36 25 23 37.5 41 1 1.13 ±0.12 1.50 1.57 ±0.22 Ga37Ge24Na39 38 37 25 24 37 39 0.97 1.05 ±0.11 1.52 1.58 ±0.21 Ga41Ge26Na33 44 41 25 26 31 33 0.70 0.80 ±0.09 1.76 1.61 ±0.20 Ga40Ge26Na34 50 40 25 26 25 34 0.50 0.84 ±0.09 2 1.56 ±0.20
Table 2. Studied glass compositions used quenching technique and observed aspects of the resulting materials.
Sample Quenching technique Observations
Ga30Ge23Na47 Pressed between two plates Mainly glassy – some clouded portions
Ga36Ge23Na41 Poured in mold at ambient air Glassy
Ga37Ge24Na39 Poured in mold at ambient air Glassy
Ga41Ge26Na33 Pressed between two plates Glassy
Ga40Ge26Na34 Pressed between two plates Glassy portions – mainly crystallized
Table 3. Main characteristics of the Ga-rich GaGeNa glasses studied - Onset of vitreous transition temperature (Tg), Onset
of crystallization (Tx), Maximum of crystallization (TC), Thermal stability (ΔT = Tx-Tg), Density (ρ), Short wavelength
cut-off (λUV), IR cut-off edge (λIR) and the refractive index at 532nm (n532).
Sample Tg (±2°C) Tx (±2°C) TC (±1°C) ΔT (±4°C) ρ (±0.001g/cm3) λUV (±1nm) λIR (±1µm) n532 (±0.005) Ga30Ge23Na47 561 636 716 89 3.672 324 5.9 1.646 Ga36Ge23Na41 619 722 756 103 3.767 320 5.9 1.657 Ga37Ge24Na39 616 719 776 103 3.786 294 5.9 1.658 Ga41Ge26Na33 620 727 736 103 3.924 337 5.9 1.674
Table 4. NMR parameters obtained from lineshape fitting of sodium germano-gallate glasses. Sample Ratio C N δiso / ppm CQ / MHz FWHM δiso / ppm* Relative Intensity / % Na/Ga Ga/Ge Ga30Ge23Na47 1.54 1.30 4 211 ± 5 13 ± 1 50 ± 10 100 Ga36Ge23Na41 1.13 1.57 4 210 ± 5 13.5 ± 0.8 55 ± 5 100 Ga37Ge24Na39 1.05 1.58 4 210 ± 5 13.5 ± 0.5 55 ± 5 100 Ga41Ge26Na33 0.80 1.61 4 201 ± 5 13.7 ± 1 55 ± 10 92 ± 2 “5” 110 ± 10 >9 >40 8 ± 2 Ga40Ge26Na34 0.84 1.56 4 197 ± 8 13 ± 1 55 ± 10 78 ± 2 “5” 115 ± 10 14 ± 1 >50 22 ± 2 4 197 ± 8 13 ± 1 55 ± 10 77 ± 2 “5” 120 13 >50 17 “6” 70 13 >50 6
Figure 1. Representation of the studied glass compositions (each composition has one shape), in blue purple the theoretical compositions, in yellow the resulting experimental compositions. The vitreous domain (in light green) determined by Murthy
et al. [45] is represented in the GaO3/2-GeO2-NaO1/2 ternary diagram with the delimited Ga>Ge border.
Vitreous domain by Murthy et al.
Figure 2. Density of the studied glasses as a function of their gallium oxide content. 30 32 34 36 38 40 42 3.65 3.70 3.75 3.80 3.85 3.90 3.95
Exp. GaO3/2 content (mol.%)
D e n si ty (g /cm 3 )
Figure 4. 71Ga MAS-NMR spectra of the sodium germano-gallate glasses with overlaid fits (in red) based on a single 4-coordinate Ga site.
Figure 5. 71Ga MAS-NMR spectrum of Ga
40Ge26Na34 with three modeling scenarios (see text for details): a) single [4]Ga
site, b) a [4]Ga and [5]Ga site, c) [4]Ga, [5]Ga and [6]Ga sites. Red traces represent the overall fit; blue, green and purple
indicate four-, five- and six-coordinate Ga, respectively. See Table 4 for fitting parameters and uncertainties.
Ga40Ge26Na34
Ga41Ge26Na33
Ga37Ge24Na39
Ga36Ge23Na41
200 400 600 800 1000 200 400 600 800 1000 200 400 600 800 1000 200 400 600 800 1000 200 400 600 800 1000 200 400 600 800 1000 GeO2 glass Raman IR Cluster (C) Raman IR Cluster (A) Raman IR Cluster (D) Raman IR Cluster (B) Raman IR Ga37Ge24Na39 glass Raman IR Crystal KGaGeO4 (Raman) Raman Shift (cm-1) Raman Shift (cm-1)
Figure 7. Right part, Raman and IR spectra of a GeO2 glass and Raman and IR calculated spectra from DFT clusters (A)
and (C). Left part, Raman spectra of the crystallized phase KGaGeO4 (blue), Raman and IR spectra of the glass
Figure 8. DFT clusters defined to compare germanate and sodo-germano-gallate vibrational response and charge
distribution within the structure. Clusters (A) and (B) are respectively formed from four GeO4 or from a mixed
arrangement of two GeO4 and two GaO4 with the addition of two sodium ions. Similarly, clusters (C) and (D) are made of
the chaining of 6 tetrahedral units (respectively germanate and mixed germano-gallate with the addition of sodium). At the periphery of the clusters, hydrogen-like atoms (in white) with masses equal to germanium have been used.