HAL Id: hal-01965448
https://hal-amu.archives-ouvertes.fr/hal-01965448
Submitted on 26 Dec 2018
HAL is a multi-disciplinary open access
archive for the deposit and dissemination of sci-entific research documents, whether they are pub-lished or not. The documents may come from teaching and research institutions in France or abroad, or from public or private research centers.
L’archive ouverte pluridisciplinaire HAL, est destinée au dépôt et à la diffusion de documents scientifiques de niveau recherche, publiés ou non, émanant des établissements d’enseignement et de recherche français ou étrangers, des laboratoires publics ou privés.
High-Resolution Near-Edge X-ray Absorption Fine
Structure Study of Condensed Polyacenes
M. Rocco, M. Häming, C. de Moura, Mario Barbatti, A. Rocha, A. Schöll, E.
Umbach
To cite this version:
M. Rocco, M. Häming, C. de Moura, Mario Barbatti, A. Rocha, et al.. High-Resolution Near-Edge X-ray Absorption Fine Structure Study of Condensed Polyacenes. Journal of Physical Chemistry C, American Chemical Society, 2018, 122 (50), pp.28692-28701. �10.1021/acs.jpcc.8b08945�. �hal-01965448�
High-Resolution NEXAFS Spectra of Condensed
Polyacenes
M. L. M. Rocco1,*, M. Häming2, C. E. V. de Moura3, M. Barbatti3, A. B. Rocha1, A. Schöll2, and E. Umbach2 1 Universidade Federal do Rio de Janeiro, Instituto de Química (Rio de Janeiro, Brazil)
2 Universität Würzburg, Experimentelle Physik II (Würzburg, Germany) 3 Aix Marseille Univ, CNRS, ICR (Marseille, France)
1. Abstract
We present a systematic study of high-resolution NEXAFS spectra of well-ordered films of condensed benzene and polyacenes, namely naphthalene, anthracene, tetracene, and pentacene. An increased spectral complexity with increasing molecular size is observed: NEXAFS features decrease in intensity and moves to lower photon energy (redshift), as the size of the aromatic system grows. Moreover, a second group of transitions arises. The dichroism in the C K-edge spectra increases with the molecular size. While benzene molecules are randomly oriented, the polyacenes are preferentially lying flat with increasing molecular size. Vibrational fine structures coupled to the C 1s π* transitions are apparent for all investigated molecules. The energy position of the onset of the first resonance decreases from 284.86 eV for benzene to 283.26 eV for pentacene. Calculations of absolute band envelopes with TDDFT followed by the analysis of the transition densities were performed for the whole series of molecules, revealing the nature of the spectroscopic features.
*Corresponding author. Tel.: +55-21-3938-7786; fax: +55-21-3938-7265. E-mail address: luiza@iq.ufrj.br (M.L.M. Rocco).
2. Introduction
As part of a systematic study of high-resolution PES (photoemission) and NEXAFS (near-edge x-ray absorption fine structure) applied to large organic molecules,1-3 we have measured the C1s
photoabsorption spectra of benzene and polyacenes (naphthalene, anthracene, tetracene, and pentacene) condensed on Ag(111) at two different incidence geometries. This class of π-conjugated molecules is not only of fundamental interest,4 but also has some potential for applications in organic
electronic devices due to the high charge carrier mobility in their crystalline phase. For instance, several studies on the performance of pentacene- and derivative-based OFETs showed that it is strongly dependent on the molecular order and film morphology,4-7 which in turn are significantly related to the
processing conditions used to deposit the material onto the substrate surface.4 Tetracene, the four-ring
polyacene, was also investigated because it is also interesting with regard to the fabrication of organic field effect transistors.8 Given the relevance of the polycyclic aromatic hydrocarbons, it is worth
understanding their electronic structure, reorganization upon photoexcitation, and ordering which can be better pursued by a systematic study of a series of similar molecules of different size. Hence, starting from benzene, one can monitor the effect of adding more benzene rings on the electronic structure. The development of high spectral resolution NEXAFS has led to new insight into vibrationally-resolved condensed molecules.2, 3, 9-13 These investigations are complemented by theoretical simulations of inner
shell absorption spectra, including absolute band shapes and analysis of transition probabilities. The theoretical calculation of NEXAFS data including the vibrational features is still not straightforward, 14-16 in particular for larger molecular compounds. For the naphthalene molecule, these effects were
evaluated by the calculation of the Franck-Condon factors using numerical gradients of the excited state.17
In the present work, we employ the nuclear ensemble approach,18, 19 which is the most straightforward
method able to deliver band envelops (although without vibrational resolution) and estimate dark vibronic features. Conjugated to the Restrict Excitation Window Time-Dependent Density Functional
Theory20 (REW-TDDFT), this approach yielded a remarkable agreement with the NEXAFS results,
allowing to rationalize the electronic transitions in this series of molecules.
Several electronic structure methods were previously applied to investigate the excited core states of polyacenes. The static-exchange (STEX) method, which is a Configuration Interaction with Single excitations (CIS) using a Hartree-Fock wave function of the average between the ground and the core-ionized state, was applied to polyacenes molecules by Ågren's et al.21 and in a more detailed
investigation of the pentacene.22 Other constrained optimization procedures were applied to obtain the
core-ionized species used as a reference for the CI to describe these excited states.10, 23, 24 Approaches
based in the Density Functional Theory (DFT) were also explored, like those based on TDDFT25, 26 or
even applying more detailed procedures, like taking Slater’s transition states27, 28 or applying the ∆DFT
using double-basis17 to recover the electronic relaxation effects. Our choice of the electronic structure
method in the present work was given by its versatility to calculate the hundreds of single-geometry points needed to the Nuclear Ensemble method without losing relevant aspects related to the description of the electronic correlation of the excited states in these molecules29.
Moreover, we provide an extensive analysis of the transition density of the states composing the first two bands of the polyacenes. This analysis tells precisely the differences between these bands in terms of electron and hole localization in inequivalent carbon atoms.
3. Experimental Details
High-resolution photoabsorption spectra of condensed films of benzene, naphthalene, anthracene, tetracene, and pentacene condensed on Ag(111) were recorded at the UE52-PGM undulator beamline of BESSY. An energy resolving power (E/DE) better than 14000 at the nitrogen K-edge could be demonstrated with a photon flux of about 3 x 10¹⁰ph/s/100 mA (fixed-focus constant cff=
10, exit slit 20 mm). Energy calibration and intensity normalization have been carefully considered and optimized.11
The beamline is equipped with an ultra-high vacuum spectroscopy chamber with a SCIENTA R4000 electron energy analyzer for photoemission experiments and a retarding field analyzer for partial electron yield detection. The Ag(111) crystal was cleaned by several sputter/annealing cycles. The cleanliness of the substrate and the absence of adsorbates were verified by the absence of O1s and C1s PES signals. The molecular thin films were prepared by organic molecular beam deposition onto a cooled silver single crystal. The crystal temperature was dependent on the molecule and varied from 100K for benzene, naphthalene, and anthracene to 160 and 180 K for tetracene and pentacene, respectively. The dichroism of the molecular films was checked by NEXAFS with p- and s-polarized light. For benzene, the total electron yield method was employed while for the other molecules the partial electron yield signal was used with 150 V retarding voltage.
Commercially available materials of high purity were purchased from Aldrich and were directly used without further purification. All samples were checked carefully for radiation damage during data acquisition. Especially for the lighter molecules (benzene and naphthalene), significant degradation could be detected for too long acquisition times at a fixed sample position. Therefore, the acquisition was performed at different sample positions such that even traces of degradation were avoided.
4. Computational Details
Quantum-mechanical calculations for the inner-shell excited states of polyacenes were done by REW-TDDFT.20 Through this method, electronic correlation effects can be taken into account at a
relatively low computational cost. The excitation window contains all molecular orbitals mainly formed by 1s atomic orbitals of carbon atoms. This kind of approximation for core states inserts a negligible error in the calculated energies and intensities when compared with full excitation window, as previously shown to small molecules by Asmuruf et al.25 The procedure also takes advantage of
obtaining excitation energies and their respective intensities in a single calculation process. In other more accurate methods, like IS-MCSCF, these values are obtained in different steps.30, 31
In this work, we applied the functional ωB97XD, developed by Head-Gordon and coworkers.32
This is a robust, range-separated hybrid functional, which includes empirical dispersion corrections, and presents good results for local excited states as for charge transfer processes.33 A minimally
augmented version of Alrich’s Def2 double-zeta basis set (ma-Def2-SVP) was employed in all calculations.34, 35 This variant set contains diffuse s and p basis functions on non-hydrogenic atoms,
which results in an accuracy improvement to describe excited states with low computational cost addition.
Absorption spectra were computed with the nuclear ensemble approach. In this approach, the ground-state vibrational distribution of the molecule is sampled, and the spectrum is composed as an incoherent sum of all transitions intensities for each point in the ensemble.18, 19 In this way, the nuclear
ensemble approach allows obtaining the absolute band envelope (without vibrational resolution), including dark vibronic bands. The nuclear sampling was done via a harmonic oscillator Wigner distribution of the nuclear normal modes, sampling 500 geometries for each spectrum. The number of excited states included in the spectrum was equal to twice the number of carbon atoms in the molecule. Thus, we have two electronic promotions from each C 1s orbital, resulting in the description of the two first bands of spectra. Individual transition lines were broadened by a normalized Gaussian function with 0.05 eV width.
All electronic structure calculations presented were done with the Gaussian09 package.36
Spectrum simulations using the nuclear ensemble approach were done with the NEWTON-X package.37
Calculations of transition density descriptors were done using the TheoDORE code.38, 39
5. Results and Discussion
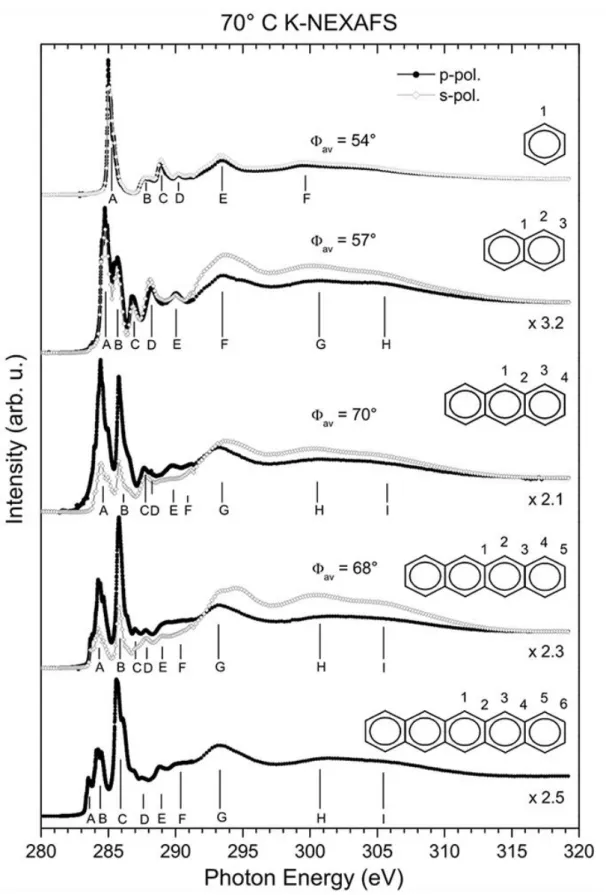
Carbon K-edge NEXAFS spectra for benzene and the series of polyacene molecules, naphthalene, anthracene, tetracene and pentacene, from multilayers on Ag(111) are presented in Figure 1. These molecules have distinct features below the ionization edge, which correspond to electronic transitions into π* orbitals. The larger the molecules are, the more complex the pre-edge structure is. To be able to
compare the spectra between the different molecules, it is necessary to identify and assign the electronic transitions, which was previously done based on theoretical calculations of the C K-edge NEXAFS spectra of polyacenes.21
The C K-NEXAFS of benzene in Figure 1 consists of six noteworthy features (A - F) at 285.0 eV, 287.8 eV, 288.9 eV, 290.2 eV, 293.4 eV, and 299.6 eV. These features contradict the building block picture, which predicts only one π* and one σ* resonance in NEXAFS because of the equivalence of all carbon atoms. Therefore, several theoretical studies have been carried out, corroborating the calculations in Ågren's previous work.21 According to our calculations, peak A corresponds to electronic
transitions into the lowest excited molecular orbital (LEMO), namely C 1s → LEMO (π* e2u). Note that
in Figure 2, it can be observed that feature A has a distinct vibronic fine structure. According to the assignment in literature,10, 40 the 0-0 peak refers to the adiabatic transition, the shoulders α and γ
correspond to a C-H bending and stretching mode, respectively, and peak β can be attributed to a C-C stretching mode. Features B, C, and D at 287.8 eV, 288.9 eV, and 290.2 eV have mixed σ*CC, σ*CH, and
Rydberg character.41-44 Peak D has additional contributions from a C 1s → π* b2g excitation, which can
be considered as a shake-up transition concerning the π* resonance.21 The features E and F, which are
located above the ionization edge, have mainly σ* character.44
The C K- NEXAFS spectrum of naphthalene in Figure 1 is similar to that of benzene but contains more features. Two peaks, A and B, can be resolved in the π* region at 284.7 eV and 285.6 eV, respectively, in contrast to previous works of Hitchcock et al.43, 44 Additionally, the tailing edge of feature
F at 293.4 eV contains a broad shoulder at 295.0 eV, which indicates additional contributions compared to peak E of the benzene NEXAFS. This can be explained by the presence of three chemically different carbon sites in the naphthalene molecule - mid-bottom, end-top, and end-bottom, which are labeled 1, 2 and 3 in the structural formula in Figure 1. Concerning previous theoretical and experimental investigations, the NEXAFS data of naphthalene can be understood to first order as the sum of three benzene-like contributions, which are related to the different atomic sites.10, 21, 43, 44 Peak A has
conventional Self-Consistent Field – Configuration Interaction (SCF-CI) calculations indicate that the C1 1s → LEMO (π*) transition is symmetry forbidden, and that peak B can be assigned to transitions from the C1 1s and the C3 1s level into the LEMO+1.10 The same results were found by the theoretical
approach of Hollauer et al.23 Peak C can be attributed to four electronic transitions, namely to
excitations from C2 1s and C3 1s into the LEMO+2, which is confirmed by the dichroic behavior, and two transitions with σ*-symmetry, C1 1s → LEMO+4 and C2 1s → LEMO+5.27,32,34 Note that the
dichroism of peak D is opposite to that of peak A, B, C and E. Therefore, the dominant contribution to D can be associated with σ*CH excitations. The signature of the C K-NEXAFS above 288 eV is like that of
benzene. Hence, a predominant σ*CC character can be assigned to the features F - H above the ionization
step.45
The general signature of the NEXAFS spectra of the larger polyacene molecules is like that of the naphthalene spectrum. They can also be understood as a sum of benzene-like contributions from different atomic sites. The distinct feature A at low energy can be attributed to C 1s → LEMO excitations at different carbon sites. Note that for all molecules the excitation with the lowest energy is related to the mid-top atom. For anthracene and pentacene, this corresponds to a C1 1s → LEMO transition at carbon atom C1, and for tetracene to a C2 1s → LEMO transition at atom C2.21 The NEXAFS spectra of
the anthracene molecule was also investigated experimental and theoretically, showing the π* character of the electronic transitions of the first two peaks of the spectra.27 As for the larger molecules,
more transitions from chemically different carbon sites contribute to the signal compared to naphthalene, the respective features above 287 eV are less distinct, but it can be assumed that their character is similar to that of the corresponding features in the naphthalene NEXAFS.
Apart from the increasing complexity with increasing molecular size, several other trends can be observed in the polyacene C K-NEXAFS. The dichroism in the C K-NEXAFS also increases with the molecular size, in particular in the π* region. The intensity of the features A and B in the tetracene spectrum decreases strongly when the polarization of the x-rays is changed from p- to s-polarized, whereas the benzene NEXAFS does not depend significantly on polarization. Considering the dipole
selection rule for an optical transition from a radially symmetric orbital into a π* orbital, this observation indicates that the tetracene molecules are lying nearly flat on the surface with an average angle of 68° between the molecular plane and the surface normal.40 This dichroic behavior seen in
Figure 1 suggests that the benzene molecules are randomly oriented and that the polyacenes are preferentially lying flat with increasing size. The average inclination angles derived from the polarization dependence are 54°, 57°, 70° and 68° for benzene, naphthalene, anthracene and tetracene. Note that these average angles refer to the outermost molecules in a thin film of about 20 layers; for the first layer on the Ag substrate, a parallel orientation is rather likely due to the interaction of the molecular π-system with the metallic substrate.
Furthermore, the prominent π* signatures become spread out for larger molecules because of an increasing number of valence levels and inequivalent core sites with increasing molecular size. Additionally, the height of peak A with respect to the height of the ionization edge decreases for increasing molecular size, and the energy position of the onset of the resonance A decreases from 284.86 eV for benzene to 283.26 eV for pentacene, which is indicated in Figure 2. As described above, the prominent feature A in NEXAFS can be attributed to transitions into the LEMO and the resonance with the lowest energy corresponds to excitations at equivalent mid-top carbon sites for all investigated polyacenes — C1 for an odd and C2 for an even number of carbon rings, respectively. Consequently, a decrease in the matrix element and in the excitation energy for the Cmid-top 1s → LEMO transition is
observed with increasing molecular size.
Our theoretical calculations, using REW-TDDFT, focus on the two first excitation bands observed experimentally. The number of excited states for each molecule was taken as twice the number of carbon atoms. As reported by Ågren et al., the first two peaks in the spectra are mainly constituted by core excitations to 𝜋* anti-bonding molecular orbitals.21 Our approach is different since TDDFT with
ωB97XD potential can account can take part of the correlation effects but misses part of the important relaxation effects.
According to recent research, functionals with large Hartree-Fock exchange fraction, like Becke-Half-and-Half-LYP (BHandHLYP), are good options to correct underestimated values for transition energies of core-excited states, when using TDDFT.46 However, an accurate description of the absolute
value for the first transition energy should not be the only criteria when judging whether the electronic structure method is suitable to describe the full inner-shell spectrum. Other factors, like the transition energies of the next states and the transition intensities, are also critical to obtain an accurate complete simulation of the spectrum. These states can, for example, play a role in charge-transfer processes.47, 48
Range-separation corrections are recommended for the description of excited states in polyacenes due to their charge-separating nature.29
Theoretical spectra are shown in Figure 4 at the range of the first transitions at the C K-edge, corresponding to the two main bands observed experimentally. The inner-shell excited states for all molecules are grouped in these two bands by the transition energies. The number of excited states in each band is the same number of carbon atoms in each molecule, once all of them are included in the excitation window. A uniform energy shift of 9.3 eV was applied to all theoretical data to match the experimental values. This shift was established comparing calculated and measured values for the benzene molecule. The STEX, which takes account the effects of the electronic relaxation neglected in the present work, shows a much smaller shift of 2.1 eV. 21 Even so, our deviation is only 3.2 % of the
total transition energy, which can be viewed as a small correction, especially if one recognizes the limitations of TDDFT in this kind of calculation. It can be associated with the underestimation of core orbitals energies by the chosen functional.
As previously mentioned, we also evaluated the vibronic coupling in these systems. For the molecules studied, benzene belongs to the D6h point group of symmetry and the polyacenes to the D2h
point group. Many of the electronic transitions starting from core orbitals are symmetry forbidden in equilibrium geometry. However, they are vibronically allowed. By considering the vibrational movement of these molecules, the intensity of the corresponding transitions can be determined. To do this, we use the nuclear ensemble approach for spectrum simulation,18, 19 which obtains the absolute
intensities, as well the spectral widths, including these dark vibronic bands by computing transition intensities for asymmetric nuclear geometries sampled around the ground state minimum.
The experimental spectra show two particular aspects depending on the number of aromatic rings: a displacement of the first band to lower energies, and an increase in the intensity of the second band. Both aspects are well described by our calculations. A direct comparison between the experimental and theoretical spectra (Figure 2 and Figure 4) shows good agreement taking the vibronic shape of the photoabsorption peaks into account.
In Figure 4, we also compare the simulated spectra using the Nuclear Ensemble method (full lines) and those obtained by simply convoluting the vertical transitions with Gaussian functions (dashed lines). In the latter approach, an empirical bandwidth of 0.30 eV was employed for each transition and the heights were taken proportional to the oscillator strength. In the Nuclear Ensemble case, absolute bandwidths and heights are obtained as result of including vibronic effects. Therefore, although the spectral band shapes obtained by both approaches are roughly similar for each molecule, the vibronic effects introduced by the nuclear ensemble approach mostly remarkably impacts the relative intensity between the second and the first bands of each molecule. Along the series, as the molecular size grows, the relative intensity of the second band rises. This effect is completely missed by the simple Gaussian convolution.
The features of the electronic spectra can be theoretically explored in more detail by the analysis of the transition density in the electronic excitations. Therefore, we applied the ΩAB correlation descriptor, proposed by Plasser et al.49 For two given fragments A and B of a molecule, which do not
need to be different from each other, the value of these descriptors represents the probability of finding the excited electron on fragment B while the hole is on fragment A. It is defined by the equation
ΩAB= ∫ ∫ 𝛾𝑙(𝑟ℎ, 𝑟𝑒) 𝑑𝑟𝑒 𝑑𝑟ℎ
B A
where𝛾𝑙 is the one-electron transition density matrix of the electronic transition 𝑙, given in terms of the
coordinates of the excited electron and hole 𝑟𝑒 and 𝑟ℎ, respectively. Calculations of these descriptors were done to ground state minimum geometries.
We start our discussion using the ΩAB descriptor applied to the anthracene molecule. The best way to evaluate these results is using the electron-hole correlation plots, as shown in Figure 5. To explain these plots briefly, the horizontal and vertical axes are related to the position of the hole and the promoted electron in the molecule, respectively, and the color intensity indicates the relative value of the ΩAB descriptor in that position. The choice of the molecular fragments was done by following the equivalent carbon sites, as labeled in the structural representation of the molecules in Figure 1, including the hydrogen if it exists. The independent squares shown are correlated to each pair of symmetric molecular fragments that compose the carbon sites. To summarize the graphical presentation, we chose only two transitions from each of the four carbon sites; each transition belongs to one band of the spectra. The upper row of Figure 5 contains the plots of excited states related to the first excitation band and the lower row those related to the second band.
The first feature that can be noted in all correlation plots of Figure 5 is the strong localization of the hole, as derived from the well-defined structure in columns, which should be expected for core states. The position of the promoted electron in turn shows a different behavior when comparing the transitions from both bands. In the first band, the values for the highest correlation are found for the
mid-top and end-top carbon sites (C1 and C3 atoms, respectively). In contrast, the transitions from the
second band show the highest correlation for the mid-bottom and end-bottom sites (C2 and C4 atoms, respectively). In this way, it is possible to describe the particular transition probability and electron distribution in the excited state of each absorption band.
To extend this electron-hole correlation analysis to the other polyacene molecules in this work, we condense the plots for the absorption bands using the sum of the ΩAB correlation values over all states. In this way, we obtained correlation plots of each band, instead of each transition, which is shown in Figure 6. In all cases, the correlation plot of the first band has higher values of ΩAB when promoting
electrons to the top carbon sites, while the second band has these values over the bottom sites. We notice that this is consistent with the previous analysis of the single transitions of anthracene as well as with those of all studied molecules provided in the Supporting Information.
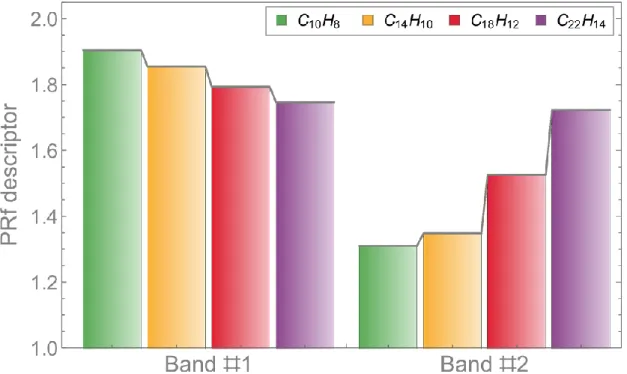
Many other descriptors can be obtained using the ΩAB correlation descriptor. In the present work,
we explore its application to quantify the delocalization of the electronic transition. For this purpose, we applied the partition ratio (PR) descriptors PRi and PRf, which are related to the hole and the electron (i.e., the initial and final state) delocalization.49 These delocalization descriptors are given by
PRi = (∑ABΩAB) 2 ∑ (∑ ΩA B AB)2 PRf = (∑ABΩAB) 2 ∑ (∑ ΩB A AB)2
To compare the values of these descriptors for the polyacenes, we gather the results for all electronic transitions of each absorption band. To simplify this analysis, we split the molecular systems in only two fragments, separating the top and bottom carbon sites including the related hydrogens atoms. By the strongly localized nature of the hole in core-shell states, the values of PRi are all very close to 1.0 (i.e., entirely localized on the fragment) and hence are omitted here. The values for the mean of PRf descriptors of each band are shown in Figure 7. As the PRf descriptors quantify the delocalization over two fragments, these values are close to 2.0 if the electron is delocalized over both fragments. The results show that the transitions of the first band have a more delocalized character that decreases somewhat with increasing molecular size. In contrast, the transitions of the second band are localized for small molecules but become increasingly delocalized as the molecular size grows.
The particular transition properties of each absorption band, as well as the changes of the intensities of the second band, can also be derived using the Natural Transition Orbitals (NTOs) related to their excited states.50 This method enables a concise representation of the electronic density
transition matrix, simplifying the interpretation by the representation of a natural transition orbital to the hole and another to the promoted electron. The nature of electronic transitions related to each of
the two bands is slightly different in the cases considered here, as can be seen in Figure 3. Both bands are composed of transitions from carbon 1s atomic orbitals to antibonding 𝜋* orbitals. These results agree with the assignments by Ågren et al.21, whose calculations found strong transitions into 𝜋*
orbitals. The main characteristics of these transitions can be described by the NTOs. The first band is formed by excitations to NTOs distributed over all carbon atoms, even though it is mainly over mid-top carbon sites, while in the second band excitations happen to be more concentrated orbitals over
mid-bottom and end-mid-bottom sites. The intensity of the second band is more affected by the number of
aromatic rings than the intensity of the first one.
Another interesting aspect concerning the electronic structure of the polyacene molecules is provided by the split of the inner-shell excitations into two bands. NTOs obtained for excited electrons in benzene are quite similar to the degenerated e2u LUMO orbital of this molecule. Similarly, they
resemble the first two unoccupied orbitals, i.e., b1g and b2g. The symmetry reduction from D6h to D2h
when the number of aromatic rings grows from benzene to the polycyclic molecules can also be noticed in the experimental spectra by the increase in the number of bands. These assignments are in agreement with those obtained for pentacene using STEX.22
At last, one feature of the spectra is not adequately explained by our theoretical approach. In the experiment, the intensity of the second band increases with the size of the molecule, but the intensities of first bands decrease, which is not observed theoretically. This inconsistency results from a limitation of the electronic structure method applied. Core states have very singular properties and the ωB97XD functional was optimized using data like energies from atomization processes and chemical reactions, aiming the description of this kind of chemical features. The absence of explicit relaxation of the orbitals can also contribute to this failure. Other procedures within the DFT framework, for instance, applying the Perdew-Burk-Ernzerhof (PBE) and its gradient-corrected revised version (rPBE), can predict the decreasing trend, although a higher accuracy is still desirable.27, 28 The shift of the absolute transition
energies, previously commented in this paper, had less influence. We notice from the analysis of the NTOs shown in Figure 3 that the excited states that constitute the first bands are more spread over the
molecule. This means they have some charge-transfer character, once the electron is promoted from strongly localized C 1s orbitals. In this way, specific range-separated parameters should be improved to obtain the correct description of these states. A promising approach was published by Besley et al. using independent parameters for the short and the long range which are, respectively, more relevant for core electrons and excited delocalized states.51
6. Conclusions
A systematic study of high-resolution NEXAFS spectra of relatively well-ordered films of condensed benzene and some polyacenes, namely naphthalene, anthracene, tetracene, and pentacene were conducted. The NEXAFS features decrease in intensity and move to lower photon energy (redshifted), as the size of the aromatic system grows, in analogy to the optical band gap which is reduced similarly. The dichroism of the C K-edge signal increases with molecular size, while the benzene molecules are randomly oriented in the condensed film the polyacenes are preferentially lying flat on the substrate with increasing molecular size. Vibrational fine structures coupling to the C 1s π* transitions are apparent for all investigated molecules.
In addition, to help in the assignment of the experimental spectra, the theoretical simulation of the spectra and analysis of transition densities for these molecules revealed that there are qualitative differences between the electronic transitions composing the first and second bands, in terms of electron/hole localization properties in inequivalent carbons. Moreover, although the calculations could not perfectly reproduce the relative intensities of the bands, there is a reasonably good agreement between simulations and measurements in what concerns the relative position of the bands, which validate the potential of the current methodology as an effective way to explore inner shell excitations of large molecules.
7. Acknowledgments
M.L.M.R. would like to thank DAAD, CNPq, and FAPERJ for a fellowship grant. A.B.R. and M.L.M.R. acknowledge CNPq for financial support. M.B. and C.E.V.M. thanks the support of the Excellence Initiative of Aix-Marseille University (A*MIDEX) and the project Equip@Meso (ANR-10-EQPX-29-01), both funded by the French Government “Investissementsd’Avenir” program. M.B. also acknowledges funding the WSPLIT project (ANR-17-CE05-0005-01). The experimental work was financed by the German Bundesministerium für Bildung und Forschung under contract 05 KS4 WWC 2. The technical support by the BESSY staff is gratefully acknowledged.
The Supporting Information is composed of sections: Transition energies and oscillator strengths values for carbon K-edge states obtained at TD-wB97XD/ma-Def2-SVP level. Electron-hole correlation plots of the ΩAB matrices for carbon K-edge states: Naphtalene (C10H8); Anthracene (C14H10);
8. Bibliography
1.
Rocco, M. L.; Haeming, M.; Batchelor, D. R.; Fink, R.; Scholl, A.; Umbach, E.,
Electronic relaxation effects in condensed polyacenes: A high-resolution photoemission
study. J Chem Phys 2008, 129 (7), 074702.
2.
Schöll, A.; Hübner, D.; Schmidt, T.; Urquhart, S. G.; Fink, R.; Umbach, E.,
Anharmonicity of the core-excited state potential of an organic molecule from NEXAFS
vibronic fine structure. Chemical Physics Letters 2004, 392 (4-6), 297-302.
3.
Scholl, A.; Zou, Y.; Kilian, L.; Hubner, D.; Gador, D.; Jung, C.; Urquhart, S. G.;
Schmidt, T.; Fink, R.; Umbach, E., Electron-vibron coupling in high-resolution X-Ray
absorption spectra of organic materials: NTCDA on Ag(111). Phys Rev Lett 2004, 93 (14),
146406.
4.
Meyer zu Heringdorf, F. J.; Reuter, M. C.; Tromp, R. M., Growth dynamics of
pentacene thin films. Nature 2001, 412 (6846), 517-20.
5.
Ruiz, R.; Nickel, B.; Koch, N.; Feldman, L. C.; Haglund, R. F.; Kahn, A.; Scoles, G.,
Pentacene ultrathin film formation on reduced and oxidized Si surfaces. Physical Review
B 2003, 67 (12), 125406.
6.
Luo, Y.; Wang, G. Z.; Theobald, J. A.; Beton, P. H., Fractal-compact island transition
and self-limiting growth of pentacene on polymers. Surface Science 2003, 537 (1-3),
241-246.
7.
Breuer, T.; Salzmann, I.; Gotzen, J.; Oehzelt, M.; Morherr, A.; Koch, N.; Witte, G.,
Interrelation between Substrate Roughness and Thin-Film Structure of Functionalized
Acenes on Graphite. Crystal Growth & Design 2011, 11 (11), 4996-5001.
8.
Guo, Y.; Yu, G.; Liu, Y., Functional organic field-effect transistors. Adv Mater 2010,
22 (40), 4427-47.
9.
Schoell, A.; Zou, Y.; Huebner, D.; Urquhart, S. G.; Schmidt, T.; Fink, R.; Umbach, E.,
A comparison of fine structures in high-resolution x-ray-absorption spectra of various
condensed organic molecules. J Chem Phys 2005, 123 (4), 044509.
10. Hübner, D.; Holch, F.; Rocco, M. L. M.; Prince, K. C.; Stranges, S.; Schöll, A.;
Umbach, E.; Fink, R., Isotope effects in high-resolution NEXAFS spectra of naphthalene.
Chemical Physics Letters 2005, 415 (1-3), 188-192.
11. Schöll, A.; Zou, Y.; Schmidt, T.; Fink, R.; Umbach, E., Energy calibration and
intensity normalization in high-resolution NEXAFS spectroscopy. Journal of Electron
Spectroscopy and Related Phenomena 2003, 129 (1), 1-8.
12. Breuer, T.; Klues, M.; Witte, G., Characterization of orientational order in
π-conjugated molecular thin films by NEXAFS. Journal of Electron Spectroscopy and Related
Phenomena 2015, 204, 102-115.
13. Pedio, M.; Doyle, B.; Mahne, N.; Giglia, A.; Borgatti, F.; Nannarone, S.; Henze, S. K.
M.; Temirov, R.; Tautz, F. S.; Casalis, L.; Hudej, R.; Danisman, M. F.; Nickel, B., Growth of
pentacene on Ag(111) surface: A NEXAFS study. Applied Surface Science 2007, 254 (1),
103-107.
14. Karsten, S.; Ivanov, S. D.; Aziz, S. G.; Bokarev, S. I.; Kuhn, O., Nuclear Dynamical
Correlation Effects in X-ray Spectroscopy from a Theoretical Time-Domain Perspective.
15. Karsten, S.; Bokarev, S. I.; Aziz, S. G.; Ivanov, S. D.; Kuhn, O., A time-correlation
function approach to nuclear dynamical effects in X-ray spectroscopy. J Chem Phys 2017,
146 (22), 224203.
16. Norman, P.; Dreuw, A., Simulating X-ray Spectroscopies and Calculating
Core-Excited States of Molecules. Chem Rev 2018, 118 (15), 7208-7248.
17. Minkov, I.; Gel'mukhanov, F.; Friedlein, R.; Osikowicz, W.; Suess, C.; Ohrwall, G.;
Sorensen, S. L.; Braun, S.; Murdey, R.; Salaneck, W. R.; Agren, H., Core excitations of
naphthalene: vibrational structure versus chemical shifts. J Chem Phys 2004, 121 (12),
5733-9.
18. Crespo-Otero, R.; Barbatti, M., Spectrum simulation and decomposition with
nuclear ensemble: formal derivation and application to benzene, furan and
2-phenylfuran. Theor Chem Acc 2012, 131 (6), 1237-14.
19. Barbatti, M.; Aquino, A. J.; Lischka, H., The UV absorption of nucleobases:
semi-classical ab initio spectra simulations. Phys Chem Chem Phys 2010, 12 (19), 4959-67.
20. Lopata, K.; Van Kuiken, B. E.; Khalil, M.; Govind, N., Linear-Response and
Real-Time Real-Time-Dependent Density Functional Theory Studies of Core-Level Near-Edge
X-Ray Absorption. J Chem Theory Comput 2012, 8 (9), 3284-92.
21. Ågren, H.; Vahtras, O.; Carravetta, V., Near-edge core photoabsorption in
polyacenes: model molecules for graphite. Chem Phys 1995, 196 (1-2), 47-58.
22. Alagia, M.; Baldacchini, C.; Betti, M. G.; Bussolotti, F.; Carravetta, V.; Ekstrom, U.;
Mariani, C.; Stranges, S., Core-shell photoabsorption and photoelectron spectra of
gas-phase pentacene: experiment and theory. J Chem Phys 2005, 122 (12), 124305.
23. Hollauer, E.; Prucole, E. D.; Rocco, M. L. M.; Netto, A. D. P.; Scholl, A.; Fink, R.,
Configuration interaction simulation of the NEXAFS photoabsorption spectrum of
naphthalene. J Brazil Chem Soc 2005, 16 (1), 31-36.
24. Gordon, M. L.; Tulumello, D.; Cooper, G.; Hitchcock, A. P.; Glatzel, P.; Mullins, O.
C.; Cramer, S. P.; Bergmann, U., Inner-Shell Excitation Spectroscopy of Fused-Ring
Aromatic Molecules by Electron Energy Loss and X-ray Raman Techniques. The Journal
of Physical Chemistry A 2003, 107 (41), 8512-8520.
25. Asmuruf, F. A.; Besley, N. A., Time dependent density functional theory study of the
near-edge x-ray absorption fine structure of benzene in gas phase and on metal surfaces.
J Chem Phys 2008, 129 (6), 064705.
26. Schmidt, N.; Wenzel, J.; Dreuw, A.; Fink, R. H.; Hieringer, W., Matrix effects in the
C 1s photoabsorption spectra of condensed naphthalene. J Chem Phys 2016, 145 (23),
234307.
27. Klues, M.; Hermann, K.; Witte, G., Analysis of the near-edge X-ray-absorption
fine-structure of anthracene: a combined theoretical and experimental study. J Chem Phys
2014, 140 (1), 014302.
28. Fratesi, G.; Lanzilotto, V.; Floreano, L.; Brivio, G. P., Azimuthal Dichroism in
Near-Edge X-ray Absorption Fine Structure Spectra of Planar Molecules. J Phys Chem C 2013,
117 (13), 6632-6638.
29. Richard, R. M.; Herbert, J. M., Time-Dependent Density-Functional Description of
the (1)La State in Polycyclic Aromatic Hydrocarbons: Charge-Transfer Character in
Disguise? J Chem Theory Comput 2011, 7 (5), 1296-306.
30. Varas, L. R.; Coutinho, L. H.; Bernini, R. B.; Betancourt, A. M.; de Moura, C. E. V.;
Rocha, A. B.; de Souza, G. G. B., Breaking the disulfide chemical bond using high energy
photons: the dimethyl disulfide and methyl propyl disulfide molecules. Rsc Adv 2017, 7
(58), 36525-36532.
31. Tenorio, B. N. C.; de Moura, C. E. V.; Oliveira, R. R.; Rocha, A. B., Transitions
energies, optical oscillator strengths and partial potential energy surfaces of inner-shell
states of water clusters. Chem Phys 2018, 508, 26-33.
32. Chai, J. D.; Head-Gordon, M., Systematic optimization of long-range corrected
hybrid density functionals. J Chem Phys 2008, 128 (8), 084106.
33. Jacquemin, D.; Mennucci, B.; Adamo, C., Excited-state calculations with TD-DFT:
from benchmarks to simulations in complex environments. Phys Chem Chem Phys 2011,
13 (38), 16987-98.
34. Weigend, F.; Ahlrichs, R., Balanced basis sets of split valence, triple zeta valence
and quadruple zeta valence quality for H to Rn: Design and assessment of accuracy. Phys
Chem Chem Phys 2005, 7 (18), 3297-305.
35. Zheng, J.; Xu, X.; Truhlar, D. G., Minimally augmented Karlsruhe basis sets. Theor
Chem Acc 2010, 128 (3), 295-305.
36. Frisch, M. J.; Trucks, G. W.; Schlegel, H. B.; Scuseria, G. E.; Robb, M. A.; Cheeseman,
J. R.; Scalmani, G.; Barone, V.; Mennucci, B.; Petersson, G. A.; Nakatsuji, H.; Caricato, M.;
Li, X.; Hratchian, H. P.; Izmaylov, A. F.; Bloino, J.; Zheng, G.; Sonnenberg, J. L.; Hada, M.;
Ehara, M.; Toyota, K.; Fukuda, R.; Hasegawa, J.; Ishida, M.; Nakajima, T.; Honda, Y.;
Kitao, O.; Nakai, H.; Vreven, T.; Montgomery, J. A.; Jr; Peralta, J. E.; Ogliaro, F.; Bearpark,
M.; Heyd, J. J.; Brothers, E.; Kudin, K. N.; Staroverov, V. N.; Kobayashi, R.; Normand, J.;
Raghavachari, K.; Rendell, A.; Burant, J. C.; Iyengar, S. S.; Tomasi, J.; Cossi, M.; Rega, N.;
Millam, N. J.; Klene, M.; Knox, J. E.; Cross, J. B.; Bakken, V.; Adamo, C.; Jaramillo, J.;
Gomperts, R.; Stratmann, R. E.; Yazyev, O.; Austin, A. J.; Cammi, R.; Pomelli, C.;
Ochterski, J. W.; Martin, R. L.; Morokuma, K.; Zakrzewski, V. G.; Voth, G. A.; Salvador, P.;
Dannenberg, J. J.; Dapprich, S.; Daniels, A. D.; Farkas, O.; Foresman, J. B.; Ortiz, J. V.;
Cioslowski, J.; Fox, D. J. Gaussian09, Revision D.01.
37. Barbatti, M.; Ruckenbauer, M.; Plasser, F.; Pittner, J.; Granucci, G.; Persico, M.;
Lischka, H., Newton-X: a surface-hopping program for nonadiabatic molecular dynamics.
Wiley Interdisciplinary Reviews-Computational Molecular Science 2014, 4 (1), 26-33.
38. Plasser, F.; Wormit, M.; Dreuw, A., New tools for the systematic analysis and
visualization of electronic excitations. I. Formalism. J Chem Phys 2014, 141 (2), 024106.
39. Plasser, F.; Bappler, S. A.; Wormit, M.; Dreuw, A., New tools for the systematic
analysis and visualization of electronic excitations. II. Applications. J Chem Phys 2014,
141 (2), 024107.
40. Ma, Y.; Sette, F.; Meigs, G.; Modesti, S.; Chen, C. T., Breaking of ground-state
symmetry in core-excited ethylene and benzene. Phys Rev Lett 1989, 63 (19), 2044-2047.
41. Puttner, R.; Kolczewski, C.; Martins, M.; Schlachter, A. S.; Snell, G.; Sant'Anna, M.;
Viefhaus, J.; Hermann, K.; Kaindl, G., The C 1s NEXAFS spectrum of benzene below
threshold: Rydberg or valence character of the unoccupied sigma-type orbitals. Chemical
Physics Letters 2004, 393 (4-6), 361-366.
42. Yokoyama, T.; Seki, K.; Morisada, I.; Edamatsu, K.; Ohta, T., X-ray absorption
spectra of poly-p-phenylenes and polyacenes: localization of π orbitals. Physica Scripta
43. Hitchcock, A. P.; Pocock, M.; Brion, C. E.; Banna, M. S.; Frost, D. C.; McDowell, C.
A.; Wallbank, B., Inner shell excitation and ionization of the monohalobenzenes. Journal
of Electron Spectroscopy and Related Phenomena 1978, 13 (3), 345-360.
44. Hitchcock, A. P.; Fischer, P.; Gedanken, A.; Robin, M. B., Antibonding σ* valence
MOs in the inner-shell and outer-shell spectra of the fluorobenzenes. The Journal of
Physical Chemistry 1987, 91 (3), 531-540.
45. Robin, M. B.; Ishii, I.; Mclaren, R.; Hitchcock, A. P., Fluorination Effects on the
Inner-Shell Spectra of Unsaturated Molecules. Journal of Electron Spectroscopy and Related
Phenomena 1988, 47 (C), 53-92.
46. Besley, N. A.; Noble, A., Time-dependent density functional theory study of the
X-ray absorption spectroscopy of acetylene, ethylene, and benzene on Si(100). J Phys Chem
C 2007, 111 (8), 3333-3340.
47. Garcia-Basabe, Y.; Marchiori, C. F. N.; de Moura, C. E. V.; Rocha, A. B.; Roman, L. S.;
Rocco, M. L. M., Charge Transfer Dynamics and Molecular Orientation Probed by Core
Electron Spectroscopies on thermal-annealed Polysilafluorene Derivative: Experimental
and Theoretical Approaches. J Phys Chem C 2014, 118 (41), 23863-23873.
48. Garcia-Basabe, Y.; Kladnik, G.; Marchiori, C. F. N.; de Moura, C. E. V.; Floreano, L.;
Rocha, A. B.; Roman, L. S.; Morgante, A.; Cvetko, D.; Rocco, M. L. M., Additive Driven
Increase in Donor-Acceptor Copolymer Coupling Studied by X-ray Resonant
Photoemission. J Phys Chem C 2017, 121 (45), 25187-25194.
49. Plasser, F.; Lischka, H., Analysis of Excitonic and Charge Transfer Interactions from
Quantum Chemical Calculations. J Chem Theory Comput 2012, 8 (8), 2777-89.
50. Martin, R. L., Natural transition orbitals. The Journal of Chemical Physics 2003, 118
(11), 4775-4777.
51. Besley, N. A.; Peach, M. J.; Tozer, D. J., Time-dependent density functional theory
calculations of near-edge X-ray absorption fine structure with short-range corrected
functionals. Phys Chem Chem Phys 2009, 11 (44), 10350-8.
9. Figures
Figure 1.C K-NEXAFS of benzene, naphthalene, anthracene, tetracene,and pentacene with 70° angle of incidence from the surface normal. The average inclinations angle between the molecular plane and the surface normal is obtained from the dichroism in the pre-edge. Several peaks are labeled for the discussion in the text.
Figure 2.Blow-up of the pre-edge region of the C K-NEXAFS of benzene, naphthalene, anthracene, tetracene, and pentacene from Figure 1.The grey lines mark the NEXAFS onset.
Figure 3.Natural Transition Orbitals which represent excited electrons for the most intense transitions calculated of each band of the carbon K-edge.
Figure 4.Calculated inner-shell spectra for carbon 1s at TD-ωB97XD/ma-Def2-SVP level with Nuclear Ensemble method (full lines). Vertical lines showsthe transitions obtained at equilibrium geometry, with their spectra representation, using Gaussian functions with 0.30 eV width (dashed lines). All energy values are shifted by 9.3 eV.
Figure 5. Electron-hole correlation plots of the 𝜴𝑨𝑩 matrices for carbon K-edge states in the anthracene (C14H10) molecule.
The upper graphics shows the first excited states for each different carbon site, representing the first excitation band in the spectra, whereas the lower graphics shows it for the second band.
Figure 6. Electron-hole correlation plots of the combined𝜴𝑨𝑩matrices for all carbon K-edge states in each excitation band