HAL Id: cea-02049047
https://hal-cea.archives-ouvertes.fr/cea-02049047
Submitted on 26 Feb 2019HAL is a multi-disciplinary open access
archive for the deposit and dissemination of sci-entific research documents, whether they are pub-lished or not. The documents may come from teaching and research institutions in France or abroad, or from public or private research centers.
L’archive ouverte pluridisciplinaire HAL, est destinée au dépôt et à la diffusion de documents scientifiques de niveau recherche, publiés ou non, émanant des établissements d’enseignement et de recherche français ou étrangers, des laboratoires publics ou privés.
Experimental and simulation study of grain boundaries
in UO2
Emeric Bourasseau, Alexandre Mouret, Paul Fantou, Xavière Iltis, Renaud
Belin
To cite this version:
Emeric Bourasseau, Alexandre Mouret, Paul Fantou, Xavière Iltis, Renaud Belin. Experimental and simulation study of grain boundaries in UO2. Journal of Nuclear Materials, Elsevier, 2019, �10.1016/j.jnucmat.2019.02.033�. �cea-02049047�
Experimental and simulation study of grain boundaries in UO2
Emeric Bourasseau, Alexandre Mouret, Paul Fantou, Xavière Iltis, Renaud C. Belin CEA, DEN, DEC, Centre de Cadarache, 13108 Saint-Paul-lez-Durance, France
Abstract:
EBSD measurements performed on polycrystalline UO2 samples were analyzed to obtain the linear fraction distribution of grain boundaries as a function of their Coincidence Site Lattice (CSL) indexes. In parallel, molecular dynamics simulations of 26 CSL grain boundaries were performed to calculate their formation energies using four different empirical potentials. Comparing calculated formation energies and measured linear fractions allowed us to select the best suited empirical potential for the study of grain boundaries and to evidence a decrease in the formation energy of a given grain boundary when its length fraction increases. Cleavage energies were calculated using the selected potential and the toughness of a grain boundary was estimated, since this property corresponds to the energy needed to open it. An interesting relation is observed: the cleavage energy seems to decrease when the misorientation angle of the boundary increases. Finally, a first step towards the study of non-CSL (i.e. general) grain boundaries was taken by simulating three semi-general grain boundaries built by sticking two halves of CSL boundaries.
Introduction
The fuel used in the current generation of pressurized water reactors (PWRs) is mostly uranium dioxide (UO2). UO2 fuel is a refractory ceramic, used in the form of pellets obtained by a powder metallurgy process, leading to equiaxed grains with a diameter of the order of 10 μm separated by interfaces called grain boundaries. Under irradiation, grain boundaries are strongly affected both by the thermomechanical stress induced by the temperature gradient and by the stress generated by the fission gases gathering at the grain boundaries. These two phenomena possibly induce the breaking of grain boundaries. Depending on the operating regime of the reactor, several phenomena can occur: the formation of macroscopic cracks in normal operation, a fine fragmentation of the fuel during a loss of coolant accident (LOCA), or even a generalized decohesion of grains at the periphery of the pellet in the case of reactivity-initiated accident (RIA). The opening at the grain boundaries can be very significant in accidental situations and needs to be taken into account in the models used in simulation codes as GERMINAL [1] developed in our institute in the PLEIADES numerical platform. This implies to improve the knowledge of grain boundaries properties, selectively depending on the type of boundary. According to the respective orientations of the two crystals forming the boundary, a large variety of grain boundaries coexist in a polycrystalline material, whether special or general.
The parameters that are necessary to characterize a grain boundary are called geometrical degrees of freedom of the grain boundary [2]. Five macroscopic degrees of freedom are sufficient to give a complete description of a grain boundary [3]. In materials science, the “tilt/twist” description is traditionally used to distinguish grain boundaries. A tilt boundary corresponds to a rotation of an angle θ between the two grains, along a rotation axis located in the grain boundary plane. Thus, the
misorientation axis is perpendicular to the boundary plane normal. On the contrary, for a twist grain boundary, the rotation axis is perpendicular to the boundary plane and thus parallel to its normal. Tilt and twist grain boundaries are often referred as “special”. We adopted this nomenclature, but it is worth noting that the use of the term “special” is controversial. In fact, depending on the authors, “special” might also refer to grain boundaries that have “special” properties or CSL grain boundaries (see next paragraph). Any other given orientation of the rotation axis with respect to the boundary plane leads to a “mixed tilt/twist” grain boundary referred here as “general” as opposed to “special”.
A complementary way of describing grain boundaries is to consider the misorientation between the two crystalline networks that the boundary divides by using the Coincidence Site Lattice (CSL) theory. CSL grain boundaries are characterized by a multiplicity index Σ which is defined as the ratio between the crystal lattice site density of the two grains meeting at the boundary and the density of sites that coincide when superimposing both crystal lattices [4,5]. It is generally admitted that grain boundaries with low Σ values have a tendency for low interfacial energy and special properties. However, the principal drawback of the CSL model is that only the orientation relationship between neighboring grains is specified while the grain boundary plane orientation, which is closely associated with atomic scale structures, is neglected [6]. For this reason, the utility of the CSL classification and of the parameter Σ is quite controversial [7]. Nevertheless, it remains a practical way of categorizing special grain boundaries.
In uranium dioxide, according to the type of boundary, data on fracture properties such as fracture stress or toughness are needed. If experimental measurements are common on non-radioactive materials such as metals or yttria stabilized zirconia (YSZ) [8,9], far fewer results are available on UO2 [10]. To our knowledge, measurements of formation energies, toughness, or mechanical properties of grain boundaries in UO2 are not available in the literature.
To fill this lack of data, numerical simulations are a good alternative. To study the properties of grain boundaries of a material using simulation, the good scale is undoubtedly the atomic scale. Where two crystals meet, the crystal lattice is not perfect. At the atomic scale, the interface, i.e. the grain boundary, takes the form of a discontinuity in the stack of atoms and is in fact a complex crystalline defect. In most polycrystalline solids, grain boundaries are very thin (1 to 2 interatomic distances). The disorder, which corresponds to bond breaking and point or extended defects, is inevitable for geometric reasons and generates an excess of energy of several J.m-2. However, the system simulated at this scale must achieve a minimum size to be representative. In the direction normal to the grain boundary, it must be large enough so that the grains modeled on each side have properties close to that of the bulk crystal. Similarly, the size of the system parallel to the grain boundary must be large enough to avoid commensurability problems between the two crystalline lattices in contact [11]. Thus, the minimum required size (a few tens of Å in the 3 directions of space) requires systems containing from several thousand to tens of thousands of atoms. First-principles atomistic methods, such as DFT, are then impossible to use and a "classical" atomistic simulation method that uses empirical potentials to describe the interactions between atoms is required. Even though many empirical potentials are available to calculate the properties of UO2 (see for example [12– 16]), only few papers reporting atomistic simulation results on UO2 grain boundaries are available in the literature. In 2008, Van Brutzel et al. [17] studied 6 grain boundaries using Morelon empirical potential [18]. They calculated the formation energies of the grain boundaries as well as atomic structures and investigated the influence of the presence of a grain boundary on displacement cascades. In 2011, Nerikar et al. [10] studied 3 grain boundaries with the Basak potential [19]. Only formation energies and atomic structures were calculated. In 2014, Zhang et al. [20] compared the energies of two grain boundaries obtained using 9 different potentials, including those of Morelon [18], Basak [19] and Yakub [21]. These authors also studied the intergranular fracture behavior of UO2. Fracture stresses were calculated by applying an elongation to the simulated systems following the dimension normal to the boundary plane. Also in 2014, Chen et al. [22] studied 5 grain boundaries
using the Yakub potential [21]. Thermal resistances were calculated in addition to formation energies. In 2015, Williams et al. [23] studied 6 grain boundaries using their own potential. They reported formation energies and evaluated toughness through the calculation of the cleavage energy. They also investigated the oxygen diffusion near grain boundaries. Again in 2015, Bai et al. [24] used the Basak potential [19] to study 5 grain boundaries. Formation energies were calculated and the thermal migration of grain boundaries was studied. Finally, in 2016, Galvin et al. [25] published a paper where 4 grain boundaries were studied using the Cooper potential [26]. They calculated the formation energies and investigated the diffusivity of helium at the vicinity of the boundaries. Comparing some of these articles is possible since different authors studied identical grain boundaries. The formation energies obtained are always between 0.3 and 3 J.m-2, which is a realistic order of magnitude compared to the energies measured in other systems [8]. It is worth noting that different procedures were used to build and relax grain boundaries. Some authors have used specific codes like GBStudio [27] or Metadise [28]. In some cases, a simple 0 K energy minimization was performed [10,20,24] whereas, in other cases, a more complex procedure was applied involving molecular dynamics relaxations at various temperatures (300 K [17], 1500 K [25], 2000 K [22], and even 3000 K [23]). These differences may explain why calculated energies values are scattered. As an example, Williams obtains energies significantly lower than other authors. The reason might be that the annealing step used to relax the initial configurations is carried out at 3000 K, i.e. close to the melting temperature, therefore inducing a significant modification of the initial system to reach a lower energy state. Thus, it is difficult to ensure that the simulated grain boundaries retained their initial geometric characteristics. Also, for a given grain boundary studied with two different potentials, the energy obtained can be very different. Each potential probably does not describe the interfaces in the same way and a deliberate choice has to be made. Two important conclusions arise from this literature review. First, only few grain boundaries were studied and the results from the literature are too scattered to be used with confidence, so that further calculations are needed. Second, the empirical potential must be chosen carefully based on the comparison of the results obtained with different potentials, but with the same calculation procedure.
To select the best potential, comparing calculations results with experimental data is very valuable. In the literature, the experimental determination of grain boundaries energies frequently involves the use of synthetic bicrystals. Actually, a bicrystal elaborated from two suitably orientated single-crystals is the only system allowing a perfect knowledge of all five geometrical degrees of freedom of a given grain boundary. Such an approach is quite documented on metals [6] but is rare on ceramic oxides such as yttria stabilized zirconia [8,29].
To our knowledge, experimental determination of energies performed on geometrically defined grain boundaries in UO2 bicrystals is not available. A few articles, however, report the characterization of CSL grain boundaries in UO2 polycrystals by Electron Back Scattered Diffraction (EBSD).
Nerikar et al. [10] determined by EBSD grain sizes, grain boundaries misorientation and distribution on 2D orientation maps comprising 150 to 200 grains. They compared the number fraction of individual CSL grain boundaries obtained from the misorientation data collected manually with the length fraction statistics provided by the EBSD software. They observed that length fractions are more consistent than number fractions to estimate the occurrence of a given grain boundary. This discrepancy between length fraction and number fraction analysis is well known in various materials, e.g. metals such as Nickel-based alloys [30]. According to the authors, 16% of the UO2 grain boundaries were CSL boundaries. Among these special boundaries, a higher concentration of Σ9 was observed, compared to Σ3, Σ5, and Σ11 fractions (the Σ9 grain boundary was the most abundant and represented 18% of all CSL boundaries). This result was attributed to a microstructural evolution, limited by kinetic processes. However, due to the relatively small size of the EBSD maps, these results must be taken with caution. It is also worth noting that, with 2D-EBSD, CSL grain boundaries can be
identified and their character determined (sigma index and misorientation angle) but determining the atomic structure of the grain boundary (plane orientation and rotation axis), which is necessary for understanding material properties, is not possible and requires 3D experimental techniques.
A follow-up to Nerikar’s work was published by Rudman in 2013 [31]. Two samples (UO2 and UO2.14) were studied to better understand the effect of oxygen stoichiometry on the microstructure. In a first step, 2D-EBSD maps were analyzed, each composed of about 30 grains. The stoichiometric sample had more grains than the UO2.14 sample. According to the authors, this result shows that the hyperstoichiometric structure is closer to the equilibrium than the stoichiometric one. This assertion is based on the assumption that in an ideal 2D structure, each grain should be composed of six linear boundaries that meet at 120° junctions. In terms of CSL grain boundaries, the results are similar for both samples with ~ 20% of CSL linear fractions, the stoichiometric sample exhibiting a higher fraction of Σ3 and Σ9 grain boundaries. These results are different from those of Nerikar’s work. However, due to an even more limited number of grains composing the 2D maps, we believe that these results must also be taken with great caution, as they clearly are not representative enough of the sample microstructure at a larger scale. In fact, the real interest of Rudman’s work stands in the 3D characterization of grain boundaries with 3D-EBSD. Samples were serial sectioned using a SEM equipped with a focused ion beam. Slices were spaced by 0.5 µm for UO2.14 and 0.33 µm for UO2 and ~ 80 slices per sample were analyzed. The 3D reconstruction of the volume analyzed allowed gaining access to the orientations of grain boundaries planes. In both samples, no {111} planes were present in the 30 to 50° range. For the stoichiometric sample, most planes in this angular range were close to {112} and {113} while, for the hyperstoichiometric sample, they were close to {011} and {113}. Such a work helps in knowing which planes are more favorable. This approach is original and, to our knowledge, it is the only experimental 3D characterization of grain boundaries in UO2 available in the literature.
In the present work, we investigated grain boundaries in UO2 by measuring the length fraction of different CSL grain boundaries, on large EBSD maps acquired on seven different UO2 pellets batches. We represented their distribution as a function of their sigma index and of their misorientation angle. The occurrence of each type of grain boundary was then compared to the formation energies calculated with various empirical potentials. In parallel, we studied 26 different grain boundaries of UO2 and compared 4 empirical potentials among the more recent and/or the more used, i.e. that of Morelon et al. [18], Yakub et al. [21], Potashnikov et al. [15] and Cooper et al. [26].
Samples and experimental measurements
Seven UO2 polycrystalline samples (labelled A to G) coming from seven different fabrication batches were characterized in the present work. All of them were manufactured in the “Laboratoire UO2” of the CEA Cadarache, except the sample E, which comes from an industrial batch. A classical powder metallurgy process was used. Depending on the batch/sample, some parameters varied, such as if a preliminary milling of the powder before pressing was performed or not, the sintering temperature (between 1700°C and 1900°C) and/or duration (between 4 hours and 60 hours). This yielded mean grain sizes between 9 and 22 µm. The mean density is between 0.96 and 0.986 of the theoretical UO2 density.
The samples were cut from a pellet of each batch using a diamond wire saw and mechanically polished. The final polishing step was performed with a 0.02 µm colloidal silica suspension to minimize the polishing superficial damage for EBSD characterizations.
EBSD maps were performed with a FEI Nova NanoSEM (accelerating voltage: 20 kV, beam current: 10 nA) by means of a Nordlys II Nano camera from Oxford Instruments driven by the AZTEC software. EBSD data were analyzed with the Channel 5 suite of programs (version: 5.12.63.0). The indexation rate of EBSD data (ratio of indexed pixels over total number of tested pixels) varied from 95% to 99% (prior to any data cleaning), depending on the acquisition step (which varied from 0.4 µm to 1 µm, depending on the maps) and the number and size of pores present in the examined area.
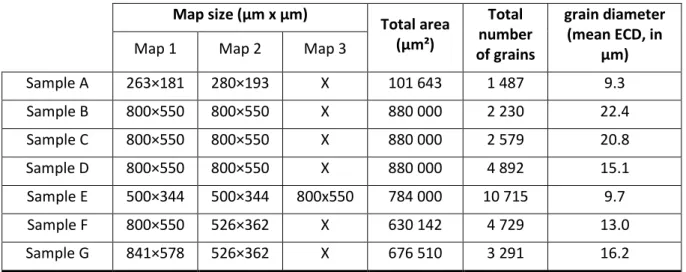
Table 1 shows the total area investigated, the total number of grains analyzed and their mean grain diameter, given in equivalent circular diameter (ECD), for all samples. Depending on the sample, several EBSD maps were collected (their size is reported in the table). Grains were detected considering a misorientation threshold of 5° to define a grain boundary, and a minimum grain surface of 10 pixels corresponding to a minimum ECD of 1.2 to 3 µm, depending on the step size.
Map size (µm x µm) Total area (µm²) Total number of grains grain diameter (mean ECD, in µm)
Map 1 Map 2 Map 3
Sample A 263×181 280×193 X 101 643 1 487 9.3 Sample B 800×550 800×550 X 880 000 2 230 22.4 Sample C 800×550 800×550 X 880 000 2 579 20.8 Sample D 800×550 800×550 X 880 000 4 892 15.1 Sample E 500×344 500×344 800x550 784 000 10 715 9.7 Sample F 800×550 526×362 X 630 142 4 729 13.0 Sample G 841×578 526×362 X 676 510 3 291 16.2
Table 1. Characteristics of surface analyzed by EBSD on each sample.
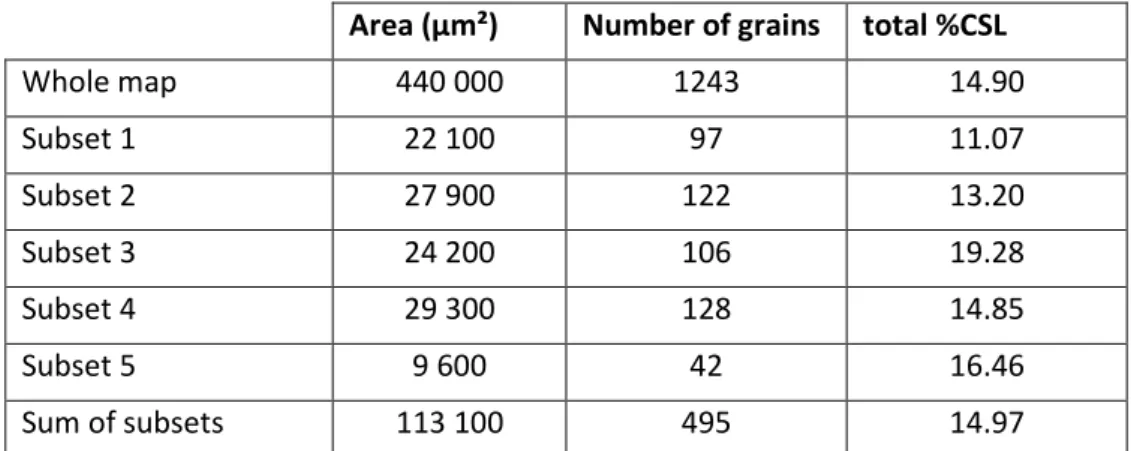
To study the effect of the size of the EBSD map on CSL grain boundaries population, we focused on a map originating from sample C and comprising about 1250 grains. The whole surface as well as various smaller surface subsets were analyzed in terms of CSL linear fractions. Table 2 shows the results obtained for each subset: measured CSL fractions are between 11% and 19% and sometimes far from the value obtained for the whole map (14.90%). This result clearly shows that a surface too small does not provide reliable values. The sum of all the considered subsets leads however to a CSL population close to that of the whole map and corresponds to an equivalent map of ~ 500 grains. Therefore, it seems reasonable to consider that for a sintered polycrystalline UO2 with a homogeneous microstructure (equiaxed grains with a limited size dispersion), analyzing a map with at least 500 grains is necessary to obtain reliable CSL fractions. If the microstructure shows marked heterogeneities (such as areas with significantly smaller or larger grains), more grains might be necessary. That also confirms the caveats already given regarding Nerikar’s and Rudman’s results concerning the limited number of grains analyzed by these authors.
In the present work, all CSL fractions were obtained from maps with more than 500 grains. Depending on the sample, the surface and the number of maps differed and, in certain cases, about 5000 grains or more were analyzed (cf. samples D, E and F).
Area (µm²) Number of grains total %CSL Whole map 440 000 1243 14.90 Subset 1 22 100 97 11.07 Subset 2 27 900 122 13.20 Subset 3 24 200 106 19.28 Subset 4 29 300 128 14.85 Subset 5 9 600 42 16.46 Sum of subsets 113 100 495 14.97
Table 2. Linear fraction of CSL grain boundaries in the different subsets analyzed in sample C.
Figure 1 shows the total linear fraction of CSL grain boundaries for samples A to G, compared to the results of Nerikar et al. [10]. The extent of the associated error bars varies due to the different number and size of EBSD maps taken into account for each sample. With respect to the uncertainties, all the values are very close to each other and in between 14,6% and 15,4%. They are also in agreement with Nerikar’s results, obtained on 150 to 250 grains of UO2, and coherent with Vonlanthen’s and Grobety’s ones, namely between 17% and 17.8%, in YSZ samples sintered in various conditions [5].
Figure 1 : Total linear fraction of CSL grain boundaries for samples A to G compared to Nerikar et al. data [10]
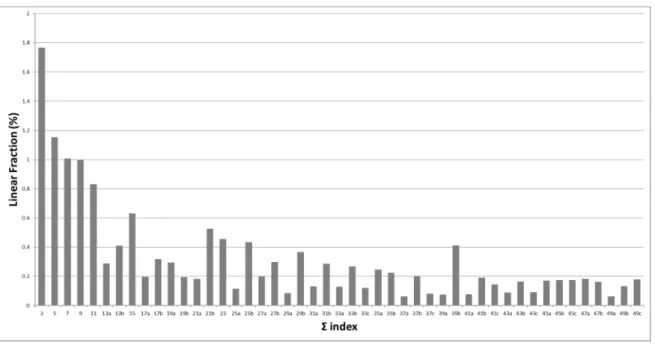
Figure 2 shows the linear fraction of each CSL grain boundary from Σ3 to Σ49 summed on all samples, i.e. the average CSL grain boundaries character distribution. If we categorize the seven most abundant CSL boundaries from the most to the least frequent, the following sequence is observed: Σ3,
Σ5, Σ7, Σ9, Σ11, Σ15 and Σ21 whereas Nerikar et al. observed on UO2 the Σ9, Σ3, Σ5, Σ11, Σ21 sequence and Vonlanthen and Grobety the Σ3, Σ5, Σ11, Σ15, Σ9 and Σ7 on YSZ. The important finding
here is that the elaboration and sintering conditions do not noticeably affect the total fraction of CSL boundaries in the samples. The similarity with Nerikar’s, Vonlanthen’s and Grobety’s results seems to demonstrate that CSL grain boundaries character distribution in oxides ceramics with a cubic fluorite structure is rather independent of the nature of the material and of the conditions of its elaboration by pressing and natural sintering.
Figure 2 : Average CSL grain boundaries distribution for Σ3 to Σ49, in all UO2 samples (A to
G)
Hallberg et al. elaborated a model of polycrystal taking into account the influence of anisotropic grain boundary energy on the evolution of grain boundary character distribution during grain growth [32,33]. Based on the classical Read–Shockley relation [34], the authors proposed a set of equations that results in the variation of grain boundary energy with misorientation in the range Σ3-Σ29 of CSL boundaries, i.e. γ/γmax = f(θ), with γmax the energy at the angle θmax differentiating between low- and high-angle boundaries. Figure 3 shows the inversed Hallberg’s curve γmax/γ in red.
For sample F, as an example, the linear fractions of CSL boundaries initially represented as a function of the Σ index (see Figure 2) were considered as a function of the misorientation angle up to
Σ49c. The resulting plot is drawn in blue in Figure 3. The red and blue plots show an obvious similitude, clearly evidencing a correlation between the frequency of a given CSL grain boundary and its energy, as calculated by Hallberg. As an example, the Σ3 boundary is the most frequent and has the lowest energy. The same observation is true for Σ5, Σ7 et Σ9 (see Figure 3) and might be generalized to other CSL boundaries. Thus, the more frequent a CSL boundary, the lower its energy. Saylor et al. drew a similar conclusion mentioning that grain boundaries planes distribution (GBPD) in MgO exhibits a substantial inverse correlation with the grain boundary energy distribution (GBED) [35]. Rohrer also shows that, in general, for cubic MgO, when the energy is low, the population is high [36]. A similar inverse correlation between GBPD and GBED also seems to be true in YSZ (see Helmick et al. [37]). Nerikar et al. [5] also state that in UO2 the more energetically stable a grain boundary, the more it is encountered in a polycrystal.
Thus, the comparison of our results with those available in the literature tends to confirm that such a correlation, already observed in other ceramics and metals, is a very general phenomenon and
that during grain growth, boundaries configure their orientations to minimize the total grain boundary energy.
Figure 3 : Misorientation dependence of the inverse of the grain boundary energy calculated by Hallberg (in red) [32] and linear fraction of CSL for sample F (in blue).
Atomistic Simulations
In a first stage, we only focused on CSL grain boundaries, which have the advantage of being easily built knowing their geometric characteristics. EBSD measurements give explicitly information on CSL boundaries, so calculations can be simply compared to the results of experiments. To perform our atomistic simulations, we built grain boundaries using the GBStudio software [27] that allows constructing a given grain boundary on the basis of its CSL classification and of the crystallographic structure of the material considered [38]. The system built with GBStudio respects the geometry of the anticipated grain boundary (i.e. the relative orientation of the two crystals), but the interface at the atomic scale must be relaxed. As already mentioned in the introduction, various relaxation procedures can be used to minimize the energy of the system and then obtain the energy of the corresponding grain boundary. In this work, we chose to apply a relaxation procedure in two steps. The first step is an energy minimization at 0 K, allowing the relaxation of the simulation box and the atomic positions of all the atoms. Anisotropic or isotropic minimization was applied depending on the situation. For 3 among the 26 grain boundaries considered here, a supplementary gap of 1 Å was added between the two crystals to minimize repulsive interactions, which can appear at the interface after the construction. The second step consisted in performing a thermal annealing using the molecular dynamics code LAMMPS [39]. Starting from the GBStudio configuration relaxed at 0 K, a temperature ramp was applied to reach 1870 K in 1 ns. This temperature was then kept constant during a 0.4 ns NPT simulation, as potential energetic barriers were assumed easier to overcome at this temperature. Then, the temperature was smoothly brought back to 300 K in another 1 ns and finally, energy and volume averages calculations were performed at 300 K during a last 4 ns long NPT simulation.
The formation energy of a grain boundary is the excess energy due to the presence of an interface compared with the energy of the corresponding single crystal. Practically, this energy is obtained through the following expression:
= (1)
Where, is the energy of a system of N atoms including explicitly the grain boundary, is the energy of a single crystal with the same number of atoms calculated in the same conditions. A is the surface of the simulated boundary, i.e. the section of the simulation box. Note that our simulations are performed with periodic boundary conditions to avoid free surface effects. Thus, two similar grain boundaries are simulated, explaining the factor 2 in the denominator of equation (1). This energy is not related to the strength of the grain boundary but rather expresses its thermodynamic stability as compared to the single crystal. The higher this energy is, the more unstable the grain boundary is from a thermodynamic point of view. To evaluate the strength of a grain boundary or its capacity to resist a normal stress, we need to calculate its cleavage energy [23]. It corresponds to the energy required to separate the boundary into two surfaces, and can be associated with the toughness of the material through the Griffith rule [20], or with the theoretical breaking stress using the Orowan model [40]. In our work, it can be evaluated using the equation as follow:
= /
(2)
Where, is the energy of the system including explicitly the grain boundary, and ⁄ is the energy of a half of this system, including two free surfaces corresponding to the grain boundary plane. The factor 2 appearing at the denominator comes from the periodic boundary conditions, and the factor 2 appearing at the numerator is linked to the fact that the system with the free surfaces counts half the number of atoms per unit area. The cleavage energy is assumed positive and corresponds to the energy needed to open the grain boundary.
In this work, we compared four different empirical potentials: Morelon et al. [18], Yakub et al. [21], Potashnikov et al. [15] and Cooper et al. [26]. Those potentials have been chosen among the great number of available potentials because they offer an interesting compromise between simplicity and performance [15,16]. All of them are based on the pair type Buckingham formalism, taking into account the ionic interactions between atoms through a rigid ions model with partial charges. Yakub and Cooper potentials also integrate a Morse type interaction to take into account the partially covalent character of the uranium oxygen bond. The Cooper potential goes beyond the pair potential through an Embedded Atom Model (EAM) contribution. Note that Yakub, Morelon and Cooper potentials were already used to study grain boundaries in UO2 [17,20,22,25] making comparison with the present work possible. To make sure that these potentials are suited to simulate grain boundaries, we first calculated surface energies. Grain boundaries being interfaces between two crystals, surface energies and formation energies of grain boundaries can be considered as similar properties at the atomic scale. {100}, {110} and {111} free surfaces of UO2 were calculated by performing a 1 ns NPT molecular dynamic simulation with the Lammps code [39]. Table 3 shows the results obtained. They are in good agreement with literature when the same potentials are used. We obtained results identical or very close to those of Zhang et al. [20], who used the Yakub and Morelon potentials to calculate the {111} and {110} surfaces energies, and of Boyarchenkov et al. [41], who used the Potashnikov potential to calculate energies of surfaces {100} and {111}. Table 3 also shows that the four potentials lead to similar results: Yakub and Cooper potentials are very close and are around 5 to 10 % higher than the results given by Morelon and Potashnikov potentials. The comparison with DFT electronic structure calculation results coming from Bottin et al. [42] shows that the three surface energies are ranked similarly (Esurf{100} > Esurf{110} > Esurf{111}). This is satisfactory, even if calculations using empirical potentials overestimate all the energies by about 20 to 40 %. We should keep in mind that the same overestimation should appear concerning the formation energies of grain boundaries. It is also worth noting that the results obtained by Sattonnay et al. [43] using a more complex and expensive potential with variable charges do not seem to be better.
DFT [42] Zhang [20] Williams [23] Boyarchenkov [41] Sattonnay [43] This work Surface {100} 1.46 - - 1.60 (Pota) 2.03 (SMTB-Q) 1.69 (Morelon) 1.90 (Cooper) 1.92 (Yakub) 1.83 (Pota) Surface {110} 1.16 1.45(Morelon) 1.55 (Yakub) - - 1.72 (SMTB-Q) 1.45 (Morelon) 1.61 (Cooper) 1.59 (Yakub) 1.43 (Pota) Surface {111} 0.73 0.82 (Morelon)
0.86 (Yakub) 1.33 (Williams) 1.14 (Pota) 1.07 (SMTB-Q)
0.88 (Morelon) 1.04 (Cooper)
1.02 (Yakub)
0.91 (Pota)
Table 3. Surface energies (J.m-2) at 300 K calculated using molecular dynamic simulations. The empirical potential used in the calculation is indicated in brackets.
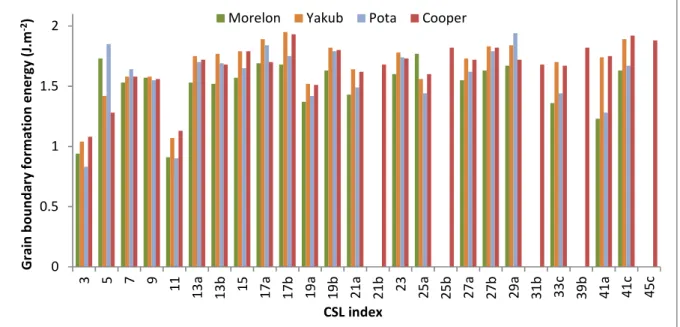
Figure 4 (and Table 1 in supplementary data) show the formation energies calculated using equation (1) for the 26 different CSL grain boundaries studied in this work, with the four chosen potentials. The order of magnitude of energies is correct as all results are between 0.8 and 2 J.m-2. For some grain boundaries, formation energy is similar whatever the potential (e.g. the Σ9 grain boundary), whereas for others the energy strongly depends on the potential (e.g. the Σ5 grain boundary). Also, the Σ3 grain boundary has the lower energy regardless the potential used (except for the potential from Morelon, for which Σ3 has the second lower energy). This is consistent with the fact that this grain boundary is the most frequent in terms of linear fraction. Moreover, our results are in good agreement with those obtained by Zhang et al. [20], with Yakub and Morelon potentials, and with those of Chen et al. [22], calculated with the Yakub potential. The same remark applies to the results obtained by Galvin et al. [25] using the Cooper potential. Conversely, the results obtained by Van Brutzel et al. [17] using the Morelon potential are always higher than ours. A possible explanation is that the relaxation procedure used by these authors did not allow reaching the minimum formation energy.
Figure 4. Formation energies (J.m-2) calculated with the four different empirical potentials for
the 26 CSL grain boundaries studied in this work.
0 0.5 1 1.5 2 3 5 7 9 1 1 1 3 a 1 3 b 1 5 1 7 a 1 7 b 1 9 a 1 9 b 2 1 a 2 1 b 2 3 2 5 a 2 5 b 2 7 a 2 7 b 2 9 a 3 1 b 3 3 c 3 9 b 4 1 a 4 1 c 4 5 c G ra in b o u n d a ry f o rm a ti o n e n e rg y ( J. m -2) CSL index
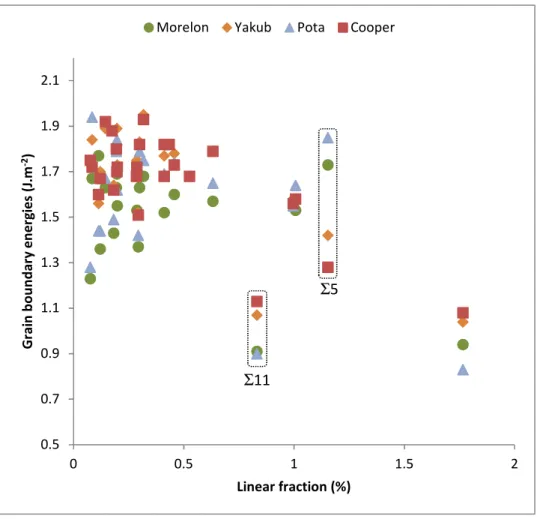
Figure 5 shows the formation energies calculated in this work as a function of the linear fraction of CSL boundaries observed experimentally using EBSD measurements. Let us recall here that EBSD analysis does not yield the boundary plane of observed grain boundaries. On the contrary, our calculations were done for a given boundary plane, the first one proposed by GBStudio for a given CSL grain boundary, generally the most favorable. Nevertheless, an inverse correlation between GBPD (measured experimentally) and GBED (calculated) is clearly evidenced in this figure. This correlation is observed apart for the Σ11 GB for all the potentials, and apart for the Σ5 for Morelon and Potashnikov potentials. This is an important result because, to our knowledge, it is the first time that such a correlation is established between calculated formation energies at the atomic scale and experimental observations for a significant number of grain boundaries in UO2. Finally, we obtained a correlation coefficient of -0.42 for Morelon, -0.45 for Potashnikov, -0.73 for Yakub and -0.74 for Cooper potentials. Moreover, if we focus on the energy of the Σ5 and Σ11 grain boundaries, the Cooper potential seems to be the most efficient. This potential also yields good results regarding thermodynamic properties [26]. These are the reasons why it was chosen to calculate cleavage energies in the following second step of this work.
Figure 5. Formation energies (J.m-2) calculated as a function of the linear fraction measured
(%) for the 26 CSL grain boundaries studied in this work.
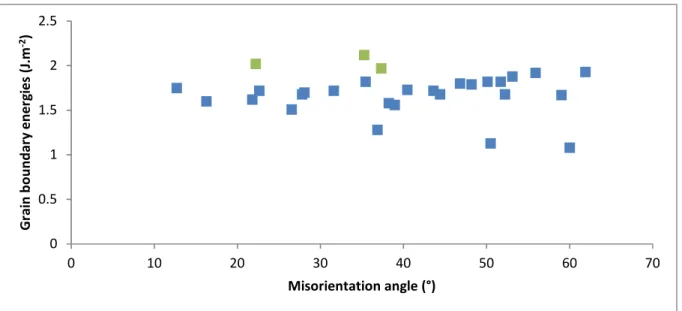
Then we have plotted in Figure 6 the formation energies calculated in this work as a function of the misorientation angle between the two crystals forming the boundary. No obvious correlation appears: almost all CSL grain boundaries have an energy between 1.5 and 2 J.m-2 (see the blue points in figure 5), except the Σ3 (60° - 1.08 J.m-2), Σ5 (36.9° - 1.28 J.m-2) and Σ11 (50.5° - 1.13 J.m-2).
0.5 0.7 0.9 1.1 1.3 1.5 1.7 1.9 2.1 0 0.5 1 1.5 2 G ra in b o u n d a ry e n e rg ie s (J .m -2) Linear fraction (%)
Morelon Yakub Pota Cooper
Σ11
Figure 6. Misorientation dependence of formation energies (J.m-2) for the 26 CSL grain
boundaries (blue points) and the 3 semi-general grain boundaries (in green) calculated in this work with the Cooper potential.
Cleavage energy calculated using equation (2) and the Cooper potential as a function of the misorientation angles of grain boundaries is plotted in Figure 7. In this case, despite the scattering of the values, a trend seems to arise (with a correlation coefficient equal to -0.55): the higher the misorientation angle, the lower the cleavage energy. This result is very interesting and opens the way to a modeling of the cleavage energy usable in simulations at higher scale.
Figure 7. Misorientation dependence of the cleavage energies (J.m-2) calculated with the
Cooper potential for the 26 CSL grain boundaries (blue points) and the 3 semi-general grain boundaries (in green). The dashed line in red is the linear trend curve of the blue points.
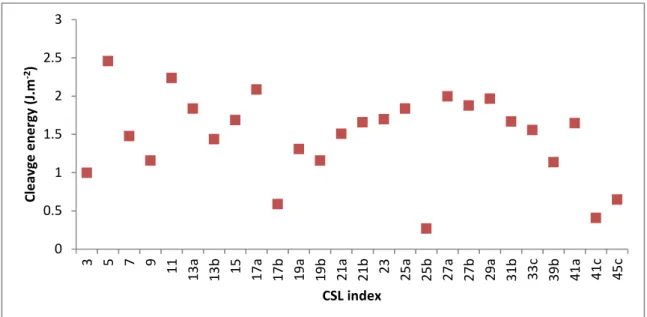
The cleavage energy as a function of the CSL index calculated using equation (2) and the Cooper potential can be seen in Figure 8. Again, no clear correlation is observed. Only Σ3, Σ17b, Σ25b, Σ41c and Σ45c grain boundaries present a cleavage energy lower than 1 J.m-2. These boundaries should thus be the easiest to open in UO2. In comparison, it is worth reminding that the energies of the three
0 0.5 1 1.5 2 2.5 0 10 20 30 40 50 60 70 G ra in b o u n d a ry e n e rg ie s (J .m -2) Misorientation angle (°) 0 0.5 1 1.5 2 2.5 3 0 10 20 30 40 50 60 70 C le v a g e e n e rg ie s (J .m -2) Misorientation angle (°)
natural surfaces of UO2 {100}, {110} and {111} were calculated respectively equal to 1.90, 1.61 and 1.04 J.m-2. This means that the cleavage of a single crystal of UO
2 along these three planes would need 3.8, 3.22 and 2.08 J.m-2 respectively. From these results, it appears reasonable to conclude that, in a system without point defect, the opening of a grain boundary most likely needs less energy than the cleavage of a single crystal along a natural surface.
Figure 8. Cleavage energies (J.m-2) calculated with the Cooper potential for the 26 CSL grain
boundaries.
Figure 9 shows the cleavage energy as a function of the formation energy calculated using the Cooper potential. Once again, no clear correlation appears. Nevertheless, the four grain boundaries with formation energies above 1.8 J.m-2 (Σ17b, Σ25b, Σ41c and Σ45c) are characterized by the lowest cleavage energies (below 0.65 J.m-2), which seems consistent. The Σ3 grain boundary however exhibits a low formation energy (1.16 J.m-2) but is also one of the easiest to open, since its cleavage energy is equal to 0.92 J.m-2.
Figure 9. Cleavage energies (J.m-2) as a function of the formation energies calculated with the
Cooper potential for the 26 CSL grain boundaries.
0 0.5 1 1.5 2 2.5 3 3 5 7 9 11 1 3 a 1 3 b 15 1 7 a 1 7 b 1 9 a 1 9 b 2 1 a 2 1 b 23 2 5 a 2 5 b 2 7 a 2 7 b 2 9 a 3 1 b 3 3 c 3 9 b 4 1 a 4 1 c 4 5 c C le a v g e e n e rg y ( J. m -2) CSL index 0 0.5 1 1.5 2 2.5 3 1 1.2 1.4 1.6 1.8 2 C le a v a g e e n e rg ie s (J .m -2)
In the first part of this work, we focused on CSL grain boundaries built using GBStudio. EBSD experiments however showed that CSL grain boundaries represent only 15 to 20 % of the linear fraction of grain boundaries observed in a UO2 polycrystal. Thus, the large majority of grain boundaries in a real material actually possesses infinite CSL indexes, i.e. no coincidence site can be found between the lattices of the two crystals forming the boundary, which is generally not symmetrical. Such boundaries can be constructed from two crystals randomly rotated with respect to each other. Unfortunately, by doing so, the general grain boundary is built among many possibilities. This procedure lacks a controlling parameter that would make it possible to compare different general boundaries or general boundaries to CSL ones.
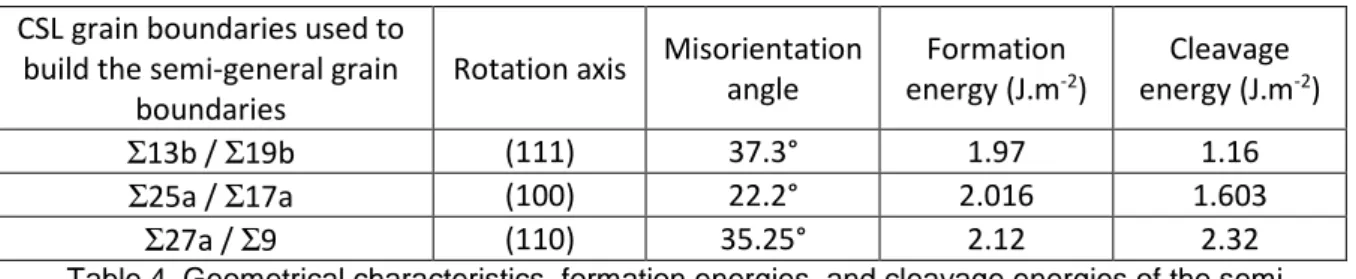
We tried to take a step towards the simulation of general boundaries by building what we called “semi-general” boundaries. To do so, we stuck two halves of two different CSL grain boundaries constructed with GBStudio which had been studied in the previous part of this work. To be able to control both the axis and angle of rotation, two CSL boundaries with the same rotation axis were chosen. Table 4 shows the three semi-general grain boundaries built using this procedure. Green points in Figure 6 show their formation energies compared to the CSL grain boundaries studied in this work. It appears that the formation energies of these 3 semi-general grain boundaries are systematically higher than the formation energies of the CSL grain boundaries. This result is consistent with the assumption that formation energy is correlated with stability [10]. Since semi-general grain boundaries are supposed to be less stable than CSL boundaries, so their formation energies should be higher. Green points in Figure 7 show their cleavage energies compared to the CSL grain boundaries studied in this work. These energies are in good agreement with the correlation observed between cleavage energy and misorientation angle. Therefore, the cleavage energy of general boundaries also seems to decrease with misorientation angle. Of course, these first results will have to be confirmed by further calculations.
CSL grain boundaries used to build the semi-general grain
boundaries
Rotation axis Misorientation angle Formation energy (J.m-2) Cleavage energy (J.m-2) Σ13b / Σ19b (111) 37.3° 1.97 1.16 Σ25a / Σ17a (100) 22.2° 2.016 1.603 Σ27a / Σ9 (110) 35.25° 2.12 2.32
Table 4. Geometrical characteristics, formation energies, and cleavage energies of the semi-general grain boundaries studied in this work with the Cooper potential.
Conclusions
Length fractions of CSL grain boundaries were obtained from reliable EBSD analysis performed on maps comprising a large number of grains acquired on several UO2 samples. Depending on the sample, 14.6% to 15.4% of grain boundaries total length were identified as CSL, suggesting that this value is rather independent of the conditions of elaboration and sintering. We also found that the most frequent CSL grain boundaries have the lowest energy, as calculated by Hallberg [33].
Then, formation energies calculated with Morelon [18], Yakub [21], Potashnikov [15] and Cooper [26] empirical potentials were compared to linear fractions of CSL grain boundaries obtained from EBSD data. An inverse correlation between the formation energy and the linear fraction is clearly evidenced. This correlation is better with Cooper and Yakub potentials, except for the formation energy of the Σ11 grain boundary. Therefore, an interesting perspective to this work would be to measure the formation energy of this particular grain boundary and compare the experimental result with the calculated one.
The cleavage energy, representing the energy needed to open the grain boundary, was also calculated using the Cooper potential for the 26 CSL grain boundaries. Although no clear correlation is evidenced between cleavage energy and formation energy, we found that the cleavage energy decreases with the misorientation angle. This last result opens a way to the modelling of the cleavage energy as a function of the misorientation angle, which is an “easy to follow” parameter in simulations performed at the scale of a polycrystal, as in REV (Representative Elementary Volume) simulations [44].
A step towards the simulation of general grain boundaries, i.e. grain boundaries without symmetry and presenting an infinite CSL index, was also taken. As such boundaries represent at least 80 % of the linear fraction observed in sintered UO2 samples, their properties have to be investigated in detail. We built 3 semi-general grain boundaries, sticking two halves of CSL grain boundaries with the same rotation axis. Their formation energies appear higher than that of CSL boundaries, as expected since they are most likely less stable. Their cleavage energies follow the correlation observed on CSL boundaries. Therefore, the cleavage energy of general boundaries probably also decreases with the misorientation angle. A perspective to this work will be to study more general grain boundaries and to investigate if the observed correlations is also found at higher temperature.
Acknowledgements
This work was granted access to the HPC resources of CINES and TGCC under the allocation 2017- A0030906922 made by GENCI.
Data Availability
The raw/processed data required to reproduce these findings cannot be shared at this time as the data also forms part of an ongoing study.
References
[1] M. Lainet, V. Bouineau, T. Helfer, M. Pelletier, Recent modelling improvements in fuel performance code GERMINAL for SFR oxide fuel pins, Fast React. Relat. Fuel Cycles Safe Technol. Sustain. Scenar. FR13 COMPANION CD-ROM Proc. Int. Conf. (2015). http://inis.iaea.org/Search/search.aspx?orig_q=RN:46091216 (accessed June 12, 2018). [2] A.P. Sutton, R.W. Balluffi, Interfaces in Crystalline Materials, n.d.
https://global.oup.com/academic/product/interfaces-in-crystalline-materials-9780199211067 (accessed March 14, 2016).
[3] L. Priester, 1- Geometrical Order of Grain Boundaries, in: Grain Boundaries, Springer Netherlands, 2013: pp. 3–28. doi:10.1007/978-94-007-4969-6_1.
[4] D.G. Brandon, The structure of high-angle grain boundaries, Acta Metall. 14 (1966) 1479–1484. doi:10.1016/0001-6160(66)90168-4.
[5] P. Vonlanthen, B. Grobety, CSL grain boundary distribution in alumina and zirconia ceramics, Ceram. Int. 34 (2008) 1459–1472. doi:10.1016/j.ceramint.2007.04.006. [6] H. Miyamoto, K. Ikeuchi, T. Mimaki, The role of grain boundary plane orientation on
intergranular corrosion of symmetric and asymmetric [1 1 0] tilt grain boundaries in directionally solidified pure copper, Scr. Mater. 50 (2004) 1417–1421.
[7] T. Watanabe, Grain boundary engineering: historical perspective and future prospects, J. Mater. Sci. 46 (2011) 4095–4115. doi:10.1007/s10853-011-5393-z.
[8] N. Shibata, F. Oba, T. Yamamoto, Y. Ikuhara §, Structure, energy and solute segregation behaviour of [110] symmetric tilt grain boundaries in yttria-stabilized cubic zirconia, Philos. Mag. 84 (2004) 2381–2415. doi:10.1080/14786430410001693463.
[9] C.A.J. Fisher, H. Matsubara, The influence of grain boundary misorientation on ionic conductivity in YSZ, J. Eur. Ceram. Soc. 19 (1999) 703–707. doi:10.1016/S0955-2219(98)00300-8.
[10] P.V. Nerikar, K. Rudman, T.G. Desai, D. Byler, C. Unal, K.J. McClellan, S.R.
Phillpot, S.B. Sinnott, P. Peralta, B.P. Uberuaga, C.R. Stanek, Grain Boundaries in Uranium Dioxide: Scanning Electron Microscopy Experiments and Atomistic
Simulations: Grain Boundaries in Uranium Dioxide, J. Am. Ceram. Soc. 94 (2011) 1893– 1900. doi:10.1111/j.1551-2916.2010.04295.x.
[11] A.J. Vattré, M.J. Demkowicz, Determining the Burgers vectors and elastic strain
energies of interface dislocation arrays using anisotropic elasticity theory, Acta Mater. 61 (2013) 5172–5187. doi:10.1016/j.actamat.2013.05.006.
[12] K. Govers, S. Lemehov, M. Hou, M. Verwerft, Comparison of interatomic potentials
for UO2. Part I: Static calculations, J. Nucl. Mater. 366 (2007) 161–177. doi:10.1016/j.jnucmat.2006.12.070.
[13] K. Govers, S. Lemehov, M. Hou, M. Verwerft, Comparison of interatomic potentials
for UO2. Part II: Molecular Dynamic Simulations, J. Nucl. Mater. 376 (2008) 66–77. doi:10.1016/j.jnucmat.2008.01.023.
[14] A. Chernatynskiy, C. Flint, S.B. Sinnott, S.R. Phillpot, Critical assessment of UO2
classical potentials for thermal conductivity calculations, J. Mater. Sci. 47 (2012) 7693– 7702. doi:10.1007/s10853-011-6230-0.
[15] S.I. Potashnikov, A.S. Boyarchenkov, K.A. Nekrasov, A.Y. Kupryazhkin,
High-precision molecular dynamics simulation of UO2–PuO2: Pair potentials comparison in UO2, J. Nucl. Mater. 419 (2011) 217–225. doi:10.1016/j.jnucmat.2011.08.033.
[16] M. Cooper, Atomic scale simulation of irradiated nuclear fuel, PhD Thesis, Imperial
College London, 2015. http://ethos.bl.uk/OrderDetails.do?uin=uk.bl.ethos.650725 (accessed May 9, 2016).
[17] L.V. Brutzel, E. Vincent-Aublant, Grain boundary influence on displacement cascades
in UO2: A molecular dynamics study, J. Nucl. Mater. 377 (2008) 522–527. doi:10.1016/j.jnucmat.2008.04.010.
[18] N.D. Morelon, D. Ghaleb, J.M. Delaye, L. Van Brutzel, A new empirical potential for
simulating the formation of defects and their mobility in uranium dioxide, Philos. Mag. 83 (2003) 1533–1550. doi:10.1080/1478643031000091454.
[19] C.B. Basak, A.K. Sengupta, H.S. Kamath, Classical molecular dynamics simulation of
UO2 to predict thermophysical properties, J. Alloys Compd. 360 (2003) 210–216. doi:10.1016/S0925-8388(03)00350-5.
[20] Y. Zhang, P.C. Millett, M.R. Tonks, X.-M. Bai, S.B. Biner, Molecular dynamics
simulations of intergranular fracture in UO2 with nine empirical interatomic potentials, J. Nucl. Mater. 452 (2014) 296–303. doi:10.1016/j.jnucmat.2014.05.034.
[21] E. Yakub, C. Ronchi, D. Staicu, Molecular dynamics simulation of premelting and
melting phase transitions in stoichiometric uranium dioxide, J. Chem. Phys. 127 (2007) 094508. doi:10.1063/1.2764484.
[22] T. Chen, D. Chen, B.H. Sencer, L. Shao, Molecular dynamics simulations of grain
boundary thermal resistance in UO2, J. Nucl. Mater. 452 (2014) 364–369. doi:10.1016/j.jnucmat.2014.05.035.
[23] N.R. Williams, M. Molinari, S.C. Parker, M.T. Storr, Atomistic investigation of the structure and transport properties of tilt grain boundaries of UO2, J. Nucl. Mater. 458 (2015) 45–55. doi:10.1016/j.jnucmat.2014.11.120.
[24] X.-M. Bai, Y. Zhang, M.R. Tonks, Testing thermal gradient driving force for grain
boundary migration using molecular dynamics simulations, Acta Mater. 85 (2015) 95– 106. doi:10.1016/j.actamat.2014.11.019.
[25] C.O.T. Galvin, M.W.D. Cooper, P.C.M. Fossati, C.R. Stanek, R.W. Grimes, D.A.
Andersson, Pipe and grain boundary diffusion of He in UO 2, J. Phys. Condens. Matter. 28 (2016) 405002. doi:10.1088/0953-8984/28/40/405002.
[26] M.W.D. Cooper, M.J.D. Rushton, R.W. Grimes, A many-body potential approach to
modelling the thermomechanical properties of actinide oxides, J. Phys. Condens. Matter. 26 (2014) 105401. doi:10.1088/0953-8984/26/10/105401.
[27] H. Ogawa, GBstudio: a builder software on periodic models of CSL boundaries for
molecular simulation, Mater. Trans. 47 (2006) 2706–2710.
[28] E. TobyáKelsey, N.H. áde Leeuw, others, Atomistic simulation of dislocations,
surfaces and interfaces in MgO, J. Chem. Soc. Faraday Trans. 92 (1996) 433–438.
[29] A. Greenough, R. King, Grain-Boundary Energies in Silver, J. Inst. Met. 79 (1951)
415–427.
[30] V. Randle, Sigma-Boundary Statistics by Length and Number, Interface Sci. 10 (2002)
271–277. doi:10.1023/A:1020877528820.
[31] K. Rudman, P. Dickerson, D. Byler, R. McDonald, H. Lim, P. Peralta, C. Stanek, K.
McClellan, Three-dimensional characterization of sintered UO2+x : effects of oxygen content on microstructure and its evolution, Nucl. Technol. 182 (2013) 145–154.
[32] H. Hallberg, Influence of anisotropic grain boundary properties on the evolution of
grain boundary character distribution during grain growth—a 2D level set study, Model. Simul. Mater. Sci. Eng. 22 (2014) 085005. doi:10.1088/0965-0393/22/8/085005.
[33] H. Hallberg, Y. Zhu, Stability of grain boundary texture during isothermal grain
growth in UO2 considering anisotropic grain boundary properties, J. Nucl. Mater. 465 (2015) 664–673. doi:10.1016/j.jnucmat.2015.06.052.
[34] W.T. Read, W. Shockley, Dislocation Models of Crystal Grain Boundaries, Phys. Rev.
78 (1950) 275–289. doi:10.1103/PhysRev.78.275.
[35] Saylor David M., Morawiec Adam, Rohrer Gregory S., Distribution and Energies of
Grain Boundaries in Magnesia as a Function of Five Degrees of Freedom, J. Am. Ceram. Soc. 85 (2004) 3081–3083. doi:10.1111/j.1151-2916.2002.tb00583.x.
[36] G.S. Rohrer, Grain boundary energy anisotropy: a review, J. Mater. Sci. 46 (2011)
5881. doi:10.1007/s10853-011-5677-3.
[37] L. Helmick, S.J. Dillon, K. Gerdes, R. Gemmen, G.S. Rohrer, S. Seetharaman, P.A.
Salvador, Crystallographic Characteristics of Grain Boundaries in Dense Yttria-Stabilized Zirconia, Int. J. Appl. Ceram. Technol. 8 (2011) 1218–1228.
doi:10.1111/j.1744-7402.2010.02567.x.
[38] H. Grimmer, A method of determining the coincidence site lattices for cubic crystals,
Acta Crystallogr. A. 30 (1974) 680–680.
[39] LAMMPS, (n.d.). http://lammps.sandia.gov/bench.html (accessed September 1, 2017).
[40] E. Orowan, Fracture and strength of solids, Rep. Prog. Phys. 12 (1949) 185–232.
doi:10.1088/0034-4885/12/1/309.
[41] A.S. Boyarchenkov, S.I. Potashnikov, K.A. Nekrasov, A.Y. Kupryazhkin, Molecular
dynamics simulation of UO2 nanocrystals surface, J. Nucl. Mater. 421 (2012) 1–8. doi:10.1016/j.jnucmat.2011.11.030.
[42] F. Bottin, G. Geneste, G. Jomard, Thermodynamic stability of the UO 2 surfaces: Interplay between over-stoichiometry and polarity compensation, Phys. Rev. B. 93 (2016). doi:10.1103/PhysRevB.93.115438.
[43] G. Sattonnay, R. Tétot, Bulk, surface and point defect properties in UO 2 from a
tight-binding variable-charge model, J. Phys. Condens. Matter. 25 (2013) 125403. doi:10.1088/0953-8984/25/12/125403.
[44] R. Hill, Elastic properties of reinforced solids: Some theoretical principles, J. Mech.
![Figure 3 : Misorientation dependence of the inverse of the grain boundary energy calculated by Hallberg (in red) [32] and linear fraction of CSL for sample F (in blue)](https://thumb-eu.123doks.com/thumbv2/123doknet/12932223.374200/9.892.108.737.157.479/figure-misorientation-dependence-inverse-boundary-calculated-hallberg-fraction.webp)