Cost and Revenue
Overruns of the
Olympic Games
2000–2018
Holger Preuß · Wladimir Andreff
Maike Weitzmann
Reihe herausgegeben von H. Preuß , Mainz , Deutschland M. Kurscheidt , Bayreuth , Deutschland
beleuchten gleichermaßen die Effekte der Großereignisse auf ihr sozioökonomi-sches Umfeld als auch den Einfluss von Standortfaktoren auf die Wettbewerbs-fähigkeit und Governance der Eventwirtschaft. Die Themenfelder umfassen alle Stakeholder von Events und reichen von Primärerhebungen zum Reise- und Kon-sumverhalten von Eventbesuchern sowie zu Werbe- und Imagewirkungen von Großveranstaltungen über den gesellschaftlichen Beitrag von Events, etwa zum Volunteering, bis zu Analysen der Eventinfrastruktur wie Stadien- und Ligen-märkte oder Finanzierungsquellen. Die Schriftenreihe richtet sich an Lehrende und Studierende der Wirtschafts-, Sport- oder Tourismuswissenschaft sowie an Prakti-ker und öffentliche Entscheidungsträger in eventbezogenen Handlungsfeldern.
Reihe herausgegeben von Prof. Dr. Holger Preuß
Universität Mainz, Deutschland Prof. Dr. Markus Kurscheidt Universität Bayreuth, Deutschland
Maike Weitzmann
Cost and Revenue
Overruns of the Olympic
Games 2000–2018
Maike Weitzmann
Johannes Gutenberg-University Mainz Mainz, Germany
Event- und Impaktforschung
ISBN 978-3-658-24995-3 ISBN 978-3-658-24996-0 (eBook)
https://doi.org/10.1007/978-3-658-24996-0
Library of Congress Control Number: 2018965931 Springer Gabler
© The Editor(s) (if applicable) and The Author(s) 2019. This book is an open access publication. Open Access This book is licensed under the terms of the Creative Commons Attribution 4.0 International License ( http://creativecommons.org/licenses/by/4.0/ ), which permits use, sharing, adaptation, distribution and reproduction in any medium or format, as long as you give appro-priate credit to the original author(s) and the source, provide a link to the Creative Commons licence and indicate if changes were made.
The images or other third party material in this book are included in the book's Creative Commons licence, unless indicated otherwise in a credit line to the material. If material is not included in the book's Creative Commons licence and your intended use is not permitted by statutory regulation or exceeds the permitted use, you will need to obtain permission directly from the copyright holder.
The use of general descriptive names, registered names, trademarks, service marks, etc. in this publication does not imply, even in the absence of a specific statement, that such names are exempt from the relevant protective laws and regulations and therefore free for general use.
The publisher, the authors, and the editors are safe to assume that the advice and information in this book are believed to be true and accurate at the date of publication. Neither the publisher nor the authors or the editors give a warranty, express or implied, with respect to the material contained herein or for any errors or omissions that may have been made. The publisher remains neutral with regard to jurisdictional claims in published maps and institutional affiliations. This Springer Gabler imprint is published by the registered company Springer Fachmedien Wiesbaden GmbH part of Springer Nature
V Contents
Executive Summary . . . IX List of Abbreviations . . . XIX List of Tables . . . XXI List of Figures . . . XXV
1 Introduction . . . 1
2 Literature Review . . . 7
2 .1 Cost Overruns in General . . . 7
2 .1 .1 What are Cost Overruns? . . . 7
2 .2 .2 Cost Overruns in Mega Projects and at Olympic Games . . . 8
2 .2 Comparative Issues . . . 16
2 .3 Olympic Games and Mega Sports Events . . . 18
3 Methodology . . . 21
3 .1 Availability of Financial Data from the Olympic Games . . . 23
3 .2 Preparation of Data . . . 27
3 .3 Quality of Data and Building of Categories . . . 34
3 .4 Problems in the Preparation of Data . . . 35
3 .5 Building of OCOG and Non-OCOG Budget Categories . . . 37
4 Results I . . . 43
4 .1 Sydney 2000 . . . 43
4 .1 .1 SOCOG Revenue . . . 46
4 .1 .2 SOCOG Expenditure . . . 49
4 .2 Salt Lake City 2002 . . . 52
4 .2 .1 SLOC Revenue . . . 54
4 .2 .2 SLOC Expenditure . . . 55
4 .2 .3 Salt Lake City 2002 Non-OCOG Costs . . . 57
4 .3 Athens 2004 . . . 60
4 .3 .1 ATHOC Revenue . . . 62
4 .3 .2 ATHOC Expenditure . . . 64
4 .3 .3 Athens 2004 Non-OCOG Costs . . . 66
4 .4 Turin 2006 . . . 70
4 .4 .1 TOROC Revenue . . . 72
4 .4 .2 TOROC Expenditure . . . 73
4 .4 .3 Turin 2006 Non-OCOG Costs . . . 75
4 .5 Beijing 2008 . . . 76
4 .5 .1 BOCOG Revenue . . . 76
4 .5 .2 BOCOG Expenditure . . . 78
4 .5 .3 Beijing 2008 Non-OCOG Costs . . . 80
4 .6 Vancouver 2010 . . . 80
4 .6 .1 VANOC Revenue . . . 81
4 .6 .2 VANOC Expenditure . . . 83
4 .6 .3 Vancouver 2010 Non-OCOG Costs . . . 84
4 .7 London 2012 . . . 86
4 .7 .1 LOCOG Revenue . . . 89
4 .7 .2 LOCOG Expenditure . . . 91
4 .7 .3 London 2012 Non-OCOG Costs . . . 93
4 .8 Sochi 2014 . . . 96
4 .8 .1 SOOC Revenue . . . 98
4 .8 .2 SOOC Expenditure . . . 99
4 .8 .3 Sochi 2014 Non-OCOG Costs . . . 101
4 .9 Rio de Janeiro 2016 . . . 104
4 .9 .1 COJOPR Revenue . . . 105
4 .9 .2 COJOPR Expenditure . . . 107
4 .9 .3 Rio 2016 Non-OCOG Costs . . . 108
4 .10 PyeongChang 2018 . . . 108
4 .10 .1 POCOG Revenue . . . 108
4 .10 .2 POCOG Expenditure . . . 110
4 .10 .3 PyeongChang 2018 Non-OCOG Costs . . . 112
VII
5 Results II . . . 117
5 .1 Revenue Corridors by OCOG Category . . . 117
5 .2 Expenditure Corridors by OCOG Category . . . 128
5 .3 Non-OCOG Cost Corridors at Olympic Games . . . 134
5 .4 Non-OCOG Cost Corridors at Olympic Winter Games . . . 138
5 .5 Summary of Costs and Revenues of Olympic Games Seperated by Categories . . . 141
6 Reflections . . . 145
6 .1 Theoretical Explanations for Olympic Cost Overruns . . . 145
6 .1 .1 The Neo-Institutionalism Theory and Cost/Revenue Overruns . . . 147
6 .1 .2 Auction Theory: The Winner’s Curse . . . 154
6 .1 .3 Public Interest Theory vs Chicago Theory: Market Regulation to Favour Public Interest . . . 155
6 .1 .4 Evolution Theory and Planning Fallacy Theory . . . 156
6 .2 The Evolution of Olympic Budgets and their Economic Consequences . . . 157
6 .2 .1 Evolution of Olympic Budgets . . . 157
6 .2 .2 Economic Consequences: Cost Overruns, Revenue Overruns and Deficit . . . 160
6 .3 Practical Recommendations to Reduce Cost Overruns . . . 162
6 .4 Summary and Outlook . . . 170
Executive Summary
The Olympic Games are the largest worldwide multi-sport event and are a signif-icant and complex undertaking . More than 300 projects in distinct industries/ branches and different communities/cities need to be coordinated, often involving more than 50 stakeholders . The resources to organise the event and finance new or renovate/upgrade existing infrastructure come from different bodies, different levels of government, private entities and external investments into the local economy .
The scale of attention and visibility, combined with the uniqueness of the task, have inevitably provoked many discussions about the costs and benefits of such an event, and how to assess them carefully . Part of this conversation has been a
recurring focus on the cost overruns16of the Games and how they compare with
the original estimates . This debate cannot take place without also looking at the revenues that finance a substantial part of the event and the benefits of the event, which are often intangible .
The objective of this study is to investigate the cost and revenue overruns of
Olym-pic Games27from Sydney 2000 to PyeongChang 2018, as the size and organisational
1 Cost overruns are “the amount by which the actual cost exceeds the budgeted, estimated or target cost” (BusinessDictionary, n .d . a) .
2 Since host cities are committed to hosting the Paralympic Games together with the Olympic Games, the costs and revenues taken on board in this study encompass the Paralympic Games as well, even though for the sake of brevity we write “Olympic Games” .
dimension (number of athletes, venues and events) have been relatively constant for that period and provide the best overview of how the Games are managed today .
To provide a base for future host cities, we concentrated our research on the core Olympic costs and revenues . This means we evaluated the development of the expenditure and revenues of the Organising Committees for the Olympic Games (OCOGs), which covers the operations of the event, and the investment of public money for the main Olympic venues (non-OCOG budget) .
In addition to these two budgets, host countries, regions or cities often use the Olympic Games as an opportunity to carry out some of their long-term develop-ment projects, linked to urban renewal, transport and infrastructure for example, that are often not necessarily needed to stage the Games . This makes the criteria for considering what the actual cost of the Olympic Games is vary widely depend-ing on where they are bedepend-ing organised, the period of the preparation and who is compiling the expenditures (government bodies, independent studies, academic research, media, etc .) . These non-Olympic general development projects also have cost overruns, and these are notably often mentioned in media reports . However, these projects have not been considered for the purpose of this study as they are not needed to stage the Games .
This study also shows why attempts to come up with and compare overall capital costs for different Olympic Games editions are misleading . There are many public authorities and private investors involved, which makes it extremely difficult to find all project data from the candidature phase eight years before the Games (t-8) until Games time (t) . If during this period any data are left out, cost overrun calculations will be like comparing apples and oranges .
The four main findings of our study were as follows:
1 . For all 10 Games editions, we found that the costs of organising the Olympic Games (OCOG budget) are usually covered by revenues, which are almost entirely private resources plus the International Olympic Committee (IOC)’s contribution . 2 . The OCOGs usually significantly overran their expenditures during the first
few years, but then all OCOGs managed to save during the last two years and all of them finally balanced the budget or even generated a profit .
3 . All Games underestimated their revenues and had revenue overruns .
4 . The core Olympic capital investments considered in this study show cost overruns, but they are similar to the cost overruns of other (non-sporting) mega projects .
Methodologically, we must differentiate between three budgets:
• the expenditures and revenues of the OCOGs, because they are the centre of Olympic Games organisation;
• Olympic-related capital investments on venues, which are needed to stage the Olympic Games . We were very careful to display homogenised data by using the respective GDP deflators and construction price indices to consider inflation, and an average exchange rate to consider different currencies;
• non-Olympic infrastructure projects (airports, metro, roads, urban parks) for the long-term benefit of the city and region that are not required for the organisation of the Games, but which are often mistakenly mixed into the Games-related costs . These projects have not been considered in our study .
All results in this study are presented as percentages because the aim is to reveal the variations of the OCOG expenditures and revenues and the non-OCOG capital investments over time from bidding (t-8) to staging the Olympic Games (t) . Shown in percentages, the absolute value of the costs is unnecessary and has no influence on the comparisons . Furthermore, the use of percentages has allowed this study to compare and contrast the 10 editions of the Olympic Games that were analysed . This has been done by categorising the expenditures and revenues of the OCOG and building a fixed set of Olympic venues (hereafter referred to as a “basket of venues”) that are definitely needed and consistent across every Games edition for the non-OCOG capital investments . This “basket of venues” plays a similar role to the “basket of consumer goods” for tracking purchasing power (cost variation over time) in an economy . It also allows for a coherent comparison between different editions of the Games . Finally, the selection of venues represents a variety of capital investments and thus contains different potentials for cost overruns . The diversity of the basket ensures that the cost variations of these representative investments are relatively the same as those that a larger or full sample of all Olympic invest-ments would create .
The “core” basket reflects with high probability the “performance” of the full basket with some conservative distortions due to the fact that the “core” basket represents the highest level of project size and complexity . However, given that we have over-proportionally considered more venues financed using public money, the cost overruns are probably higher in our study than for the overall investments . Thus we take a conservative estimation here . The basket contains the Olympic Stadium, Olympic Village, IBC/MPC, swimming pool, multipurpose hall, velodrome, ski jumping hill, sliding centre and ice stadium . In other words, it can reasonably be assumed that almost all capital investments in sports venues were publicly financed
anyhow and that private investors are less likely to accept (or manage) cost overruns than public fund providers. Overall, the rate of cost overruns should be higher for public funding and, by often not including the share of private investment in this study, we are taking a conservative approach, as the overruns would tend to be reduced otherwise.
Tables 1 and 2 summarise the main findings . For all 10 Games editions an-alysed, we found that the operational costs of organising the Olympic Games (OCOG budget) are usually covered by revenues, which are almost entirely private resources and the IOC’s contribution, which stems from the sale of media rights and international sponsorships .
Table 1 Total cost overruns/ underruns from the Olympic Games89
Sydney 2000 Athens 2004 Beijing 2008 London 2012 Rio 20163 OCOG
Revenue 72% 51% 8% 50% N/A
OCOG
Expenditure 51% 30% 4% 48% N/A
Non-OCOG 56% 29%4 N/A 43% N/A
Table 1 shows the percentage change in the budget estimated eight years before the Games to the final budget . It clearly shows that, relatively, revenues are underestimated more than costs . In particular, for Sydney 2000 and Athens 2004, OCOG revenues were used to balance the public costs of the host cities . A small final profit was then shared between the National Olympic Committees (NOCs), the city and the IOC, in accordance with the Host City Contract . PyeongChang 2018 is the first host that can keep its profit (US$ 55m) entirely, without a share going to the IOC . This study will have considerable information about the “N/A” fields; however, for this table we were not able to produce a final figure due to a missing final budget from (t) .
3 The accounts for the Olympic Games Rio 2016 have not yet been formally closed at the time of our book, so there are no final numbers available .
The “basket of venues” used to measure the non-OCOG budgets demonstrates that the Olympic Games between 2000 and 2012 caused cost overruns from 29% to 56% . Rio 2016 managed to reduce the costs for the Olympic Stadium and its multipur-pose hall, which was partly renovated for the Pan American Games in 2007 . The public share of costs for the six core Olympic venues in Rio that are considered in our “basket” look low in comparison to media reports; however, there may have been large cost overruns for non-Olympic general infrastructural enhancements . The non-OCOG finances of Rio 2016 are not finalised, thus we have no comparable figure in Table 1 .
Table 2 Total cost overruns/underruns from the Olympic Winter Games10 Salt Lake
City 2002 Turin 2006 Vancouver 2010 Sochi 2014 Chang 2018Pyeong- 5 OCOG
Revenue 119% N/A 12% -3% 27%
OCOG
Expenditure 114% 58% 12% -6% 24%
Non-OCOG 28% 20% 13% 178% N/A
The cost and revenue development for the Olympic Winter Games shows a similar pattern . Salt Lake City 2002 experienced major changes in its OCOG budget, while Vancouver 2010’s variation was much lower . For all Olympic Winter Games editions, the OCOGs also managed to balance the expenditures and revenues . A key result is that over the 10 Olympic Games evaluated, the OCOGs always managed to end up with either a balanced budget or a surplus .
The non-OCOG cost overruns of Salt Lake City 2002, Turin 2006 and Vancouver 2010 were at a moderate 13-28% . The outlier was Sochi 2014 with 178% . Other than Sochi 2014, PyeongChang 2018 seems to have managed a reduction of its total costs . One year ahead of the Games the estimates were below the projections made eight years before . However, while the OCOG budget ended with a profit, we do not yet have the final budget for investments, which explains the N/A for these Games .
5 The accounts for the Olympic Winter Games PyeongChang 2018 have not yet been formally finalised at the time of our book, so there are no final numbers for non-OCOG budget .
Fig. 1 Total cost overruns/underruns of the Organising Committees for the Olympic Games for which final numbers are available at the time of our book
Figure 1 compares all the 10 Games editions used in this study . It shows that the percentage of cost and revenue overruns became lower after Turin 2006, which indicates better planning and management . For OCOG revenues, all OCOGs except Rio 2016 (not definitively confirmed) and Sochi 2014 achieved a revenue overrun against their projection eight years before . The expectations of all other eight cities were greatly exceeded . According to the recent report by PyeongChang 2018 to the IOC Session in Buenos Aires on 8 October 2018, the OCOG achieved a surplus of US$ 55m . Sydney 2000 had the highest difference (72%) for the Olympic Games; and Salt Lake City 2002, with 119%, was the highest for the Olympic Winter Games . Eight out of the 10 OCOGs analysed also had expenditure overruns . Rio 2016 (according to the data we have) managed to keep up with the prognosis in its Candidature File, and Sochi 2014 spent even less than predicted due to the high inflation during the time of preparation .
Another finding in this study is that the first few years of an OCOG’s lifecycle is the period in which they significantly overrun their expenditures . However, all OCOGs achieved savings during the last two years, thereby balancing the budget . An important contribution to balancing the budget is the high revenue overruns . This can be explained by the ever-increasing revenues of the Olympic Movement and the often conservative revenue estimate in the candidature files .
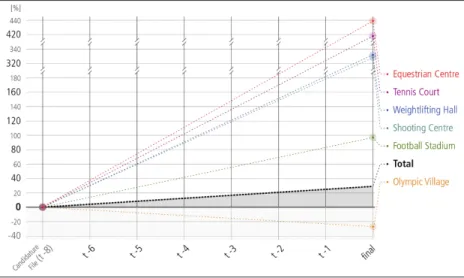
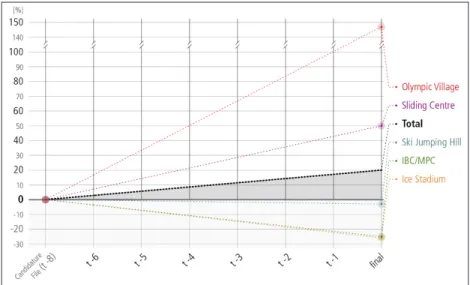
Regarding capital investments (Fig . 2), this study shows that core Olympic in-vestments (non-OCOG budgets) have cost overruns similar to other mega projects . However, we demonstrated that some Olympic venues were able to reduce projected costs while others had severe overruns . In our discussion, we explain other reasons .
Fig. 2 Total cost overruns of the non-OCOG budgets for which final numbers are available at the time of our book
Although it was possible to conclude that the capital costs of the non-OCOG budget do not present higher overruns than projects in other industries and busi-nesses, this study offers empirical evidence that a comparison of the Games or of Games investments as a whole with other mega projects cannot be reliable and is methodologically and academically questionable because of the following factors: 1 . The Olympic Games are unique in their composition of construction (stadium, sewage supply, telecommunications and power plants, airports and villages,
parks, etc .) and societal projects (education programmes, nation building and tourism advertisement, etc .), and thus no other branch can be compared to them . 2 . The Olympic Games and all construction projects are unique for each country
– thus making it impossible to compare the construction of a stadium in Brazil with one in Australia – due to different political and economic systems and public support levels, or national financial crises and inflation .
Our literature review provides a complete picture of reasons for cost overruns in mega projects and at the Olympic Games . The results show systematically that cost/ expenditure/revenue changes per Games edition, per expenditure/revenue category and per infrastructure . Thus, we illustrate that at the same Games edition, differ-ent categories have differdiffer-ent overruns . In most cases we were able to give logical explanations as to why these happened .
Overall in our study, we have been able to logically and theoretically explain which patterns caused cost overruns . These are not explained in the executive summary owing to their complexity . However, one of the main reasons for OCOG and non-OCOG cost overruns is the change of scope relating to expenses that were not planned at the beginning or that changed in the preparatory process, both on the side of the OCOG budget and for non-OCOG costs . Another reason is time pressure, which arises when the construction of venues begins too late .
We end with 18 recommendations for the IOC, OCOGs, host cities and public authorities:
R1 Host cities need to receive earlier guidance about the capital investments required for the Games .
R2 The IOC should alleviate pressure on cities during the bidding stage in order to reduce the risks of a “winner’s curse” (i .e . overestimating their benefits) . R3 The IOC should work against strategic low-cost estimates to protect the
taxpayer and should ensure that figures given are as realistic as possible . R4 The host city should start constructing the required infrastructure as soon
as the Olympic Games are awarded .
R5 The IOC should maintain responsibility for the agreed structural changes and enforce its overarching power to avoid unnecessary investments . R6 The IOC should ensure that the host city’s decision-makers have extensive
plans regarding the funding of each “required” Olympic investment . R7 The IOC should ensure that infrastructure costs that would have been incurred
R8 Cost and revenue projections should be estimated at the Games-time value . Inflation must be accounted for on the basis of consumer price indices and construction price indices .
R9 The host government should appoint a professional executive leadership . R10 The host government should report to the parliament annually on the
esti-mates of non-OCOG costs .
R11 Workforce and administration need to be budgeted with higher contingencies . R12 Legacy transformation costs need to be planned and budgeted from the very
beginning .
R13 The host city and the IOC should insist on maximising legacy through capacity reduction and post-event planning .
R14 The IOC should undertake measures together with the host government with a view to increasing transparency in relation to budget, cost and revenue changes .
R15 The delivery authority has to maintain a clear focus on the need for timely decision-making individually and collectively on an Olympic programme, in particular when there are multiple stakeholders and interests .
R16 The IOC should create a consistent financial category system to detect changes during and between Games .
R17 A first serious budget estimate should be made only once there is a valid overview of the overall project .
R18 The IOC should ensure that the Organising Committee conducts, in collab-oration with relevant partners, a cost-benefit analysis before and after the Olympic Games .
XIX List of Abbreviations
ATHOC Athens 2004 Organising Committee for the Olympic Games
B .C . British Columbia
BOCOG Beijing Organising Committee for the Games of the XXIX Olympiad
COJOPR Rio 2016 Organising Committee for the Olympic Games
COV cost overrun
DCMS Department for Culture, Media and Sport
EXPO Exposition Mondiale
FIFA Fédération Internationale de Football Association
FIS Fédération Internationale de Ski
GAO Government Accountability Office
GDP gross domestic product
IBC International Broadcasting Centre
IF International Sports Federation
IOBE Foundation for Economic & Industrial Research
IOC International Olympic Committee
LOCOG London Organising Committee of the Olympic Games and Paralympic
Games
MPC Main Press Centre
NOC National Olympic Committee
NSW New South Wales
OCA Olympic Coordination Authority
OCOG Organising Committee for the Olympic Games
ODA Olympic Delivery Authority
OSC Olympic Studies Centre
OSCC Olympic Security Demand Centre
PIP Public Investment Programme
POCOG PyeongChang Organising Committee for the 2018 Olympic &
PPP Public Private Partnership
RIOU Russian International Olympic University
ROV revenue overrun
SLOC Salt Lake Organising Committee
SOCOG Sydney Organising Committee for the Olympic Games
SOOC Sochi 2014 Organising Committee
TOROC Turin Organising Committee
USOC United States Olympic Committee
VANOC Vancouver Organising Committee for the 2010 Olympic and
Paralym-pic Winter Games
XXI List of Tables
Table 1 Total cost overruns/ underruns from the Olympic Games . . . XII Table 2 Total cost overruns/underruns from the Olympic Winter
Games . . . XIII Table 3 Cost overruns in infrastructure projects (April 1992 –
March 2009 in India) . . . 16
Table 4 Cost overruns in rail projects in different countries . . . 17
Table 5 Experts contacted to gather data . . . 25
Table 6 Comparison of estimated and real inflation of the total OCOG revenues . . . 28
Table 7 Definition of “baskets” for the non-OCOG budget . . . 32
Table 8 Percentage of public costs of the total costs of Olympic Games venues . . . 33
Table 9 Percentage of public costs of the total costs of Olympic Winter Games venues . . . 33
Table 10 Construction Price Index at Olympic host nations . . . 35
Table 11 GDP deflators in Olympic host nations . . . 36
Table 12 Exchange rates in the Olympic Games countries t-8 to t . . . 37
Table 13 Grouping of OCOG revenues . . . 38
Table 14 Grouping of OCOG expenditures . . . 39
Table 15 Grouping of non-OCOG investments . . . 40
Table 16 Comparison of cost estimates for Sydney 2000 pre-bidding . . . 45
Table 17 SOCOG revenue evolution of estimates and final . . . 47
Table 18 SOCOG expenditure evolution of estimates and final . . . 49
Table 19 Sydney 2000 non-OCOG costs evolution of estimates and final from public resources . . . 51
Table 20 SLOC revenue evolution of estimates and final . . . 54
Table 22 Salt Lake City 2002 non-OCOG cost evolution of estimates
and final from public resources . . . 59
Table 23 ATHOC revenue evolution of estimates and final . . . 63
Table 24 ATHOC expenditure evolution of estimates and final . . . 65
Table 25 Athens 2004 non-OCOG cost evolution of estimates and final from public resources . . . 67
Table 26 TOROC revenue evolution of estimates . . . 72
Table 27 TOROC expenditure evolution of estimates and final . . . 74
Table 28 Turin 2006 non-OCOG cost evolution of estimates and final from public resources . . . 75
Table 29 BOCOG revenue evolution of estimates and final . . . 77
Table 30 BOCOG expenditure evolution of estimates and final . . . 79
Table 31 VANOC revenue evolution of estimates and final . . . 81
Table 32 VANOC expenditure evolution of estimates and final . . . 83
Table 33 Vancouver 2010 non-OCOG cost evolution of estimates and final from public resources . . . 85
Table 34 LOCOG revenue evolution of estimates and final . . . 90
Table 35 LOCOG expenditure evolution of estimates and final . . . 92
Table 36 London 2012 non-OCOG evolution of estimates and final from public resources . . . 94
Table 37 SOOC revenue evolution of estimates and final . . . 98
Table 38 SOOC expenditure evolution of estimates and final . . . 100
Table 39 Sochi 2014 non-OCOG cost evolution of estimates and final from public resources . . . 102
Table 40 COJOPR revenue evolution of estimates . . . 106
Table 41 COJOPR expenditure evolution of estimates . . . 107
Table 42 POCOG revenue evolution of estimates and final total . . . 109
Table 43 POCOG expenditure evolution of estimates and final total . . . 111
Table 44 PyeongChang 2018 non-OCOG cost evolution of estimates from public resources . . . 113
Table 45 Total cost and revenue overruns/underruns for the Olympic Games . . . 114
Table 46 Total cost and revenue overruns/underruns for the Olympic Winter Games . . . 114
Table 47 Olympic Games estimated and final revenues – IOC contribution . . . 118
Table 48 Olympic Games estimated and final revenues – TOP sponsorship . . . 119
XXIII
Table 49 Olympic Games estimated and final revenues –
national sponsorship . . . 120 Table 50 Olympic Games estimated and final revenues –
ticket sales . . . 121 Table 51 Olympic Games estimated and final revenues –
licensing . . . 122 Table 52 Olympic Games estimated and final revenues –
lotteries . . . 123 Table 53 Olympic Games estimated and final revenues –
donations . . . 124 Table 54 Olympic Games estimated and final revenues –
disposal of assets . . . 125 Table 55 Olympic Games estimated and final revenues –
subsidies . . . 126 Table 56 Olympic Games estimated and final revenues –
total . . . 127 Table 57 Olympic Games estimated and final expenditures –
venues . . . 128 Table 58 Olympic Games estimated and final expenditures –
workforce . . . 129 Table 59 Olympic Games estimated and final expenditures –
technology . . . 130 Table 60 Olympic Games estimated and final expenditures –
services . . . 131 Table 61 Olympic Games estimated and final expenditures –
marketing & events . . . 132 Table 62 Olympic Games estimated and final expenditures –
administration & coordination . . . 133 Table 63 Olympic Games estimated and final expenditures –
total . . . 134 Table 64 Olympic Games estimated and final non-OCOG costs –
Olympic Stadium . . . 135 Table 65 Olympic Games estimated and final non-OCOG costs –
swimming pool . . . 135 Table 66 Olympic Games estimated and final non-OCOG costs –
multipurpose hall . . . 136 Table 67 Olympic Games estimated and final non-OCOG costs –
Table 68 Olympic Games estimated and final non-OCOG costs –
Olympic Village . . . 136 Table 69 Olympic Games estimated and final non-OCOG costs –
total . . . 137 Table 70 Olympic Winter Games estimated and final non-OCOG costs –
Olympic stadium . . . 138 Table 71 Olympic Winter Games estimated and final non-OCOG costs –
ski jumping hill . . . 138 Table 72 Olympic Winter Games estimated and final non-OCOG costs –
sliding centre . . . 139 Table 73 Olympic Winter Games estimated and final non-OCOG costs –
ice stadium . . . 139 Table 74 Olympic Winter Games estimated and final non-OCOG costs –
Olympic Village . . . 140 Table 75 Olympic Winter Games estimated and final non-OCOG costs –
IBC/MPC . . . 140 Table 76 Olympic Winter Games estimated and final non-OCOG costs –
total . . . 141 Table 77 Principal-agent relations in the bidding process for a mega
XXV List of Figures
Fig . 1 Total cost overruns/underruns of the Organising Committees
for the Olympic Games for which final numbers are available at the time of our book . . . XIV
Fig . 2 Total cost overruns of the non-OCOG budgets for which final
numbers are available at the time of our book . . . XV
Fig . 3 Number of participating countries in the Olympic Games
from 1896 to 2016 . . . 3 Fig . 4 Number of sports at the Olympic Games from 1896 to 2016 . . . 4
Fig . 5 Number of participating athletes at the Olympic Winter
Games from 1988 to 2018 . . . 4 Fig . 6 Factors causing cost overruns . . . 8 Fig . 7 Costs EXPO 2015 in billions of euros announced by different media . . 24 Fig . 8 Chronology of data collection . . . 24 Fig . 9 Methodology of data conversion . . . 30 Fig . 10 Organisations involved in the Sydney 2000 Olympic Games . . . 45 Fig . 11 SOCOG revenue evolution of estimates and final . . . 48 Fig . 12 SOCOG expenditure evolution of estimates and final . . . 50 Fig . 13 Sydney 2000 non-OCOG cost evolution of estimates and final
from public resources . . . 51 Fig . 14 Total direct cost for projects and activities related to planning
and staging the 2002 Olympic and Paralympic Winter Games in Salt Lake City . . . 53 Fig . 15 SLOC revenue evolution of estimates and final . . . 55 Fig . 16 SLOC expenditure evolution of estimates and final . . . 57 Fig . 17 Salt Lake City 2002 non-OCOG cost evolution of estimates
and final from public resources . . . 59 Fig . 18 Expenditure for the preparation of the 2004 Olympic Games
Fig . 19 ATHOC revenue evolution of estimates and final . . . 64 Fig . 20 ATHOC expenditure evolution of estimates and final . . . 65 Fig . 21 Athens 2004 non-OCOG cost evolution of estimates and final
from public resources . . . 68 Fig . 22 TOROC revenue evolution of estimates . . . 73 Fig . 23 TOROC expenditure evolution of estimates and final . . . 74 Fig . 24 Turin 2006 non-OCOG cost evolution of estimates and final
from public resources . . . 76 Fig . 25 BOCOG revenue evolution of estimates and final . . . 78 Fig . 26 BOCOG expenditure evolution of estimates and final . . . 79 Fig . 27 VANOC revenue evolution of estimates and final . . . 82 Fig . 28 VANOC expenditure evolution of estimates and final . . . 84 Fig . 29 Vancouver 2010 non-OCOG cost evolution of estimates and
final from public resources . . . 86 Fig . 30 Authorities/Organisations involved in delivering and
controlling the Olympic Games 2012 . . . 87 Fig . 31 Funding for the Olympic and Paralympic Games in London 2012 . . 88 Fig . 32 LOCOG revenue evolution of estimates and final . . . 91 Fig . 33 LOCOG expenditure evolution of estimates and final . . . 93 Fig . 34 London 2012 non-OCOG cost evolution of estimates and final
from public resources . . . 95 Fig . 35 Financing of the Winter Games Sochi 2014 . . . 97 Fig . 36 SOOC revenue evolution of estimates and final . . . 99 Fig . 37 SOOC expenditure evolution of estimates and final . . . 100 Fig . 38 Sochi 2014 non-OCOG cost evolution of estimates and final
from public resources . . . 103 Fig . 39 POCOG revenue evolution of estimates and final total . . . 110 Fig . 40 POCOG expenditure evolution of estimates and final total . . . 112 Fig . 41 PyeongChang 2018 non-OCOG cost evolution of estimations
from public resources . . . 113 Fig . 42 OCOG revenues and expenditures for the Olympic Games and
Olympic Winter Games . . . 115 Fig . 43 Non-OCOG investments for the Olympic Games and Olympic
Winter Games . . . 116 Fig . 44 Cascade of PRINCIPAL–AGENT relations . . . 149 Fig . 45 Number of change orders at SLOC . . . 158 Fig . 46 Budget evolution and financial gap at SLOC (2002) . . . 159 Fig . 47 Volatile budget development at SLOC (2002) . . . 160
1
1
1 Introduction
1 Introduction
In many countries the interest in the Olympic Games seems to have changed . The media raises the question whether cities will compete to host the Olympic Games in the future (Bull 2016) . It is evident that some applicant cities have withdrawn their bids for different reasons . The insecurity about cost overruns and the overall size of costs during the bidding, mixed with political discussions over host government spending of public money (Lundy 2013; Newman 2007) have led to concerns in western societies as regard the benefits of the Olympic Games for the host region (Coakley & Souza 2013) . This explains why many politicians attach the continuation of their bid to a positive public referendum . This is critical because, over the past six years, nearly every referendum has failed (Munich 2013, St . Moritz 2013, Vienna 2013, Kracow 2014, Hamburg 2015, Graubünden 2017, Innsbruck 2017 and Sion 2018) (Bull 2016; Reuters 2014) . Some cities even withdrew their bid before they had a referendum because of a lack of public or politicl support (Barcelona 2013, Oslo 2014, Boston 2014, Stockholm 2014, Rome 2016 and Budapest 2017) . Consequently, there is an increasing number of cities that are resigning from a bidding process or not entering the bidding process (Könecke & Nooij 2017) .
In this context, the phenomenon of cost overruns is important to raise (Zim-balist 2015) . One of the most prominent studies on cost overruns of the Olympic Games is by Flyvbjerg, Stewart & Budzier (2016), the so-called “Oxford study”, in which the authors start thinking about the reasons for cost overruns . The “Oxford study” compared total costs out of operational costs and capital investment costs of Olympic-related infrastructure from the candidature file to the final costs published
© The Author(s) 2019
H. Preuß et al., Cost and Revenue Overruns of the Olympic Games 2000 , Event- und Impaktforschung,
https://doi.org/10.1007/978-3-658-24996-0_1
for the Olympic Games from 1960 to 2016 . When looking at the overall economic costs of the Olympic Games for the public, one has, however, to also assess whether the revenues of the Organising Committee for the Olympic Games (OCOG) seem to overrun . Therefore the research we started here is threefold:
1 . What are the OCOG cost overruns and cost overruns on other capital invest-ments for the Olympic Games and Olympic Winter Games?
2 . What are the OCOG revenue overruns?
3 . How can the cost and revenue overruns be best explained?
Cost overruns are “the amount by which the actual cost exceeds the budgeted, estimated or target cost” (Business Dictionary, n . d .) . The allegedly rising cost overruns on which the media is reporting are bothering citizens, as a result of which candidate cities have revised their application for the Olympic Games (Oberli 2017) . If cost overruns (COV) are obviously caused by the Olympic Games (preparation, staging and legacy), then we should also observe overruns of the revenues (ROV):
COV => k . ROV
That will partly or entirely compensate for (and finance) cost overruns . This is the only way to explain why, despite recurrent cost overruns (Ct > Ct-n) at all Games, some Olympic Games ended up with a deficit while others made a profit . Indeed, starting from an ex-ante balanced Olympic Games budget such as:
Ct-n = Rt-n
where Ct-n (Rt-n) stands for the ex-ante announced cost (revenue) and Ct (Rt) for the achieved ex-post cost (revenue) measured in the same year’s price index .
Cost overruns should create a deficit since:
Ct-n + COV > Rt-n
However, it might not be the case if the OCOG budget or some non-OCOG budget succeeds in collecting more revenues than expected ex-ante, that is:
ROV = Rt – Rt-n
Then the final outcome (deficit or no deficit) depends on the comparative size of cost overruns and revenue overruns:
3
If ROV ≥ COV (1) => no deficit If ROV < COV (2) => deficit
In other words, an increase in the Olympic Games costs translates itself into higher expenditures for the OCOG, other hosting authorities and enterprises involved, but these additional expenditures should boil down to increased revenues for someone in the local economy (PricewaterhouseCoopers 2018) . At the end of the day, hosting the Games may end up in a deficit or not depending on the comparative magnitude of cost overruns and revenue overruns .
There are a number of published articles about cost overruns in the literature, but none about the Olympic Games revenue overruns (at least with such a title) . One value added of the present study is to check both .
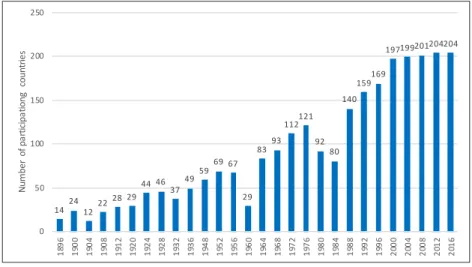
The objective of this study is to investigate the cost and revenue overruns of the Olympic Games from Sydney 2000 to PyeongChang 2018 . This provides a good over-view of the Olympic Games as they are managed today . The size of the Olympic Games from Sydney 2000 onwards marks a relative stable size in terms of athletes, venues and events and therefore it is worth comparing and learning from this comparison for future Games . The following tables indicate the relative stability in size regarding the number of athletes, sports and participating nations . These are important to argue why we decided to look only at the Olympic Games from Sydney 2000 .
14241222 28 29 44 46 3749 5969 67 29 8393 112121 92 80 140 159169 197199201204204 0 50 100 150 200 250 18 96 19 00 19 04 19 08 19 12 19 20 19 24 19 28 19 32 19 36 19 48 19 52 19 56 19 60 19 64 19 68 19 72 19 76 19 80 19 84 19 88 19 92 19 96 20 00 20 04 20 08 20 12 20 16 Num be r of pa rti cipa tio ng c ount rie s
Fig. 3 Number of participating countries in the Olympic Games from 1896 to 2016 Source: IOC (2018)
9 19 16 22 14 22 17 14 14 19 17 17 1617 19 18 21 21 21 21 23 2526 28 28 28 26 28 0 5 10 15 20 25 30 18 96 19 00 19 04 19 08 19 12 19 20 19 24 19 28 19 32 19 36 19 48 19 52 19 56 19 60 19 64 19 68 19 72 19 76 19 80 19 84 19 88 19 92 19 96 20 00 20 04 20 08 20 12 20 16 Num be r of spo rts
Fig. 4 Number of sports at the Olympic Games from 1896 to 2016 Source: IOC (2018) 0 500 1000 1500 2000 2500 3000 Calgary 1988 Albertville 1992 Lillehammer1994 Nagano 1998 Salt Lake City2002 Turin 2006 Vancouver 2010 Sochi 2014 PyeongChang 2018 Number of participants Male Female
Fig. 5 Number of participating athletes at the Olympic Winter Games from 1988 to 2018
5
Open Access This chapter is licensed under the terms of the Creative Commons Attribution 4.0
International License (http:// creativecommons.org/licenses/by/4.0/), which permits use, sharing, adaptation, distribution and reproduction in any medium or format, as long as you give appropriate credit to the original author(s) and the source, provide a link to the Creative Commons licence and indicate if changes were made.
The images or other third party material in this chapter are included in the chapter’s Creative Commons licence, unless indicated otherwise in a credit line to the material. If material is not included in the chapter’s Creative Commons licence and your intended use is not permitted by statutory regulation or exceeds the permitted use, you will need to obtain permission directly from the copyright holder.
7
2
2 Literature Review
2.1
Cost Overruns in General
2.1 Cost Overruns in General
2.1.1 What are Cost Overruns?
In any investment or other economic project that is going to last over several years between its inception date t – n and its delivery date t on time, the effectively achieved (ex-post) cost in t may happen to be higher than the announced (ex-ante) cost in
t – n . The longer n is, the higher the risk that such a difference will emerge . This
is clearly shown in our literature review in which we listed many reasons for that . The definition of cost overruns COV is thus:
COV = Ct - Ct-n > 0
where Ct-n stands for the ex-ante announced cost and Ct for the achieved ex-post cost measured in the same year’s price index . We have compiled all our data by using the respective GDP deflator . Thus we discounted Ct-n at a rate equal to the cumulative inflation rate between t – n and t . We explain that in our methodology section .
H. Preuß et al., Cost and Revenue Overruns of the Olympic Games 2000–2018, Event- und Impaktforschung, © The Author(s) 2019
2.2.2 Cost Overruns in Mega Projects and at Olympic Games
Cost overruns are a common phenomenon for major and mega projects . At bidding stage the International Olympic Committee (IOC) requires a robust analysis of public spending and the resulting economic benefits . Only transparency about cost over-runs will help considering the criticism about uncontrollable Olympic Games costs . Mega sport events are not the only project affected by cost overruns (Cantar-elli, Flyvbjerg & Buhl 2012; Flyvbjerg, Holm & Buhl 2002; Kostka & Anzinger 2015; Lundberg, Jepanitsub & Pyddoke 2011; McKinsey 2015; Odeck 2004; Pick-rell 1990; Singh 2010; Sovacool, Enevoldsen, Koch & Barthelmie 2016) . Delays in project implementations and cost overruns have repeatedly been a problem for public sector projects (Satyanarayana 1974) . Studies on cost overruns deal primarily with infrastructure projects involving the construction of railways, bridges and tunnels, roads, wind farms and buildings in general (Abdulkadir, Muhammad, Gidado & Nuruddeen 2017; Abusafiya & Suliman 2017; Ali, Ali Mangi, Sohu, Jamali & Kateemullah 2017; Cantarelli et al . 2012; Flyvbjerg 2009; Flyvbjerg, Holm & Buhl 2002; Kostka & Anzinger 2015; Lundberg et al . 2011; Odeck 2004; Pickrell 1990; Singh 2010; Sovacool et al . 2016) . Infrastructure proj-ects are mainly financed by public money . Nevertheless, literature is lacking on research into organisational projects such as events or the Olympic Games .
Technical
Factors causing cost overruns
Managerial resources Project
Environment Design Construction Experience Site Scope Financial contracts Financial policy External factors Internal factors Estimation process Planning Monitor and control Communication Political situation Material Labour Equipment Weather Location Event -specific
Economic regulation Political &
Fig. 6 Factors causing cost overruns
The reasons for cost overruns are manifold . The general factors causing cost overruns can be roughly categorised into technical, economic, managerial, political, environ-mental aspects and project resources (Abdel-Hafeez, El-Attar & Abdel-Hafez 2016) . In addition, these factors may be supplemented by specific event-related factors . Technically-based cost overruns
Technically-based cost overruns can be divided into design, construction, experience, site and scope . Changes in the design and bad overviews of drawings for the project are related to design aspects that can lead to cost overruns (Ali, Ali Mangi, Sohu, Jamali & Kateemullah 2017, 30; Berechman & Chen 2011; Creedy 2004; Creedy, Skitmore, & Wong 2010; Flyvbjerg, Bruzelius & Rothengatter 2003; Le-Hoai, Dai Lee & Lee 2008; Jackson 2002; Miller & Lessard 2000; Morris & Pinto 2004) . In addition, construction-related causes, such as poor technical performance, changes or disagreements that occur in the construction period, as well as the technical complexity of projects, or multiple tasks in different fields and delays in the proj-ect handover, can lead to cost increases (Abd-Karim, Memon, & Abdul-Rahman 2013; Alinaitwe, Apolot, & Tindiwensi 2013; Banaitiene & Banaitis 2012; Bruze-lius, Flyvbjerg & Rothengatter 1998; Flyvbjerg 2011, 322; Flyvbjerg, Bruzelius & Rothengatter 2003; Flyvbjerg, Garbuio & Lovallo 2009; Gajewska, & Ropel 2011; Kwak, Walewski, Sleeper & Sadatsafavi 2014; Lu, Luo, Wang, Le & Shi 2015; Memon, Abdul Rahman & Abdul Azis 2011; Miller & Lessard 2000; Morris 1990; Morris & Pinto 2004; Toh, Ting, Ali, Aliagha, & Munir 2012; Williams 2003, 2004; Zujo, CarPusic, & Brkan-Vejzovic 2010) .For the Olympic Games the following problems
concerning construction could be found:side costs of major construction projects,
e .g . the road and parking arrangements around venues and contractors’ problems with handling the size of the project (e .g . architect leaves, static problems, iconic venues are expensive to construct, size of the project; National Audit Office 2007a) . Another potential cost overrun in the design aspect is the experience in technical terms . Especially in the decision-making phase during the tendering process, the lack of experience and delays in the design and procurement phases are decisive (Alfouzan 2013; Bageis & Fortune 2009; Banaitiene & Banaitis 2012; Khodeir & Hamdy 2015; Mahamid & Bruland 2011; Shaqour 2014) .Another aspect for potential cost overruns is the site . On the one hand, the site conditions can be unpredictable; on the other hand, the organisation of the site can be poor (Shanmuganathan, & Baskar 2015; Singh 2011) . A last factor in the technical area is the scope . This means that additional work has been requested by the owner, the order of the project has changed and there is an inadequate definition of the scope (Ali et al . 2017, 30; Ali-naitwe et al . 2013; Berechman & Chen 2011; Creedy 2004; Creedy, Skitmore, &Wong 2010; Flyvbjerg 2011, 322; Gajewska, & Ropel 2011; Gomez Arcila 2012; Halloum &
Bajracharya 2012; Khodeir & Hamdy 2015; Morris 1990; Senouci, Alsarraj, Gunduz & Eldin 2016, 1; Shaqour 2014) . An example for this factor for the Olympic Games is the Atlanta Organising Committee, which forgot to include the space that was needed in the surroundings of the Olympic facilities (warm-up gyms, parklands, offices, etc .) . E .g . for Atlanta 1996, the need for warm-up courses, extra parking and the demolition costs of the old Fulton Stadium were not calculated in (ACOG 1994) . But also the change in technology and a varying demand for technology might lead to cost overruns for the Olympic Games .
Economically-based cost overruns
Factors that may cause cost overruns based on economics can be divided into financial contractors, financial policy, external and internal factors . Considering financial contractors they tend to select the lowest price, the lack of experience in contractors and poor contractor management can be responsible for price increases (Abd-Karim et al . 2013; Banaitiene & Banaitis 2012; Gomez Arcila 2012; Khodeir & Hamdy 2015; Koushki, Al-Rashied & Kartam 2005; Le-Hoai, Lee & Lee 2008; Mahamid & Bruland 2011; Shanmuganathan & Baskar 2015; Shaqour 2014; Singh 2011) . In addition, bad investment decisions, insufficient funding, methods of financing and payment problems for finished work are the causes of higher costs in the area of financial policy (Abusafiya & Suliman 2017, 35; Ali et al . 2017, 30; Gomez Arcila 2012; Khodeir & Hamdy 2015; Koushki, Al-Rashied & Kartam 2005; Shaqour 2014) . We found some evidence regarding financial policy that occurs during the planning phase of the Olympic Games: planning the finance as regards when and how much money needs to be taken from the market and the late founding of or a too small OCOG (regarding the construction control of venues to match Olympic needs) . Other cost increases can occur owing to external factors such as changes in the currency exchange rate, foreign companies and subsidies that dominate the construction industry, government policies like laws and regulations and economic instability (Alinaitwe et al . 2013; Ameh, Soyingbe & Odusami 2010; Khodeir & Hamdy 2015; Morris 1990; Shaqour 2014; Siemiatycki 2015) . In terms of the Olympic Games, it is almost to be expected that changes in exchange rates will occur, and therefore more or less money (in domestic currency) will have to be paid for debts or to international partners, topether with possible changes in interest or inflation rates . Ultimately, in the field of economics, internal factors such as poor contractor management, organisational variables and characteristics of the project and client may lead to cost overruns (Alfouzan 2013; Bageis & Fortune 2009; Khodeir & Hamdy 2015; Mahamid & Bruland 2011; Shaqour 2014) . For example, for Barcelona 1992 and Athens 2004, many private land owners increased prices before the construction could start (Botella 1995, 28) . Therefore, the stakeholder
response (in particular to encourage all stakeholders to support the project) has been recognized as an internal factor in the Olympic Games .
Managerially-based cost overruns
On the managerial side, there are cost overruns in different phases, starting with the estimate process, followed by the planning, the monitoring and control and the communication . During the estimate/planning process, an inaccurate or bad estimate of the final costs, or the use of incorrect or inappropriate methods for es-timating costs and the risk of the process can arise (Flyvbjerg et al . 2009; Halloum & Bajracharya 2012; Jackson 2002; Khodeir & Hamdy 2015; Mahamid & Bruland 2011; Shaqour 2014, Vanston & Vanston 2004, 33) . This is complemented by the theory of optimism bias established by Kahneman & Tversky (1979) . “The optimism bias is defined as the difference between a person’s expectation and the outcome that follows . If expectations are better than reality, the bias is optimistic; if reality is better than expected, the bias is pessimistic” (Sharot 2011, R941) . Problems in estimating the Olympic Games were mainly recorded in these areas:
• the practical examples of Olympic Games can be found in overestimating the size of existing infrastructure and its fit for the Games in the planning stage in terms of limited knowledge about size and scope,
• underestimating the need for accommodation for visitors and the Olympic family (the use of ships as accommodation in Sydney, Athens, London and Sochi; Golden 2013),
• underestimating transport infrastructure and parking space .
After the estimation process, various factors in the planning phase, such as an insufficient project analysis, unsuitable planning and scheduling or changes in the planning and scheduling and also wrong planning can lead to cost overruns (Abd-Karim et al . 2013; Al-Jurf & Beheiry 2010; Alinaitwe et al . 2013; Banaitiene & Banaitis 2012; Doloi 2013; Khodeir & Hamdy 2015; Gajewska, & Ropel 2011; Gomez Arcila 2012; Mahamid & Bruland 2011; Memon et al . 2011; Shanmuganathan & Baskar 2015; Shaqour 2014; Singh 2011; Toh et al . 2012) . Olympic-specific examples are: • forgetting the space needed surrounding Olympic facilities (warm-up gyms,
parklands, offices, etc .) . E .g . for Atlanta 1996, the need for warm-up courses, extra parking and the demolition costs of the old Fulton Stadium were not calculated in (ACOG 1994),
• poor planning and construction of venues (e .g . tennis courts faced the wrong direction (towards the sun) and had to be turned around, the swimming pool was notsuitable, so they constructed a new one,
• long decision-making processes and late realisation (e .g . delays in Athens (The Guardian 2003)),
• difficulties in finishing negotiations (partners speculate and use time pressure) or public procurements .
In the monitoring and control phase, one can observe poor site management, insufficient cost control, the complexity of the organisational structure, the lack of construction cost data, fraudulent behaviour and bribes causing cost increases (Abd-Karim et al . 2013; Abusafiya & Suliman 2017, 35; Alfouzan 2013; Alinaitwe et al . 2013; Ameh et al . 2010; Bordat, McCullouch, Labi & Sinha 2004; Le-Hoai et al . 2008; Doloi 2013; Mahamid & Bruland 2011; Memon et al . 2011; Toh et al . 2012) . Furthermore, insufficient and poor risk management can result in higher costs (Baldry 1998; Halloum & Bajracharya 2012; Kwak & Smith 2009; Patanakul 2014) . An example is London 2012, which had problems with contractors handling the size of the project (e .g . the architect left, static problems, iconic venues were expensive to construct, size of the project; National Audit Office 2007a) . Finally, further problems can occur in the communication . These factors are: poor coor-dination between the project participants and a lack of management knowledge (Alinaitwe et al . 2013; Halloum & Bajracharya 2012; Shaqour 2014) . Aspects of the lack of communication within the organisation, but also with external groups, were also identified in the case of the Olympic Games .
Politically- and regulation-based cost overruns
Further factors that have an influence on cost overruns can be found in politics and regulation . The political situation is crucial in order not to increase the costs . Therefore, non-supportive governmental policy, delays in decision-making by the government, lack of governmental control and regulations may support cost overruns (Ameh et al . 2010; Kasimu & Abubakar 2012; Khodeir & Hamdy 2015; Mahamid & Bruland 2011; Morris 1990; Siemiatycki 2014; Shaqour 2014) . These factors are supported by the theory of strategic misrepresentation . People systematically underestimate the costs and overestimate the resulting benefits (Flyvbjerg, Holm & Buhl 2002, 2005; Wachs 1989), which relates to the “winner’s curse”, which we will explain later in detail . Examples of political and regulatory difficulties with the Olympic Games are: • host city expectation of governmental or sponsor support,
• missing governmental guarantees at bid stage may turn out not to be provided, e .g . in Seoul the government had withdrawn its financial support in 1987 but was persuaded to return to support the Games,
• political changes and new agenda-setting (e .g . changed decision-making com-petencies),
• avoidance of responsibility or difficulties in defining responsibilities and com-petencies,
• conflicts of interests regarding the Games investment and legacy plans, • missing flexibility .
Cost overruns based on project resources
Project resources can be divided into material, labour and equipment . Regarding materials, the changes in the cost of building materials, the lack of construction materials in markets and material problems can lead to higher costs (Al-Jurf et al . 2010; Alfouzan 2013; Ameh et al . 2010; Bageis & Furtune 2009; Kasimu & Abubakar 2012; Khodeir & Hamdy 2015; Insja & Sihombing 2016; Mahamid & Bruland 2011; Shanmuganathan & Baskar 2015; Shaqour 2014; Singh 2011) . For example, for Rio 2016 an oil crisis occurred during the preparation period of the Games (Osborn 2017), but also steel delivery crises have taken place . In addition to the material, labour can also lead to cost increases . This happens when workers are absent or unqualified or have no experience (Ali et al . 2017, 30; Kasimu & Abubakar 2012; Khodeir & Hamdy 2015; Mahamid & Bruland 2011; Morris 1990) . Labour problems have occurred in the Olympic Games preparations where there is poor timing and recruitment of skilled personnel (suboptimal contracting) and workers’ strikes (e .g . in Sarajevo; Helbing 2015) . For increased costs, the equipment may be responsible if the machines are too expensive or equipment is missing (Abd-Karim et al . 2013; Memon et al . 2011; Toh et al . 2012) . So missing technical equipment from a stadium and other facilities might lead to higher costs .
Environmentally-based cost overruns
The last general category represents the environment, which is related to weather and location . On the one hand, unforeseen weather conditions may incur cost overruns; on the other hand, unsuitable climate conditions for working may be responsible (Doloi 2013; Singh 2011) . For London 2012, for example, weather led to delays and brought timing under pressure . In concrete terms, this can be the need to clear snow or the construction ground being too wet or frozen (e .g . too-wet ground in London; Magnay 2012) . In the end, poor field investigations, decisions for the wrong sites, land expropriation costs and relocation of inhabitants or
busi-nesses are the reasons why the location leads to cost overruns . In addition, costs for a sustainable site may have an impact on the overall costs (Alinaitwe et al . 2013; Ameh et al . 2010; Morris, 1990) .
Event-specific-based cost overruns
Some incidents that have occurred during the Olympic Games cannot be divided into the other categories . Therefore, the model was supplemented by the category event-specific factors . The event-related factors are:
• renovation of already existing stadiums – e .g . the roof of the Olympic Stadium in Barcelona was leaking even though it was newly built in 1989 (Botella 1995, 28), • size of follow-up costs to transform competition sites into its final use (legacy
transformation),
• effects of marketing campaigns to sell tickets or attract sponsors,
• cost effects caused by distance between the Olympic Village, the media village and sporting facilities (e .g . the lack of large plots of land in Athens 2004 (Richter 2012a) and Tokyo 1964 (Richter 2012b)),
• time pressure because of a fixed delivery date (e .g . for the FIS World Cup, archi-tects described the lack of planning and the delays this caused; Strande 2009), • contractors being late in obtaining more money for speedy construction (e .g . for
Atlanta 1996, the construction company for the Olympic harbour in Savannah quit and a new company had to be found),
• changing or adding events by International Federations (IFs) (in terms of li-censed equipment, etc .; e .g . new events in snowboarding, Alpine skiing, speed skating and curling in PyeongChang and new events in athletics, swimming and basketball in Tokyo 2020; CBC 2015; Homewood 2017),
• sudden unexpected need for an increased security level (e .g . Athens after 9/11 and the growing risks of terrorist attacks in Sochi; Sanburn 2012; Müller 2014, 634), • illness (epidemic) (e .g . Zika virus in Rio; Zagorsky 2016),
• inappropriate speed of growth of the OCOG and its structures .
Flyvbjerg (2011) mentions the underestimation of risks due to complexity, and changing scope during the implementation period as the major reasons for cost overruns . Jackson (2002) supports this view by saying that the most serious problem in project management is planning a budget for future investments estimated with inadequate information . According to Jackson, it is necessary and important for good planning to define the scope and complexity of the project in a clear manner from the earliest stages .
The 2012 FIS World Ski-Flying Championship in Vikersund, Norway, showed that a major reason for cost overruns was that, after the awarding of the event was made, priorities were often given to other things than constructing sports venues (see Solberg & Preuss 2015) .
Another trigger of costs turning out higher than planned is based on underesti-mated costs for the many capital investment promises that must be made during the bidding process . In the past, one could observe that the city that offered the “best” Games won and had to deliver . Cost underestimation would then lead to seriously higher costs than estimated, which is the so-called “winner’s curse” (Andreff 2012) . Massive cost overruns cause economic inefficiency . If investment decisions are based on underestimated costs, inputs may not be allocated to the most profitable projects . Major events are often supported financially by the public sector, and if politicians are guided wrongly by incorrect cost budgets, they may support events that they would otherwise have rejected if the information had been correct . We come back to this theoretical perspective in our results section .
Another factor of cost overruns has its roots in changing the overall project scope by adding detailed investment projects that are not really necessary for the Olympic Games, though host city politicians like to use the Olympic Games as an argument to get them financed . These constructions are not required by the IOC, e .g . the renovation of a post office, new hospital or theatre, a programme to renovate the historical or architectural patrimony . Additionally, often those who support the construction of infrastructure and sport venues are free riders who do not share in funding the venues, but benefit from them (see Solberg & Preuss 2015) . Often a major reason why massive cost overruns occur are extensions of the objectives after the events have been awarded . This applied to both the FIFA World Cup 2010 in South Africa and the World Skiing Championship 2012 in Norway, for which a number of stakeholders entered the scene after the events were awarded, with other objectives than just building sports venues . We come back to this theoretical perspective in our results section .
Finally the PRINCIPAL-AGENT theory helps explain cost overruns at mega sporting events that are awarded through bidding . The AGENT (the city) has quite realistic knowledge of the overall costs . However, due to information asymmetry towards the public (PRINCIPAL, as they are taxpayers) and the need for the public to support the bid, the city (AGENT) announces lower costs than expected . Right after being awarded the Games, much higher costs are announced, as happened for London 2012, for example . Preuss & Schnitzer (2012) explain a similar situa-tion for the FIFA World Cup . We come back to this theoretical perspective in our results section .
2.2
Comparative Issues
2.2 Comparative IssuesIn this study we also intended to compare cost overruns at the Olympic Games with those observed for other public projects . However, looking into the literature we have two concerns in doing this comparison:
1 . Cost overruns differ for different projects . This means that cost overruns for road construction cannot be compared with cost overruns for housing projects . To provide evidence, we looked for studies that investigated cost overruns in different branches, but in the same cultural area . Singh (2010, 45) shows that cost overruns are different in various project types in India . In total, India has an average rate of cost overruns of 15 .2%, but there are some areas where costs appear to be smaller than first estimated (e .g . coal, mines and telecommunication) . By contrast, there are areas in which costs increase even faster than the country’s average (e .g . finance, health and family welfare) .
Table 3 Cost overruns in infrastructure projects (April 1992 – March 2009 in India)
Sector Number
of Projects
% Cost Overrun
Mean Std. Dev. % of Projects with Positive Cost Overrun Atomic energy 12 15 .05 113 .12 25 .00 Civil aviation 47 -2 .27 40 .52 42 .55 Coal 95 -19 .90 73 .85 22 .11 Fertilisers 16 -12 .57 28 .92 25 .00 Finance 1 132 .91 0 100 .00
Health and family welfare 2 302 .30 92 .96 100 .00
I & B 7 14 .00 62 .97 42 .86 Mines 5 -33 .16 20 .65 0 .00 Petrochemicals 3 -12 .22 25 .92 33 .33 Petroleum 123 -16 .10 28 .96 20 .33 Power 107 51 .94 272 .50 46 .73 Railways 122 94 .84 178 .86 82 .79
Road transport and highways 157 15 .84 62 .46 54 .14
Shipping and ports 61 -1 .35 84 .35 31 .15
Steel 43 -15 .88 47 .78 18 .60
Telecommunication 69 -32 .09 57 .59 15 .94
Urban Development 24 12 .31 50 .27 41 .67
Total 894 15 .17 132 .27 40 .72
The comparison of studies about cost overruns in public sector projects shows differences in the amount and occurrence of cost overruns regarding the same kind of projects . There are also differences in the significance of the various factors worldwide when it comes to developing countries (Abdel-Hafeez et al . 2016; Aftab, Ismail, Noor & Ahmad 2014; Aibiniu & Jagbonon 2002; Flyvbjerg 2009; Inuwa, Saiva & Alkizim 2014; Singh 2010) . Comparing studies that analysed cost developments of investment projects in different countries makes it clear that country-specific differences exist .
2 . Cost overruns differ for different countries . This means that the same construc-tion projects cause different cost overruns in different countries .
To find evidence, we now need to focus on studies that investigated the same industry but in different nations . Comparing cost overruns of railway projects in different countries, big differences are noticeable . The highest cost overruns of approximately 95% are witnessed in India (Singh 2010) . Whereas the smallest cost increase points at the Netherlands with only 10 .6 % (Cantarelli, Flyvbjerg & Buhl 2012) . Flyvbjerg et al . (2002) compared cost overruns in Europe with those in the U .S . and other geographical areas, and came up with the conclusion that there are differences between other geographical areas (64 .4%) and Europe as well as the U .S . Even considering only one country, there are some differences in terms of cost escalations (Flyvbjerg et al . 2002; Love, Ahiaga-Dagbui, Welde & Odeck 2017; Pickrell 1990) .
Table 4 Cost overruns in rail projects in different countries Country Cost Overrun (%) Source
Australia 23 .00 Love, Zhou, Edwards, Irani & Sing 2017
India 94 .84 Singh 2010
Netherlands 10 .60 Cantarelli, Flyvbjerg & Buhl 2012 Sweden 17 .00 Riksrevisionsverket 1994 South Korea 48 .00 Lee 2008
United States 50 .00 42 .00 40 .80
Pickrell 1990
Love, Ahiaga-Dagbui, Welde & Odeck 2017 Flyvbjerg, Holm & Buhl 2002
Europe 34 .00 Flyvbjerg, Holm & Buhl 2002 20 countries on