HAL Id: halshs-03022318
https://halshs.archives-ouvertes.fr/halshs-03022318
Preprint submitted on 24 Nov 2020
HAL is a multi-disciplinary open access archive for the deposit and dissemination of sci-entific research documents, whether they are pub-lished or not. The documents may come from teaching and research institutions in France or abroad, or from public or private research centers.
L’archive ouverte pluridisciplinaire HAL, est destinée au dépôt et à la diffusion de documents scientifiques de niveau recherche, publiés ou non, émanant des établissements d’enseignement et de recherche français ou étrangers, des laboratoires publics ou privés.
Global Land Inequality
Luis Bauluz, Yajna Govind, Filip Novokmet
To cite this version:
Global Land Inequality
Luis Bauluz, Yajna Govind,
Filip Novokmet
June 2020
Global Land Inequality
Luis Bauluz
∗, Yajna Govind
†, Filip Novokmet
‡This version : June 2020
§Abstract
Agricultural land is vital for three out of four of the poorest billion individuals in the world yet little is known about the distribution of agricultural land. Existing cross-country estimates of land inequality, based on agriculture census data, measure the size distribution of agricultural holdings. These neither reflect land ownership inequality nor value inequality and often do not account for the landless population. In this paper, we tackle these issues and provide novel and consistent estimates of land inequality across countries, based on household surveys. We show that i) land-value inequality can differ significantly from land-area inequality, ii) differences in the proportion of landless across countries vary substantially, affecting markedly inequality estimates and, iii) regional patterns in inequality according to our benchmark metric (land-value inequality including the landless) contradict existing estimates from agricultural censuses. Overall, South Asia and Latin America exhibit the highest inequality with top 10% landowners capturing up to 75% of agricultural land, followed by Africa and ‘Communist’ Asia (China and Vietnam) at levels around 55-60%. .
JEL classification: Q15, O1
Keywords: Land Ownership, Inequality, Distribution
∗Bonn University, WIL
†Institut National en Etudes D´emographiques (INED), Paris School of Economics(PSE) ‡Bonn University, WIL
§This work is part of a larger project on land inequality by the International Land Coalition. We
acknowledge financial support by the International Land Coalition (ILC), the World Inequality Lab (WIL) and the Deutsches Institut f¨ur Entwicklungspolitik (DIE). We would like to thank Ward Anseeuw, Giulia Baldinelli and Thomas Piketty for helpful comments, Shalmali Ghaisas and Indu Chhatwani for research assistance and we are grateful to Daniel Sanchez Ordo˜nez for help at different stage of the project. This is a preliminary draft and the results provided here are provisional and subject to change.
1.
Introduction
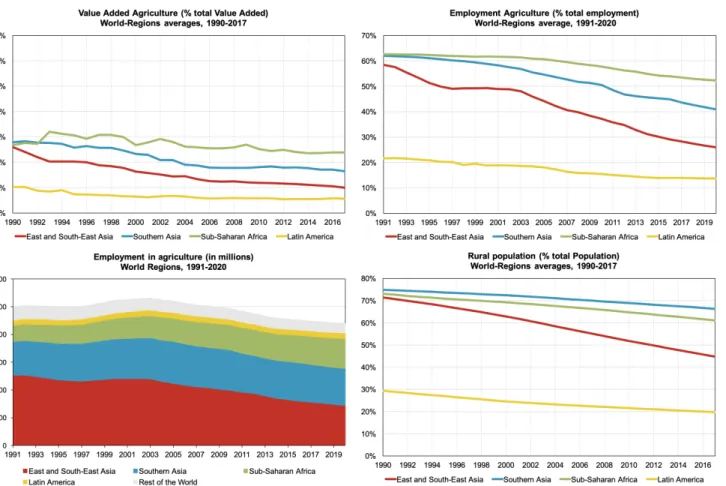
Agricultural land is vital for three out of four of the poorest billion individuals in the world, which depend on it and related activities for their subsistence (FAO, 2016). Over the last three decades, developing countries have gone through a profound economic transforma-tion, initiating a catch-up process with the advanced economies (Bourguignon, 2017). How-ever, this process of convergence has been very unequal, with only few countries (foremost, China) going through a significant process of industrialization (Rodrik, 2016), with vast parts of the developing world (notably, Southern Asia and Africa) following a much slower pace and fragile path (Lakner and Milanovic, 2015). Today, the number of agricultural workers worldwide is largely the same as 30 years ago (Figure1). Despite the importance of land for the world poor, we know almost nothing about its value and distribution, since the existing estimates neither reflect land ownership inequality nor value inequality and do not account for the landless population. Consequently, both policy makers and academic researchers lack the basic information to evaluate the economic conditions, and the ownership structure, in which the lives of the world’s poorest take place.
Precisely estimating land inequality is crucial given its relevance for debates that ranges from institutions, human capital accumulation to food security and poverty alleviation. Re-search has analyzed the effect of land inequality on economic development. Unequal dis-tribution of land adversely affects growth and development as it results in institutions that preserve the distributive status quo (S. Engerman and K. Sokoloff, 1997;K. L. Sokoloff and
S. L. Engerman, 2000). Land concentration hampers investment in education as these go
against the interest of land elites (Galor, Moav, and Vollrath, 2009). It can also affect, and be reinforced by, poor financial development (Binswanger and Deininger, 1999). Land concentration restricts small actors’ access to credit and hence restricting their land market access. The resulting poor institutions, inadequate investment in education and public good provision and under-development of the financial market are few channels through which land inequality affect growth and development (Deininger and Squire, 1998;Easterly, 2007;
Note: The upper left panel shows the trend of the share of value-added of agriculture in total value added. Upper right panel depicts the share of agricultural employment in total employment. Bottom left panel corresponds to the employment in agriculture in absolute numbers and bottom right panel shows the trend in the share of rural population in total population. These estimates are regional-weighted averages by country population sizes. Source: ILO and FAOStat.
Fig. 1. Global trends in agriculture since the 1990s
Existing cross-country estimates of land inequality, and the ensuing literature which anal-yses its effect on economic outcomes, are based on the distribution of the size of operational holdings as per agriculture census data (Taylor and Jodice, 19831; Deininger and Squire,
19982; Frankema, 20103). Operational holdings are economic units of agricultural
produc-tion under single management (FAO, 2018). Hence, these estimates pose serious conceptual challenges for measuring land ownership inequality since they do not capture the ownership of land holdings nor do they account for differences in the value of land (e.g. due to soil quality or location). It is thus unclear whether the distribution of the area of holdings from
1For 54 countries in the 1960s, based on FAO World Census Agriculture 2261 observations for 103 countries, based on FAO World Census Agriculture
3186 observations for 105 countries, based on census data from the International Institute of Agriculture
census data reliably captures overall land inequality. There is a need to assess the validity of this link and define the concept of land inequality that is the most pertinent in the context of developing countries.
The contribution of this paper is to provide consistent estimates of land ownership in-equality across countries and regions of the world, both in terms of area and value, accounting for the landless population. Departing from the use of agricultural censuses, we exploit sur-vey data which allows us to focus on the land privately owned by a household rather than merely holdings, the former being more appropriate when analyzing land ownership inequal-ity4.
Additionally, while land area inequality provides an idea of the distribution of land, ac-counting for the differential value of land owned by households might give a different picture. This is the first paper to present and explore the relationship between land area and land value inequality. Finally, since agricultural censuses do not capture the landless individuals, this part of the population has substantially been disregarded in the literature and at best only roughly proxied. This is a consequential shortcoming as variations in ownership rates across countries are unaccounted for. Moreover, the landless are precisely the most vulner-able as they are at the bottom of the distribution but still heavily rely on the work and use of land. In this paper, we will provide and compare estimates of land inequality including and excluding the landless population.
The paper is organized as follows: In the next section, we provide a discussion on the different concepts with respect to land inequality and their implications. We then describe the data and methodology used in this paper in section 3, followed by the main results in section 4. We first examine the link between the area of holdings inequality from censuses and our estimate of land ownership area inequality from the survey. We then provide esti-mates on both land area and value among the owning class. Our results show that land value inequality provides a different picture than land area inequality and confirms the need to take both into account. Our results further show that accounting for the landless increases land inequality unequally between countries due to differences in ownership rates.
This paper thus makes an important contribution in showing the need for more critical
4At this stage of the project, we only account for land that is privately owned. Hence, we do not
include communal land as part of the land owned by households. In future versions of the paper we plan to incorporate the role played by communal land across different countries.
use of existing estimates based on census data. It is also the first to provide comparable estimates of land inequality, under different definitions, in various countries across the world. We provide a novel perspective on international patterns of land inequality. Our benchmark metric of agricultural land inequality (i.e. inequality of land value when including the landless population), reveals the regional patterns whereby South Asia and Latin America are the most unequal world regions, followed by relatively more egalitarian African countries and finally ‘Communist’ Asia (China and Vietnam) as the least unequal world region.
2.
Literature Review
The literature on land distribution has long relied on estimates of land Gini coefficients using agricultural censuses which provide tabulated data on the number of holdings and the total area of holding by size classes (Deininger and Squire, 1998 ; Frankema, 2010). These estimates face various challenges.
First, land distribution calculated using the agricultural census captures the distribution of operational holdings (i.e. economic units of agricultural production under single manage-ment) rather than land ownership. From a distributional point of view, the latter is more relevant because agricultural census does not necessarily account for multiple landholdings per owner5 and fails to capture the full extent of land concentration6.
On the other hand, household surveys often have an agricultural module which collects detailed information on the land at the household-level. The advantages of this source are numerous. Surveys provide a better idea of landownership inequality since each plot of land is linked to the household owning them, unlike the census data. The survey also allows to make a distinction between privately owned land and operated land - the land that is merely utilized by the household, for instance through renting or sharecropping.
The sparse literature relying on surveys has focused on the distribution of the latter. While it gives an idea of the extent of access to land in terms of utilization, it is not
equiv-5“The holding’s land may consist of one or more parcels, located in one or more separate areas or in
one or more territorial or administrative divisions, providing that they all share such means of production as labour, farm buildings, machinery or draught animals. Several different economic agricultural production units under the same ownership, or under the same general management, may be considered as separate holdings if they are operated by different persons.” (FAO, 1999)
6As explained by Vollrath, 2007, p. 204, the distribution of operational holdings does not capture the
distribution of land ownership. The distribution of land holdings is relevant if “we are interested in efficiency, not equity”.
alent to land ownership. In fact, households that operate land which they do not own will need to compensate the land owner for the land use through rent payments or sharecropping. Moreover, land owned can also be used as collateral to have access to credit and rented out or sold in case of need for liquidity, hence the need to distinguish between merely operated and effective ownership in survey data (Doss et al., 2015).
Second, differences in the value and quality of land are not measured in agriculture censuses. Unlike agricultural census, surveys often provide information on the area (GPS measures and farmers’ estimates) as well as the market value of land at the household level. The distribution of land in terms of area might not be equivalent to the same in terms of value. For instance, if larger landowners have disproportionately more valuable land, then land area inequality would not reflect the full extent of the unequal distribution. This paper bridges the gap in the literature when it comes to land value inequality and provides consis-tent estimates across countries.
Additionally, census data, by definition, does not account for the landless households. This may not portray the actual levels of inequality or provide comparable estimates across countries. For instance, based on inequality estimates within landowning households, a coun-try where land is equally distributed among only a handful of landowners will have a lower level of inequality compared to another country with a more disparate distribution of land ownership but among a larger share of landowning households. There is thus a need to include landless households to account for the full picture. In fact, Erickson and Vollrath, 2004 shows that that the established effect of land inequality on institutions and financial development are sensitive to the inclusion of the landless population.
Erickson and Vollrath, 2004 proposes a complementary measure of inequality which is
the ratio between agricultural population and the number of holdings, which aims to capture the extent to which holdings are widespread across the relevant population, using FAO data. However, the implicit assumption behind such a proxy for landless household is that each agricultural holding has a single owner. Despite being an improvement vis-`a-vis the existing literature, it faces similar concerns as the existing literature on land inequality.
Departing from census data, we exploit household surveys which are mostly nationally-representative and hence effectively designed to capture all types of household, whether landowning or landless. In this paper, we estimate inequality including and excluding land-less households, to provide evidences of the issue that arises when they are not accounted for.
Finally, as argued by Lowder, Skoet, and Raney, 2016, the coverage and methodology for agricultural censuses are not uniform between countries and over time, especially in de-veloping countries, despite efforts by the FAO to bring uniformity. Agricultural censuses in different countries do not distinguish between different legal ownership forms and can also have different minimum thresholds to record holdings, further reducing comparability. Household surveys, on the other hand, provide the flexibility required to make them most comparable across country and over time. Some papers in the literature have instead turned to household surveys to assess land distribution in different countries (see Doss et al., 2015
for a review on gendered land outcome in Africa based on surveys).
The above-mentioned factors suggest that agricultural census data does not allow to grasp the full extent of land inequality. For this purpose, surveys can provide a valuable source of data. Surveys are not devoid of issues and some of the caveats relate to the fact that surveys only capture household land and miss part of government-owned land, as well as private corporate farms. Estimates of the share of total agricultural land operated by family farms7 ranges between 53% (Graeub et al., 2016) under a more conservative approach and 73% (Lowder, Skoet, and Raney, 2016). Another concern regarding household surveys is the under-reporting at the top of the distribution.
Despite the caveats of survey data, we believe that it remains a relatively better source when estimating land ownership inequality. It provides detailed data on the land owned by a household, which allows for an in-depth analysis of land ownership inequality in terms of area and value, accounting for the landless. To the best of our knowledge, this paper is the first attempt to provide comprehensive estimation of the distribution of landownership of area and value inequality that is comparable across countries, spanning different continents, exploiting household surveys.
3.
Data & Methodology
In this paper, we start by revisiting and estimating up-to-date land area inequality es-timates based on agricultural census data. This data source is overseen and centralized by UN’s Food and Agriculture Organization (FAO) and is published at the country-level
ev-7According to Lowder, Skoet, and Raney, 2016, communal lands are generally not included in the
ery decade under the Programme for the World Census of Agriculture (WCA). The unit of analysis - operational holding, is defined as “an economic unit of agricultural production under single management comprising all livestock kept and all land used wholly or partly for agricultural production purposes, without regard to title, legal form or size” (FAO, 2018). The FAO census data typically provides estimation of the total number of holdings and the corresponding area for all farms, including family farms, government lands and private corporations’ holdings8. Reports of agricultural census provide tabulated distribution of op-erational holdings by size brackets9.
Previous estimates of land distribution based on this source cover most of the 20th cen-tury with only few estimates in the early 2000s (Deininger and Squire, 1998; Frankema, 2010). In this paper, we re-estimate and update the land inequality estimates based on census data, up to the most recently available data. Given the tabulated format of the data, we use the generalized Pareto interpolation method (Blanchet, Fournier, and Piketty, 2017) to update census-based inequality estimates.
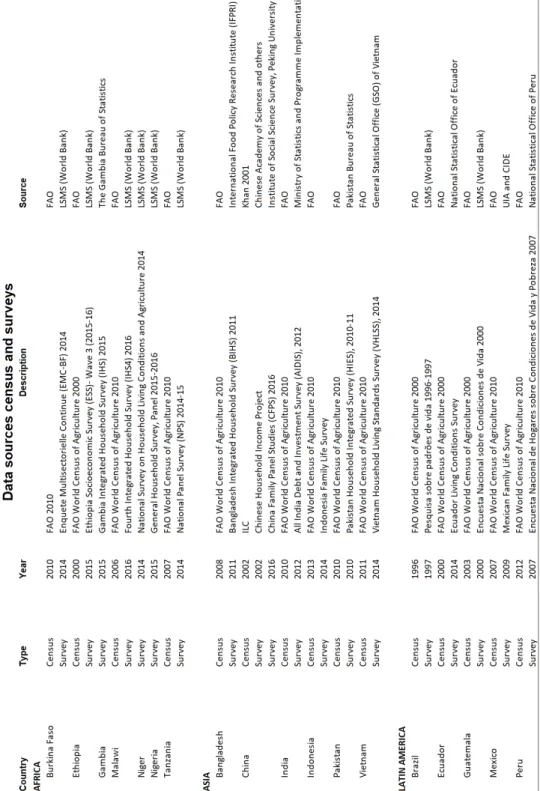
As explained previously, we then exploit household surveys to provide estimates on land area and value distribution, as well as including the landless population in different countries across the world. There are two main types of surveys that are used in this paper: World Bank’s Living Standards Measurement Surveys (LSMS) and official household surveys of dif-ferent countries. The first two types of surveys generally comprise of an agricultural module which collects information about the fields or plot owned by the household. The relevant information for estimating land ownership inequality is the land area, reported value and an indication of ownership.
The choice of countries in this paper is based on the availability of household surveys capturing the ownership of land (table A1). In some countries the quality of the data was not sufficiently good and were, therefore, excluded from the analysis. Most surveys available in the different countries have a very short temporal dimension (e.g. in various cases only one year of data is available). For this reason, we restrict our analysis to a single observation per country and do not analyze trends in the concentration of agricultural land10.
8The sector coverage, however, varies across countries and over time. For example, most African countries
only cover land operated by the household sector (for instance, excluding corporate land).
9Some countries further provide decompositions by tenure, gender, land use and crops.
10In future versions of this paper, we plan to exploit the time dimension in cases where data would allow
Our object of analysis is to measure the distribution of land ownership. Land owner-ship in this paper is defined as any agricultural land over which the household has private property rights. This is fairly consistently defined across countries. China and Vietnam are special cases, where private property is less clearly defined but where rural household are provided extensive rights over the land (e.g. rights to control, dispose and inherit the land; McKinley and Griffin, 1993; Li and Zhao, 2007; Do and Iyer, 2003; Piketty, Yang,
and Zucman, 2019). At the moment, we do not include communal land in our definition of
ownership but we plan to investigate it in future versions of the paper, as it plays a relevant role in certain countries (e.g. in Africa or Latin America).
In this paper we focus on two ways of measuring the agricultural land owned by a house-hold. The first is in terms of area of agricultural land (i.e. the size of the land holdings owned by a household)11. The second way is in terms of value of agricultural land. The latter is
our preferred measure since it accounts for the large heterogeneity of land types within a country and captures the value of land as an asset. Survey-reported values are based on the concept of current market value, where the agricultural land is valued at prevailing market prices12.
To describe the distribution of agricultural land we use standard measure of inequality such as the Gini coefficient and land shares (i.e. the percentage of the land owned by a population group such as top 10%, middle 40% or bottom 50%). Although Gini coefficient has been predominantly used in land inequality studies based on census data, we prefer to use land shares. The Gini index is a synthetic inequality measure which summarizes the entire distribution into a single number, and it is thus less informative about where the important changes in the distribution take place. In the appendix, we show both measures and that they provide a consistent picture of cross-country differences in the agricultural land inequality.
We measure land ownership inequality within two population groups. The first
popula-11Note that agricultural land area is reported both in agricultural census and surveys. The difference is
that surveys measure landownership at the household level while agricultural censuses measure the land area of operational holdings.
12The valuation practice in surveys is generally based on subjective assessment of respondents (the surveys
generally ask the question along the lines: “What would be the amount received if the land was sold today?”), but are often complemented by external assessments based on administrative data. In certain instances, in particular in the absence of well-functioning agricultural land markets, the survey design evaluates the market value of land using alternative approaches, such as by capitalizing agricultural income (for example, this is an approach assumed in China Family Panel Study (CFPS).)
tion group are the landowners (i.e. those households owning land). Our second group is the landowners plus the landless households. The latter is our benchmark unit, since it is impor-tant to account for the landless households to have a complete picture of the land inequality. Surveys are extremely useful in examining the landless population, since they capture both the population of households living in rural areas as well as professional activities of each member of a household, including agriculture. This information, together with the number of households that are landowners, allows us to identify the population of ‘landless house-holds’. We define landless households as those where at least one of its members is employed in agriculture but does not report owning any agricultural land.
4.
Results
4.1.
Census v/s survey
The previous work on the cross-country measurement of the distribution of landowner-ship has been based on information in the agricultural censuses. However, as argued above, the agricultural censuses do not relate to ownership units, but rather to operational (or pro-duction) units. The implicit assumption behind is that the size distribution of operational holdings provided in censuses serves as a proxy for the distribution of landownership. More-over, the use of census data has restricted the analysis to the inequality of land area, and not of land values, as well as to inequality among landowners, excluding landless.
Given the wide use of census-based estimates in the literature, as a first step, it is useful to examine the extent to which the size distribution of farms reflects the distribution of land-area ownership. Figure 2 compares agricultural land inequality estimated from the survey and census data. More precisely, it shows the Gini index for the distribution of land area: i) among households owning land from the survey (x-axis), and ii) among land holdings from the agricultural census (y-axis). In order to ensure comparability, we select rounds of survey data that are the closest to the census year.
Interestingly, the Gini index is broadly comparable according to the different definitions in the two data sources (the regression line is almost equivalent to the 45-degree line). We find, according to both sources, that land inequality is highest in Latin America, assumes an intermediate position in Asia and lowest in Africa.
Given that the two estimates of land inequality tend to coincide, it suggests that land-holdings’ area inequality can be an appropriate proxy for land area ownership inequality. However, the various caveats of census data, such as the inconsistencies in terms of coverage (household, corporate or government sector included or not in an unsystematic way) should be kept in mind. Additionally, while census data could be seen as a first approximation for land area inequality, it does not reflect land value inequality. The next section expounds on this by including different dimensions of inequality to arrive at our benchmark inequality concept, which is that of the distribution of the agricultural land value among rural house-holds (including both landowners and landless).
Note: This graph includes Brazil, Mexico, Peru and Burkina Faso for which we have land area estimates from the survey but no information on value. They are hence not part of the next sections. Conversely, Gambia, Nigeria and Niger do not appear in this figure as there are no census information on the distribution of holdings. In order to ensure comparability, we select rounds of survey data that are the closest to the census year.13
Fig. 2. Gini index based on census and survey data
13The countries and year of the survey in the graph correspond to BGD – Bangladesh (2011); BFA
- Burkina Faso (2014); BRA-Brazil (1996); CHN- China (2002); ECU- Ecuador (2014); ETH - Ethiopia (2011); GUA - Guatemala (2000); IND - India (2012); IDN – Indonesia (2014); MWI - Malawi (2010); MEX-Mexico (2009); PAK- Pakistan (2010); PER - Peru (2007); TZA - Tanzania (2018); VNM - Vietnam (2014).
4.2.
Distribution of land area v/s land values
The value of one hectare of agricultural land can vary widely within a country, with nu-merous factors explaining these differences: diversity in soil quality (Benjamin, 1995), type of agricultural cultivation (e.g. cropland vs pastures), access to irrigation and agricultural capital, area of the agricultural holding (Barrett, 1996; Martinelli, 2016), land markets reg-ulation (Restuccia and Santaeulalia-Llopis, 2017), factor market imperfections (Sen, 1966), etc. It is clear that agricultural land is not a homogeneous asset and that estimates of land-area inequality fail to capture the diversity of values across land holdings.
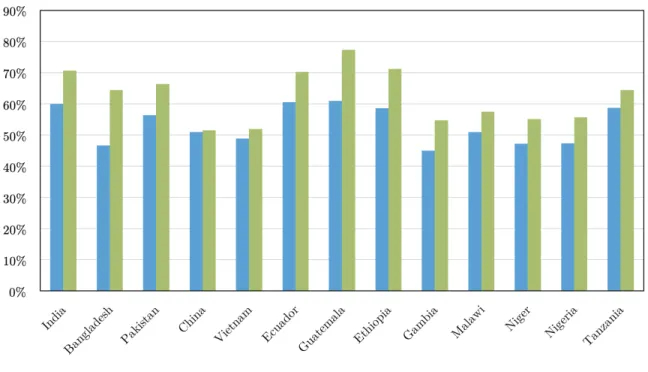
We go one step beyond previous studies and compare the inequality of land area with that of land values in household surveys, whenever this information is available. Figure 3
portrays the distribution of agricultural land within landowners for the most recent year for which data are available, using two measures of agricultural land: i) land area (orange bars); ii) land values (blue bars). In other words, the figure shows the share of total agricultural land owned by the top 10% landowners, according to the two measures.
Importantly, the results indicate that land-value inequality can be significantly different from the land-area inequality. The comparison of India and Ethiopia, on one hand, with Ecuador and Guatemala, on the other hand, is particularly informative. The first two coun-tries show relatively lower levels of land-area concentration when compared with the second set of countries. Namely, the share of the top 10% landowners in Ecuador and Guatemala is twice that of India and Ethiopia14. From this perspective, the inequality between these two groups of countries is remarkably different. Based solely on these estimates, Ethiopia and India would be assessed as relatively egalitarian countries compared to Ecuador and Guatemala which are extremely unequal according to any standard. However, results for land-value inequality (as opposed to land-area inequality) completely change this compari-son. Under the land-value metric, differences between the four countries virtually vanish, as the top 10% landowners own around 60% of total agricultural land values in all four countries.
Generally, our results point to important differences between land-value inequality and land-area inequality. In particular, Guatemala and Ecuador seem to be exception to the rule: land-area inequality tends to be higher than land-value inequality, unlike in other countries. One potential explanation for this result is that the largest holdings in Latin America are substantially less productive than medium-to-low-sized holdings. This would be broadly
con-14More precisely, 80% of the total agricultural land owned by the top 10% in Ecuador and Guatemala vs
sistent with FAO’s data on the surface of agricultural land covered by cropland and pastures in each country, which indicates that pastures cover a larger percentage of the agricultural land surface in Latin America than in most of the countries in our sample. In other words, such differences could be explained if the largest land holdings in Ecuador and Guatemala mostly consist of low-productive pastures. This aspect requires further examination.
Note: This graph provides estimates of the top 10% share of area and value among the owning class, both from the urban and rural area.
Fig. 3. Top 10% share of area and value among owners
4.3.
Accounting for the landless population
As explained in previous sections, a meaningful measurement of the distribution of agri-cultural land should not be restricted to the landowners. While within-landowners inequality provides useful insights on the structure of inequality, a comprehensive assessment of inequal-ity needs to include the landless population (i.e. those directly involved in agriculture but do not own land).
for land value within: (i) landowners (blue bars); (ii) landowners and landless households (green bars). In addition, table 1 shows the share of landless households in the population of landowners plus landless households. Results in Figure 4 shows that including landless households is important for levels of inequality. More specifically, regions with highest shares of landless households witness larger increase in the levels of inequality.
Three patterns are worth mentioning; first, Southern Asia (i.e. India, Bangladesh and Pakistan) and Latin America (i.e. Ecuador and Guatemala), become the most unequal re-gions, with the top 10% share rising from 45-60% to up to 70%, and bottom 50% falling from 7-10% to 0-2%. In both regions, the landless tend to account for more than one third of the reference population.
In contrast, inequality in China and Vietnam is not significantly affected by the inclusion of the landless population, with a few percentage points increase in top 10% shares (decrease in bottom 50% shares). This is driven by the very low shares of landless households, around 3-12%. This is explained by the historical land reforms carried in these countries during the implementation of the communist regimes, which still today provides wide-spread access to agricultural land to most households in the rural areas.
Finally, African countries have levels of landless population which are somehow in be-tween. Hence, the change in the levels of inequality when switching from one population concept to the other is in between the two groups of countries as well.
Overall, it is clear that any assessment of land inequality that excludes the landless pop-ulation would result in an incomplete understanding of the complex structure of inequality present in the different countries.
Fig. 4. Fig. 4a (upper panel) and Fig. 4b (lower panel) : Top 10% and the bottom 50% shares of land value among the owning class and including the landless
Note: This table provides the proportion of landless household out of the landowning and landless households. The household is defined as landless i) if it does not own any piece of land and ii) if at least one household member participates in the agriculturally-related activities. We include Brazil and Peru in this table since we observe the percentage of landless households, despite surveys not covering the value of land. Hence, they are not included in subsequent analyses.
Table 1: Share of landless households
4.4.
From within-landowners land-area inequality to accounting for landless
and land values
Figure 6 summarizes the main results of the paper. It shows, alongside, top 10% and bottom 50% agricultural land shares for the three concepts used in this paper: (i) land-area inequality within landowners; (ii) land-value inequality within landowners; (iii) land-value inequality within the population of ‘landowners plus landless households’. Instead of pre-senting results at the country level (as done in previous sections), Figure 5a and 5b shows the unweighted-country averages for the following for 4 World regions: (i) Southern Asia: Bangladesh, India, Pakistan; (ii) China and Vietnam; (iii) Latin America: Ecuador and Guatemala; (iv) Africa: Ethiopia, Gambia, Malawi, Niger, Nigeria and Tanzania. The country grouping is not only based on their geographical location, but also on the common patterns in the ownership of agricultural land and in their macroeconomic trends (e.g. pro-portion of employment and value added in agriculture; share of rural population, etc.).
Figure6a and6b condenses the main patterns documented in the paper. First, Southern Asian countries appear as a moderately equal region when looking at the distribution of land
area within landowners. However, they have among the highest levels of inequality when land values and the landless population are included. China and Vietnam, by contrast, display higher levels of land-area inequality within landowners than both Southern Asia and Africa, but the land concentration is only slightly higher when land values and landless households are considered. Overall, China and Vietnam appear as the least unequal world region in our sample according to our benchmark inequality indicator.
The Latin American case (at least as reflected by Ecuador and Guatemala) displays the most unequal distribution of agricultural land area within landowners. This fact also applies to Mexico and Peru (Figure 2), and has been documented for most Latin American based on agricultural censuses (Frankema, 2010). Unlike the other world regions, land inequality within landowners is substantially lower in value than in area. Once the landless population is included, similar land inequality patterns are observed, with land-value inequality in Latin America also displaying one of the highest levels.
Finally, the African countries take an intermediate position between China and Vietnam, on one hand, and Southern Asia and Latin America, on the other hand. Africa has the lowest levels of land-area inequality among landowners, and rises gradually when land values and the landless population are included.
Fig. 5. Fig. 5a (upper panel) and Fig. 5b (lower panel) show the top 10% and the bottom 50% shares of land area and land value among the owning class and including the landless
4.5.
Conclusion and Next Steps
This paper provides the first consistent estimates of the agricultural land inequality in developing countries. As such, it presents the most comprehensive overview of the different dimensions of the agricultural land inequality and emphasizes the importance of using well-defined concepts and clear measurement methodology. Notably, we show that we need to go beyond the existing studies looking at the size distribution of agricultural holdings based on agricultural censuses. The existing estimates neither reflect land ownership inequality nor value inequality and do not account for the landless population. We advocate instead the use of household surveys as the most appropriate data source to estimate land ownership in-equality across countries, both in terms of area and value as well as to account for non-owners.
Our new estimates provide novel perspective on international patterns of land inequality. According to our benchmark metric of agricultural land inequality (i.e. land-value inequality including landless population), South Asia and Latin America exhibit the highest inequality, with top 10% landowners capturing up to 75% of agricultural land and bottom 50% owning less than 2%. The African countries display relatively less unequal land ownership patterns, while ‘Communist’ Asia (China and Vietnam) is the world region with lowest inequality.
Having said this, we need to stress that current results present a first attempt at assess-ing the agricultural land distribution in developassess-ing countries. Although we have included the most populated countries in the analysis, we intend to cover more developing countries to obtain a more complete picture. For this, we are also developing robust approaches to impute land values in countries for which surveys provide information on land area only (e.g. Mexico, Mongolia, etc.).
Next, we indicate several methodological extensions of the current work. First, we need to critically assess the role of different land ownership forms, especially those for which the border with private property is not clear-cut (e.g. such as the role of communal land). Re-latedly, we need to better understand the importance of corporate land and public land and its impact on distributional patterns. In the future, an effort to combine survey data and census data will be made.
Finally, given the importance of land for the world poorest, we stress the need for gov-ernments and international organizations to invest more in collecting more detailed and systematic information on agricultural land in household surveys, especially in countries where data are currently not available.
References
Barrett, Christopher B (1996). “On price risk and the inverse farm size-productivity rela-tionship”. In: Journal of Development Economics 51.2, pp. 193–215.
Benjamin, Dwayne (1995). “Can unobserved land quality explain the inverse productivity relationship?” In: Journal of Development Economics 46.1, pp. 51–84.
Binswanger, Hans P and Klaus Deininger (1999). Explaining agricultural and agrarian poli-cies in developing countries. The World Bank.
Blanchet, Thomas, Juliette Fournier, and Thomas Piketty (2017). “Generalized Pareto curves: theory and applications”. In:
Bourguignon, Fran¸cois (2017). The globalization of inequality. Princeton University Press.
Deininger, Klaus and Lyn Squire (1998). “New ways of looking at old issues: inequality and growth”. In: Journal of development economics 57.2, pp. 259–287.
Do, Quy-Toan and Lakshmi Iyer (2003). “Land Rights and Economic Development: Evidence from Vietnam”. In: World Bank, Policy Research Working Papers.
Doss, Cheryl et al. (2015). “Gender inequalities in ownership and control of land in Africa: myth and reality”. In: Agricultural Economics 46.3, pp. 403–434.
Easterly, William (2007). “Inequality does cause underdevelopment: Insights from a new instrument”. In: Journal of development economics 84.2, pp. 755–776.
Engerman, Stanley and Kenneth Sokoloff (1997). Factor Endowments, Institutions and Dif-ferential Paths of Growth among the New World Economies,” in Stephen Haber, ed., How Latin America Fell Behind, Stanford: Stanford University Press.
Erickson, Lennart and Dietrich Vollrath (2004). Dimensions of land inequality and economic development. 4-158. International Monetary Fund.
FAO (1999). Agricultural Censuses and Gender Considerations - Concept and Methodology. Rome, Italy: Food and Agriculture Organization of the United Nations.
FAO (2016). The State of Food and Agriculture: Climate Change, Agriculture and Food Se-curity. Rome, Italy: Food and Agriculture Organization of the United Nations.
— (2018). “World programme for the census of agriculture 2020”. In: FAO statistical devel-opment series 2.16.
Frankema, Ewout (2010). “The colonial roots of land inequality: geography, factor endow-ments, or institutions?” In: The Economic History Review 63.2, pp. 418–451.
Galor, Oded, Omer Moav, and Dietrich Vollrath (2009). “Inequality in landownership, the emergence of human-capital promoting institutions, and the great divergence”. In: The Review of economic studies 76.1, pp. 143–179.
Graeub, Benjamin E et al. (2016). “The state of family farms in the world”. In: World development 87, pp. 1–15.
Guere˜na, Arantxa and Marc Wegerif (2019). “Land Inequality Framing Document”. In: In-ternational Land Coalition.
Lakner, Christoph and Branko Milanovic (2015). Global income distribution: from the fall of the Berlin Wall to the Great Recession. The World Bank Economic Review.
Li, Shi and Renwei Zhao (2007). “Changes in the Distribution of Wealth in China, 1995-2002”. In: WIDER Research Paper 2007/03.
Lowder, Sarah K, Jakob Skoet, and Terri Raney (2016). “The number, size, and distribution of farms, smallholder farms, and family farms worldwide”. In: World Development 87, pp. 16–29.
Martinelli, Pablo (2016). “Land Inequality in Italy in 1940: The New Picture”. In: Rivista di storia economica 32.3, pp. 303–350.
McKinley, Terry and Keith Griffin (1993). “The distribution of land in rural China”. In: The Journal of Peasant Studies 21.1, pp. 71–84.
Piketty, Thomas, Li Yang, and Gabriel Zucman (2019). “Capital accumulation, private prop-erty, and rising inequality in China, 1978–2015”. In: American Economic Review 109.7, pp. 2469–96.
Restuccia, Diego and Raul Santaeulalia-Llopis (2017). Land misallocation and productivity. Tech. rep. National Bureau of Economic Research.
Rodrik, Dani (2016). “Premature deindustrialization”. In: Journal of economic growth 21.1, pp. 1–33.
Sokoloff, Kenneth L and Stanley L Engerman (2000). “Institutions, factor endowments, and paths of development in the new world”. In: Journal of Economic perspectives 14.3, pp. 217–232.
Taylor, Charles Lewis and David A Jodice (1983). World handbook of political and social indicators. Yale University Press,
Vollrath, Dietrich (2007). “Land distribution and international agricultural productivity”. In: American Journal of Agricultural Economics 89.1, pp. 202–216.
Appendix A.
Sources of Data
Appendix B.
Results
Note: Distribution of agricultural land value, including the landless population
Appendix C.
DHS and LSMS comparison
Fig. 6. Figure B1: Gini indices among owners based on DHS and LSMS
As part of the effort by the World Bank, the Living Standards Measurement Surveys (LSMS) has been implemented in a number of countries, aiming at providing nationally-representative household surveys and in some countries, with a panel component. The cov-erage of the LSMS is particularly wide in Africa compared to other world regions, providing detailed information on agricultural activities and land. Since the focus of these surveys often aim at capturing agricultural activities, they cover both land operated or owned by households. In surveys in which the distinction between the two are not straightforward, a proxy for ownership is defined as individuals who have inherited or purchased land. As a robustness check, the Demographic Health Surveys (DHS) are used. These are nationally-representative household surveys that focus on health and nutrition aspects but also have basic information on land ownership since the 2000s, reporting whether a given household owns or not land, and the area of the land owned. Gini coefficients estimated from the LSMS and DHS being very similar, validating the ownership proxy of the LSMS (Figure B1).