HAL Id: hal-00773442
https://hal.archives-ouvertes.fr/hal-00773442
Submitted on 14 Jan 2013
HAL is a multi-disciplinary open access
archive for the deposit and dissemination of
sci-entific research documents, whether they are
pub-lished or not. The documents may come from
teaching and research institutions in France or
abroad, or from public or private research centers.
L’archive ouverte pluridisciplinaire HAL, est
destinée au dépôt et à la diffusion de documents
scientifiques de niveau recherche, publiés ou non,
émanant des établissements d’enseignement et de
recherche français ou étrangers, des laboratoires
publics ou privés.
Atomistic models of pyrolytic carbons obtained with the
IGAR method
Baptiste Farbos, Jean-Marc Leyssale, Jean-Pierre da Costa, Patrick
Weisbecker, Gerard L. Vignoles
To cite this version:
Baptiste Farbos, Jean-Marc Leyssale, Jean-Pierre da Costa, Patrick Weisbecker, Gerard L. Vignoles.
Atomistic models of pyrolytic carbons obtained with the IGAR method. Proceedings of Carbon 2012
conference, Jun 2012, Cracow, Poland. pp.ref. 382. �hal-00773442�
Atomistic models of pyrolytic carbons obtained with the IGAR method
B. Farbos1,2,3, J.-M. Leyssale1, J.-P. Da Costa2, P. Weisbeck er1, G. L. Vignoles3
1 : CNRS, Laboratoire des Composites Thermostructuraux, UMR 5801
CNRS-SNECMA-CEA-UB1, 3 allée de la Boétie, 33600 Pessac, France
2 : Laboratoire d’Intégration du Matériau au Système, UMR 5218 CNRS, 351 Cours de la
Libération, 33405 Talence, France 3 : Univ. Bordeaux, Laboratoire des Composites
ThermoStructuraux, UMR 5801CNRS -Snec ma Propulsion Solide-CEA-Université Bordeaux 1,
33600 Pessac, France
Introduction
Pyrolytic carbons (pyCs) matrices are, with carbon fibers, one of the two components in high performances carbon/carbon thermostructural composites. PyCs are turbostratic carbon materials made of a stacking of faulted graphene layers. In a recent publication [2], Leyssale et al. have studied the atomic structure of a Rough Laminar (RL) pyCs using the Image Guided Atomistic Reconstruction (IGAR) method and showed that in addition to a high percentage of nanosized disoriented graphene domain, defined by threefold atoms belonging only to hexagonal rings (called pure C6 atoms), defects are mainly made of
intrasheet grain boundaries made of lines or networks of pentagon/heptagon pairs and of screw dislocations connecting different sheets of a stack to each other through in a kind of “car park access ramp” arrangement. A comparison of AP and HT (inducing a partial graphitization) models shows that HT model have smoother fringes (related to a higher sp2 fraction), larger monolayer aromatic domains, larger C5/C7 networks and fewer
dislocations. These results are sum up in the table 1. Table 1. Structural properties (in percentage) of PyC models constructed from a 16 fringes AP PyC image and a 17 fringes HT PyC image.
PyC sp sp2 sp3 C5 C6 C7 C8 pC6
AP 0.5 97.3 2.2 5.4 88.6 5.7 0.3 75.3 HT 0.2 99.0 0.8 5.4 88.9 5.5 0.2 76.4
Finally, this study showed an excellent agreement between experiments and simulations looking at High Resolution Transmission Electron Microscopy (HRTEM) images and Pair Distribution Functions (PDF).
Very recently, Weisbecker et al. [11] have characterized two kinds of pyCs. A rough Laminar (RL) pyC, that are pyCs with a high anisotropy (RA
= 8.2±0.5) and with few defects (FWHMD = 83±2
cm-1), and a regenerated Laminar (ReL) pyC, that are pyCs with similar anisotropy (RA = 7.0±1.0) as
RL but with more defects (FWHMD = 204±20 cm -1). Obviously, the differences in texture and
structure influence their properties [1].
This study aims at obtaining atomistic representations of these RL and ReL pyCs and at describing their nano-texture/structure. We will first describe some improvements in the IGAR method. Then, the nature of defects in these materials, in terms of non-hexagonal rings and screw dislocations, as well as their hydrogen atoms contents and locations, will be thoroughly compared and discussed. These models will also be validated against experimental HRTEM images and pair distribution functions (PDF) (and structure factors) obtained from neutron diffraction.
Methods
As explained by Leyssale et al. [2, 3], atomistic models of laminar pyCs are constructed using the combination of 2D HRTEM lattice fringe image analysis, 3D image synthesis and atomistic simulated annealing.
Using a parametric approach [8], a synthetic HRTEM-like 3D image is obtained from an anisotropic and statistically identical HRTEM 2D experimental image.
The IGAR method consists in a quench molecular dynamics simulation during which atoms are guided by two potentials. One is the second generation reactive empirical bond order potential UREBO based on short range interatomic interactions
describing C-C bonds. The other is an external potential UHRTEM based on the synthetic
HRTEM-like 3D image leading the atoms toward the fringes of the image. After this quench, the system is heated to 300K, and a simulation controlled by an UAIREBO potential, derived from UREBO potential
including an adaptive treatment of van der Waals interactions between non-bonded atoms , is carried out, without the constraint of the image, to allow the relaxation of the structure between the graphene sheets.
To obtain both structurally more converged and larger models in a reasonable calculation time, our IGAR computer code was first improved using the Cell linked-lists method (consisting in dividing the simulation box in many cells, so neighbors of a given atom are only calculated in its cell and its neighboring cell rather than in the entire box, during the update of the Verlet lists) [7] and the parallel programming on shared memory systems (via openMP). The atomistic construction in this method is costly probably because of the very long liquid quench simulations permitting the reorganization of the atoms. So, the ramp of the quench rates was also improved by minimizing the UREBO potential during the quench.
Thanks to our improvements, the calculation time was be divided by about 20 and it now increases almost linearly with the number of atoms.
Preliminaries studies were carried out on RL pyCs as prepared (AP) and after a heat treatment (HT) previously studied in [2]. As seen in fig. 1, the ramp was improved in determining temperature where the potential decreases drastically in varying the quench rate.
Fig. 1 Courbes de recuit simules (potentiel total en fonction de la temperature) for several ramps. Simulation times are also noticed (en bas a gauche).
The structral analysis corresponding to these ramps is reported on table 2.
Table 2. Analyse structurale trempe AP et HT
Structural analysis of these new models shows that the structural convergence is reached for the carbons having 2, 3 and 4 neighbors (named respectively « Csp, Csp2 and Csp3 ») and that, for example for the pyC AP using our best ramp, the Csp2 (97.6%) are much more than Csp3 (2.0%) and Csp (0.4%). However, the percentages of atoms belonging to rings having 5, 6, 7 and 8 carbons among the Csp2 (named respectively « C5,
C6, C7, C8 ») haven’t converged except C8 (0.1%),
even if the percentage of C6 (95.3%) is close to the
theoretical maximum. As already noticed in a previous study [2], the percentages of C5 (2.2%)
and C7 (2.5%) are similar for every ramp,
permitting to suppose the presence of pairs of defects. The percentages of pure C6 atoms (87.7%)
and pure C6 rings (85.2%) are also not converged
but high. For the pyCs HT, the percentage of Csp2 is higher (99.0%) than the corresponding AP (so it seems Csp2 is related to the flatness of the sheets), and there is the same quantity of C6, but more pure
C6 atoms and pure C6 rings. 3D models permit to
visualize the distribution of the defects (i.e. the non pure C6 atoms) and of the graphene domains (i.e.
the pure C6 atoms). Most C5 and C7 are not found as
isolated defects but usually merge as C5/C7 pairs, as
well as lines or networks of C5/C7 pairs, defining
some kind of intrasheet grain boundaries between nanosized disoriented aromatic domains. Then the Csp3 defects make links between the fringes and the Csp defects locate at the edge of the domains. We can also see that different sheets of a stack are connected to each other through many screw dislocations in a kind of “car park access ramp” arrangement as already remarked [2]. A comparison of the AP and HT models shows that HT models have smoother fringes, larger monolayer aromatic domains, larger C5/C7 networks and fewer
dislocations. A quantitative analysis of the distribution of the fragments size shows some small fragments and principally one big fragment for AP whereas HT has intermediate fragments sizes for HT, proving that the density of screw dislocation is higher for AP compare to HT. Then a quantitative analysis of the average number of atoms by ring in the fragments shows that this number is higher for AP proving that the fragments shape is more threadlike for AP compare to HT. A visual analysis of the distribution of the C-C bonds lengths shows that the faulted areas (except the Csp) are also the most curved (because they correspond to the longer C-C bonds lengths). So defects create local disturbances in the fringes. But there is also curved areas without any defect, before et after relaxation of the structure. However, after relaxation of the structure (using either an AIREBO or a REBO potential) the curvatures corresponding to the defects stay but the others seem to be better distributed i.e. there is smaller curvatures in more areas rather than few big curvatures . So, the distribution of the bond lengths permits the identification of the areas under constraints. The identification of the peaks of the calculated PDF and distribution angles permits to confirm some differences between the AP and HT pyCs. Indeed, it can be easily seen that HT has more C6
(sp2), the Csp3 are more in AP than HT, and the Csp are few.
Parameters (scale number, orientation number, neighboring pixels number, and iteration number) of the images HRTEM-3D synthesis algorithm have been optimized by comparing statistically (due to the 3D synthesis) resulting synthetic 3D images with the input experimental images , and both images show a good agreement.
After these preliminaries steps, we have studied the new RL pyC, named pyC1, as prepared (at aboutT=1000°C during 300h). For this, we have synthetized a 3D image of this pyC1 of 6.2 nm sides i.e. about 1.5 times La10 (3.9±0.3 nm) and Lc
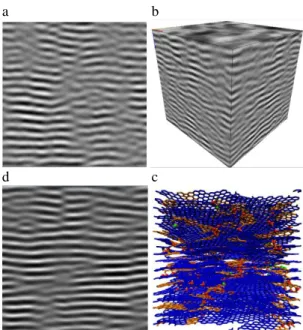
representative). The 2D filtered experimental (fig. 2 a)) and synthetic 3D images (fig. 2 b)) show a good agreement. The density d (2.12±0.01 g/cm3) measured from He pycnometry permits to specify a number of atomes in the simulation box of 25273 for a pure carbon model.
The structural analysis of the obtained model (fig. 2 c)) shows results rather similar to the previous pyC AP, in terms of sp, sp2 and sp3 fractions (table 3), but also in terms of density of dislocation and fragment shapes …
Table 3. Structurale analyse of pyC1.
The reduced experimental PDF (obtained from neutron diffraction) and calculated (from the model) until 30Å show an excellent agreement [11]. However, some differences exist. Indeed, peak locations are a little shifted (actually, scaled) to higher distances when comparing model PDF to the experimental one. This “r scaling” can be explained by the fact that the model is not at mechanical equilibrium, but contains residual stresses, concomitantly due to the imposed nanotexture (the 3D HRTEM-like image) and to the small sizes of our systems (not allowing enough freedom for relaxation). Also, the peaks intensity is higher for the model. This can be explained by the fact that the model is more organized and because of residual stresses reduce freedom of bonds vibrations. We note the absence of the peak corresponding to the first interfringe distance d002 showing the
turbostratism of the pyC.
The structure factors permit in particular to have acces to these interfringe distances (d002, …).
Experimental and calculated structure factors show a good agreement. However, we note in particular that the 10 band (whose the FWHM permit to measure La10) is more intense for the model so its
fringes are probably smoother.
The statistical comparison between the filtered experimental and the simulated HRTEM images shows a rather good agreement, except that fringes are smoother for the model (fig. 2 a) and d)).
So, in the aim to improve the model, larger models must be used and a way to quench and/or relax the structure without stretching it must be found. That’s why simulated image was also obtained after a relaxation using a REBO potential, but this image seems to give similar image that with the AIREBO potential. We note that despite of these differences, we can clearly distinguish the differences between experimental or simulated images of two differents pyCs like for example pyCR1 and pyCR2 [2].
a b
d c
Fig. 2 a) Experimental filtered HRTEM image, b)
synthetic HRTEM-like 3D image, c) atomistic model, and d) simulated image of the pyC1 (RL). According to ERDA and SIMS measurements, pyC1 contains 0.7±0.4 atomic percent of hydrogen [10]. But this is in contradiction with former results (up to 6 % at.) on similar carbons, as obtained by ERDA. Adding 5% and 0.7% atomic percent of hydrogen in the models, we notice that hydrogen in graphene position (in the plan of the layers, by opposition to the ones in graphane position) become the most numerous (that is a more realistic model) on one hand when we use an hydrogen percentage of 0.7% rather than 5% (64% vs 43% H graphene) and on the other hand, when we force hydrogen to locate in the fringes thanks to the HRTEM image potential (56% vs 43% H graphene). On the 3D models, we see that hydrogen in graphene position locate at the edges of the domains (favourable) whereas the hydrogen in graphane position locate between fringes (unfavourable).
On the same way, we have studied a ReL pyC as prepared (in the range 1000-1100°C during 10h) named pyC3 (pyC2 will be a LL pyC [10]). We have synthetized a 3D image of pyc3 of 6.2nm of sides i.e. about 2 times La10 (2.8±0.3 nm) and Lc
(2.6±0.1 nm). The 2D filtered experimental and synthetic 3D images show a good agreement. The density d (2.11±0.01 g/cm3) permits to specify a number of atomes in the simulation box of 25154 for a pure carbon model.
HRTEM images show that like pyC1, pyC3 has large anisotropic domains and undulated (FWHMD
is related to the undulations of the layers associated to the low energy defects (before 2200°C)) and highly faulted 002 fringes. The anisotropy is similar for pyC1 and pyC3 but the Fourier Transform shows that crystallinity seems to be better for pyC1.
(La10 and Lc are high energy (after 2200°C)
structural parameters obtained from neutron diffraction corresponding respectively to the coherence lengths along the graphene sheets and in the stacking direction. In particular, La10 can be
easily related to the size of the graphene domains). So pyC1 has larger domains and smoother fringes. Structural analysis, PDF, S(q), simulated image. … Comparison RL and ReL pyCs …
à completer
Table 4. Structurale analyse of pyC3.
Conclusions
The IGAR algorithm was optimized and parallelized and the ramp of the quench rates was improved. So, larger and more structural converged atomistic models of laminar (RL and ReL) pyrolytic carbons were obtained. Texture/structure of models was described by characterizing many kinds of defects and graphene domains (i.e. carbons having 2, 3 and 4 neighbors, atoms in rings of 5, 6, 7 and 8 carbons, pure C6 atoms and pure C6 rings,
size and shape of the fragments, screw dislocations, distribution of the bonds lengths, hydrogen). Some of these structural factors have converged and others seem to be close to. The most numerous of H locates favourably if its percentage is well chosen and if the HRTEM image potential is applied on hydrogen.
Models are validated both by experimental and simulated PDF, structure factors, and HRTEM images. More, the few differences permit to find futures improvements in IGAR process. In particular, larger models will be used and a way to quench and/or relax the structure without stretching the models will be found.
Large and accurate models of rough laminar and regenerated laminar pyCs were obtained, studied and compared … à compléter
Next, ReL pyC after heat treatment will studied at several temperatures (structures of RL and ReL pyCs are similar after 1500°C).
Acknowledgement. Funding from the Agence
Nationale de la Recherche through the PyroM aN project (contract ANR-2010-BLAN-929) and from the Institut Carnot M aterials and systems Institute of Bordeaux (M IB) are gratefully acknowledged.
References
[1] J.-M . Vallerot, M atrice de pyrocabone : propriétés, structure et anisotropie optique, thèse de doctorat de l'université de Bordeaux 1, n° d’ordre : 2875, 2004. [2] J.-M . Leyssale, J.-P Da Costa, C. Germain, P. Weisbecker and G. L. Vignoles, Atomistic models of pyrocarbons: reconstruction procedure and structural features, submitted for publication.
[3] J.-M . Leyssale, J.-P Da Costa, C. Germain, P. Weisbecker and G. L. Vignoles, An image guided atomistic reconstruction of pyrolitic carbons, App. Phys. Lett. 95 (231912), 2009.
[4] Franzblau DS. Computation of ring statistics for network models of solids. Phys Rev B. 1991;44(10):4925.
[5] Jain SK, Gubbins KE. Ring connectivity: measuring network connectivity in network covalent solids. Langmuir. 2007;23(3):1123–30.
[6] Kilaas R. Interactive software for simulation of high resolution TEM images. In: Geiss RH, editor. Proceedings of the 22nd Annual Conference of the M icrobeam Aanalysis Society; 1987. p. 293–300. [7] M .Allen and D.J Tildesley, Computer Simulation of Liquids, Oxford University Press, Oxford, 1987. [8] J.-P. Da Costa and C. Germain, Synthesis of solid textures based on a 2D example : application to the synthesis of 3D carbon structures observed by transmission electronic microscopy, Image Processing : M achine Vision Applications III. Edited by Fofi, David; Niel, Kurt S. Proceedings of the SPIE, 7538, 753812-753812-10, 2010.
[9] R. URS, J.-P Da Costa, J.-M . Leyssale, G. L. Vignoles, and C. Germain, Algorithmes non paramétriques pour la synthèse de textures volumiques à partir d’un exemple 2D.
[10] P. Weisbecker, J.-M . Leyssale, H.E. Fischer, V. Honkimaki, M . Lalanne, G. L. Vignoles, M icrostructure of pyrocarbons from pair distribution function analysis using neutron diffraction, 2011.