HAL Id: hal-03031465
https://hal.archives-ouvertes.fr/hal-03031465
Submitted on 30 Nov 2020HAL is a multi-disciplinary open access archive for the deposit and dissemination of sci-entific research documents, whether they are pub-lished or not. The documents may come from teaching and research institutions in France or abroad, or from public or private research centers.
L’archive ouverte pluridisciplinaire HAL, est destinée au dépôt et à la diffusion de documents scientifiques de niveau recherche, publiés ou non, émanant des établissements d’enseignement et de recherche français ou étrangers, des laboratoires publics ou privés.
The issue of scales in geohistory. Post offices from the
18th century to the present day
Nicolas Verdier, Ludovic Chalonge
To cite this version:
Nicolas Verdier, Ludovic Chalonge. The issue of scales in geohistory. Post offices from the 18th century to the present day. Cybergeo : Revue européenne de géographie / European journal of geography, UMR 8504 Géographie-cités, 2018, �10.4000/cybergeo.29197�. �hal-03031465�
The issue of scales in geohistory. Post offices from the 18th century to the present day
Nicolas Verdier
Directeur de recherché au CNRS Directeur d’Etude à l’EHESS
UMR 8504 Géographie-cité Equipe EHGO
Ludovic Chalonge
Ingénieur d’étude au CNRS UMR 8504 Géographie-cité
When analyzing an object in time and space in an attempt to establish its geohistory, a series of difficulties must be addressed. The first of these lies in the choice of a methodology and an object that remain relevant despite developments. Mutatis mutandis, this question is inherent to the historical approach, whatever the discipline that implements it. The choice of an analysis of the evolution of post office distribution in France is an example of these difficulties. It is indeed necessary to take into account the enormous evolutions of the period, which make it so that even the title itself "Post Office" such as it exists at the beginning of the XVIIIth century has practically nothing to do with its homonym of the beginning of the XXIth century; knowing that other titles were added to the first ones. One thinks here of the different names within the institution itself, which hierarchizes establishments whose names vary from office to collection or distribution. One also thinks of the different denominations that indicate the stronger or weaker relationship with the institution (office, agency, relay1). Beyond
names, the nature of mail distribution has changed, flows have intensified and are now tending to reduce. Furthermore, the different functions of the offices have multiplied. In addition to local mail collection and distribution, post offices also progressively added, the management of money orders (1817), home delivery of mail (1830), the telegraph (1879), banking - with the Caisse nationale d'épargne - (1881), telephony (1889), insurance more recently, and nowadays, personal services at
1 Currently, in France, the post office belongs to the postal institution, the postal agencies belong to the
home (Oger, 2000). Therefore, in a certain way, putting in series the establishment of post offices over three hundred years is to accept the challenge of comparing the incomparable (Detienne, 2000). The greatest risk is on the side of reduction to the common element: acting as if post offices have not fundamentally changed. One of the ways of trying to protect oneself against them requires, when analyzing the distribution of offices, great attention to changes in the postal institution, which, as we have just seen, goes far beyond the spatial aspects while also covering them. The functional enrichment of these central places participates in the organization of space. However, no matter which tactic is implemented, the risk of reduction remains high. It is counterbalanced by the gamble that this construction allows us to discover hitherto unnoticed aspects of evolution. Without lifting the suspense too much, we will see that the gamble will have proven interesting on many points.
The second difficulty lies in the availability of sources. As far as we known, nothing, guarantees that sufficient documentation exists for past periods. Nor is there any guarantee that a method of recomposing information comparable to the necessary documentation will be possible, either because the data are simply missing or because recomposing the data requires an inordinate amount of work. The case of the establishment over time of post offices in France gives a concrete example of this difficulty, while showing how complex or even counter-intuitive situations can be. Indeed, while lists of post offices have existed every year between the beginning of the 18th century and the beginning of the last third of the 19th century, data became much scarcer afterwards. In fact, from the end of the 19th century onwards, data was not only scarcer, but even less reliable. The statistical surveys conducted by the institution only very rarely give consistent figures, which is partly due to the complexity of the postal organization. It would technically be possible, in certain cases, to recompose part of this information through surveys in the telephone directories, which would require checking, for each municipality, the presence or absence of offices, assuming that, at each date, they all have a telephone, which for the first half of the twentieth century is not simple. This would mean losing part of the offices not because of their size, but because of the distance from the telephone network, of which the growth and distribution in space is complex and has not yet been studied precisely (the question seems to have been mainly raised between 1980-1990 (Bertho-Lavenir, Dupuy, etc.); in the end, there is relatively little recent work other than that relating to mobile phones). It would also be possible in some cases to try to work from the INSEE municipal inventory, but we know that for the years 1979, 1982 and 1998 these only indicate the postal presence and not the number of offices, or even agencies or postal relays in the same municipality: we therefore lose the densification of settlements in this case. Like any historical investigation, it is quite difficult to be exhaustive. It has only very recently been possible to download an exhaustive list of its locations (https://datanova.legroupe.laposte.fr/) from the Post Office website. However, in a form of programmed obsolescence, the updating of information overwrites the previous data every year. On the one hand this information is always in the present, which is of real public utility; on the other hand, this continuous presentism erases the historicity of the object (Hartog, 2003). Therefore, not collecting data at a given time is synonymous with its disappearance for the researcher. The time step used to describe changes in post office locations is therefore constrained by a source effect. In the case of the post office the fact that there are data at roughly regular intervals of thirty years over the period, allowed us to work from ten dates at least. In other words, the sources have, to a substantial extent, set the steps, and hence the time scale, of the study.
The third and final difficulty lies in the extent and structural heterogeneity of the database thus composed. While the 18th century was a relatively stable period during which the number of post offices barely exceeded 1,000, by the end of the 1950s the number had risen to more than 20,000, or
about one post office for every two communes2, despite the increase in urban settlements. For those
who wish to begin synthesizing the process at some point, this heterogeneity may complicate matters. This is even more so the case since at least two choices coexist, none of which are perfect. The first consists in building a synthesis, temporal section by temporal section. This procedure makes it possible to understand each of the distributions and each of the balances corresponding to the chosen dates as well as possible. In this posture, the whole evolution loses its readability because each moment is in essence detached from the next. The film that we could imagine reconstructing by gathering all the images would be incoherent because each image would be taken from a different point of view. The general evolution is therefore not very apprehensible. The second choice consists in proposing a synthesis at the scale of the period. This time, what appears most clearly is the overall movement that makes it possible to distinguish growth from decline or stagnation over time. On the other hand, the detail of the distributions at a given date is blurred in favor of the overall view. Thus, the fluctuations of the 18th century, including those which are proportionally large, such as the increase of almost a fifth throughout the century (from 950 to 1,200 offices) are crushed by the strong growth of the 19th and early 20th centuries. In other words, the fact of choosing between the fine description of the evolutions and the overall description has strong consequences on the observable, especially when one works an object whose densities vary widely.
The highlighting of these difficulties most often discreetly slipped under the carpet because they would be part of the work of the researcher's workshop, and as such would have little interest, nevertheless has the merit, when they are made explicit, of clearly showing that beyond the objectives of the demonstration, a series of constraints have been followed. However, these orientations can here be presented, in the form of questions of scale, whether it is a question of the reduction of information and its risks, the step of time, or even the scale of a period rather than that of the moment. To proceed in this way is, somewhat in the same way as Philippe Boudon did in 1978 in his study of the city of Richelieu, and more systematically in a series of works from the years 1990-2000 (Boudon, 1978, 1992 and 2002), to make scale one of the major prisms by which to apprehend, not only our objects, but also our practices. To take this seriously is to put oneself in the situation of having not only to take into consideration all the other possible variations of scale, but also to think about how to renegotiate the constraints coming from the sources to make them evolve towards a more accomplished reflection.
Writing a history from sowing points: the first teachings
Let us start with an analysis of the data on post offices over the period from 1700 to the present. By following the history of the establishment of post offices throughout France, step by step, a two-stage history appears.
The first time period extends from 1700 to 1830 (Map 1), i.e. for the chronological sections that form the sample, between 1706 and 1800. Indeed, what morphologically distinguishes the settlements of this period lies in the way they stick to the main communication routes that exist at that time. One only has to look at the maps showing all the locations of the post offices during this period to find, not only the star shape of the routes from Paris to the provinces, but also a series of dot alignments which in fact refer to the major communication routes of the time.
Map 1: Roadway dominance 1700-1830
To make things more precise, it is possible to make a comparison with the rapid passenger transport system which exists at the same time, and which is called “La Poste aux Chevaux” (horse-post). This system takes advantage of the best communication channels of the moment by equipping them with post relays in which it is possible to change horses very quickly so as to move around in as little time as possible (Bretagnolle, Giraud, Verdier, 2010; Verdier, 2009 ; Bretagnolle, Verdier, 2007). The comparison shows that from the beginning of the 18th century the relationship was strong (Map 2). Not all communities with offices have relays, and not all communities with relays have offices. But the important thing is that many of these communities combine both functions.
Map 2: Post Offices and Relays 1706-1708
To these rapid passenger transport routes, it is possible to add those presented in the various maps of the provinces that the geographer Guillaume Delisle produced in the early years of the 18th century (for example Delisle, 1718). These are among the few maps of the time that show the roads in a relatively accurate manner. Here again, there are no strict laws, and it is possible to find post offices outside any major route. Here as elsewhere, previously as well as nowadays, local actors sometimes manage to obtain equipment without taking into account the costs - whatever they are -. In any case, at the time of the well-established and maintained road, the relationship between the Postal Service and the different communication routes is intimate.
Two elements must then be taken into account to understand the obvious growth in the number of offices. The first phenomenon is the general improvement of the communication network during the period (Arbellot, 1973). The cumulative mileage of horse-based post routes doubled between 1708 and 1810, from 10 700 to 20 500 km, with a pre-revolutionary maximum of 23 600 km. Guy Arbellot's work has also shown how much the establishment of the Ponts et Chaussées administration, from the second third of the 18th century onwards, had made it possible to improve and extend France's road network (Bretagnolle, Giraud, Verdier, 2010). An increased amount of higher quality roads allowed the establishment of new offices.
The second phenomenon, which introduced the second period, was the profound change in the administrative network at the time of the French Revolution (Nordman, Ozouf-Marignier, Laclau, 1989). This, while becoming standardized, allowed the promotion of new administrative centers, which, at least on a cantonal scale, gradually became equipped with post offices (Ozouf-Marignier, 1989; Lepetit, 1988). In other words, the Revolution period marked the beginning of a transition towards another model of equipment for the territory that was no longer simply based on the road network, but also increasingly began to take into account the fine administrative framework. From a
logic of lower investment that aimed to flow into the country's major communication routes, we move on to the beginning of territorial equipment in an embryonic thought that would assign each canton3
capital at least one post office. To do this, a pedestrian service is set up. In 1800, 38% of these capitals were equipped, but the process was long, and it was not until the 1970s that 99% of these capitals obtained an office.
The second moment in the history of postal settlement started taking root more clearly in 1830 (Law of June 3rd 1829 applicable to April 1 1830) (Map 3), i.e. when the delivery of mail at home was decided. Before, you had to go to his office to find out if there was a letter waiting for you. From April 1, 1830, a postman went around every two days to deliver mail to the recipients' homes. It is therefore the principle of service to the public that started being put in place here, according to two successive methods.
Between 1830 and 1958 (chronological sections 1837, 1868, 1901 and 1933), there was an attempt to cover the entire territory, with the finest grain being the commune. According to postal statistics, between 1830 and 1958, the number of offices increased from 1975 to 20,297, a tenfold increase, while at the same time the population increased from 32 to 50 million, and the territory was increased by Savoy and the County of Nice (between 1871 and 1918 the territories of Alsace-Lorraine were annexed by the German Empire). Two real growth rates, but which, by themselves, are far from justifying such an explosion in the number of offices. From 2,100 communes equipped in 1837 (for 2,155 settlements) to 17,490 in 1968 (for 19,140 settlements).
Map 3: Towards a homogenization of the French space 1830-1958
3 During most of the period, France had between 3000 and 3800 cantons. These cantons form the mesh that
As early as the 1900s, some areas had one office per commune. This is the case of the Mediterranean coastline, and almost that of the Atlantic. This apparent density is partly explained by variations in the municipal grid: where communes are vast it is more common to have exhaustive coverage (Delamare, 1989). Beyond that, however, there are zonal distributions since in 1968, the southwest third of France seems to be the most densely equipped. Above all, it is the distribution of offices in the smallest municipalities that should be highlighted. Between 1933 and 1968, the number of municipalities with fewer than 500 inhabitants hosting a post office rose from 3,800 to 6,100, while the number of municipalities with fewer than 100 inhabitants equipped with an office rose from 50 to 310. The last element of measurement: from 1913, the cumulative surface area of municipalities equipped with an office exceeds 50% of the metropolitan territory. This rate reached 65% in 1968.
Map 4: Urbanization and location of offices 1968-2010
The second modality always refers to a public service logic, but rather than relying on territorial equity, it recomposes it on the basis of population quantities. The traces of this can be found as early as the end of the 19th century in the multiplication of offices in cities, which only keeps increasing. After 1960 (Map 4), in addition to this first movement at the top of the urban hierarchy, there was a second movement in the form of a reduction in the number of offices. The number of postal establishments fell from 20297 in 1958 to 17887 offices in 1971 and then to 16967 "contact points" - since this was the title that was put in place during the 1980s - in 1990. This second modality corresponds to the much larger urbanization movement (the urban population exceeds 50% in 1931 and reaches 70% in 1968) (Figure 1). Thus, in the third quarter of the 20th century, a strong contradiction was reached between equipment covering two thirds of the surface area of a vast country, while the population was increasingly concentrated in cities.
Figure 1: Urban population and post offices 1936-2010
If the postal administration has always tried to be as profitable as possible, which is well shown by the major survey of 1847 (Dauphin, Lebrun-Pezerat, Poublan, Demonet, 1991), there was nevertheless for a long time a constraint on territorial equipment from which it only officially began to separate in 1923 (in fact this separation began with the great depression at the end of the 19th century which marked a strong desire to resume control of the increase in the number of offices) (Musso, 1994). Indeed, since 1792, the jurisdiction of post offices had depended on the decisions of municipalities. The idea was to use local knowledge to determine the easiest relationships between places. It was therefore only with the agreement of the municipalities that the postal districts were shaped. If there was disagreement, it was systematically the interest of the communes that had to prevail before the prefect4 as a local
judge. From the 1923 law onwards, the question of profitability was to be raised, which was to be amplified in 1971 by the reclassification of postal buildings within the nomenclature of the sixth plan. This reclassification resulted in the decision being transferred to La Poste's Paris headquarters and no longer to the prefecture. Despite this, in 1984 Augustin Villette - Inspector General of the Post Office - evoked in a report the tensions between the post office management and the elected representatives, who during all election campaigns obtained, sometimes the reopening, and often the maintenance of post offices in the communes of their constituency. The opposition between a logic of profitability of service to the greatest number and the question of isolation of populations is such that the change of model is hard to digest for many. Nevertheless, the concentration of offices in urban municipalities still takes place. By 1979 the number of municipalities with fewer than 500 inhabitants equipped with a contact point had fallen to 4100, then to 2500 in 2010. However, from 1990 onwards, the reform of the PTTs, which divided the postal administration into two public companies (La Poste and France Telecom), required by contract the maintenance of 17 000 contact points on the territory, whether these were managed directly by the Post Office (around 8 700 nowadays), or whether they were part of other models such as postal agencies (around 6 100 nowadays) and commercial postal relays (around 2 500 nowadays).
4 In the hierarchy of administrative meshes, the departments (about 90) contain the cantons, which contain the
communes. The chief town of the department, also called prefecture, welcomes a prefect who is the representative of the government of the country.
Reduce the information to summarize the evolution: the proposal of a grid
It is therefore possible, starting from the history of the Post Office as we know it, and from the sowing of points as it can be restored, to construct a story on the evolution of the postal service. We are thus moving from a roadway logic to an exhaustive territorial coverage logic based on the communal network - in connection with home delivery and then with the multiplication of postal functions – and finally, to a public service logic based on population densities, while accumulating more and more functions concentrated in the most important offices.
If the essence of the spatial history that has just been presented seems coherent, we will notice that it has made the map more of an illustration than an element of the demonstration. Map reading, especially since the number of offices has increased significantly, remains difficult. For those who wish to better understand developments, a beginning of simplification of information by reduction is necessary. One of the most common methods from this point of view is to go through administrative districts that make it possible to break down the territory into smaller parcels, and therefore to compare them with each other. The difficulty in our case lies in the fact that the administrative divisions, often described as relatively stable and homogeneous in France, have in fact been under constant modification since the Revolution and are not that homogeneous (Ozouf-Marignier, Verdier, 2009 and 2013). Most importantly, the fact of working over a period which also covered the Ancien Régime raises the question of the sense in attributing them to divisions which did not exist at the time. The risk here is uncontrolled anachronism (Lepetit, 1992). Moreover, the characteristic of the constituencies of the Ancien Régime is their heterogeneity, as well as the complexity linked to the multiple enclaves; moreover, they are defects denounced by the revolutionaries themselves to justify the new division. It is therefore difficult to rely on these old constituencies, which are still relatively unfamiliar, despite some fine work done recently on the end of the 18th century.
The solution finally implemented was based on the one previously adopted during work carried out with Anne Bretagnolle on horse post (Bretagnolle, Verdier, 2007). It was a question of placing a grid on a background map of current metropolitan France, taking into account the territorial movements within these limits, but without exceeding them. In other words, nothing more than the Napoleonic conquests and French colonial expansion - and what remains of it today - have been taken into account here. As for the dimensions of these squares, they were dictated by two choices. The first aimed to build on relatively common reference spaces, so that these surfaces could be easily recognized by readers. The approximate size of the department was therefore chosen. This first choice did not entirely resolve the question of anachronism since it accepted to act as if our reference spaces were the same as those of the natives of the past, however, their appearance at the end of the 18th century relativized this criticism. The second was to prevent large cities from straddling two squares. This led us to drag the grid onto the map and modify it at the margin to meet the two constraints. An approximation of this model was selected, with 76 km squares (map 5).
A more synthetic description is thus possible. First, it shows the densification mentioned above. Even if the heart of the Massif Central was slow to be equipped, by the middle of the 19th century no square under French sovereignty had no offices. This synthesis also gives access to structures of the territory hitherto little seen. At the beginning of the 18th century the densest areas were in the north-western part, then tended to spread south-westwards, while the Rhône axis began to structure the territory during the last third of the 18th century. With the 19th century, the densest area is north of a Saint-Malo Marseille axis, with an extension to the southwest. Basically, the most marked upheaval occurred after 1830 when the country was relatively homogeneously equipped, even if Paris stood out. The adaptation of the institution to home delivery explains this movement. The densification that followed, starting in the last third of the 19th century, resembled in many respects that which existed in the first third of the 19th century, even if a rebalancing of densities took place towards the south. It was mainly in the second half of the 20th century that the structure that we still know today was put in place, that of the large urbanized valleys, which contrasted with the areas of relative emptiness of the most marked reliefs, as well as with a vast crescent to the south-southeast of Paris which appeared durably under-equipped. Adaptation to urbanization may appear a little earlier here than what has been perceived so far.
We could refine the description, using zoom ins, by creating the history of each square, for example, to see how they evolve over time. However, this would not significantly affect the broad lines of the description. It seems more effective here to insist on the heuristic aspect of the change of scale which is such that, once these results are obtained, it first encourages a series of back and forth between the point maps and the grid maps to understand how one explains the other. This is what has been mentioned regarding the somewhat delayed adaptation to urbanization... This then and above all encourages us to vary the scales again in order to regain this level of knowledge production. With this objective in mind, we have taken the rules of surface and location of the grid, such as we had enacted them, to repeat the experiment. This time two scales were chosen, that of the “arrondissement”5 (40
km square width) (map 6) and that of the canton before the reform of 2014 (12 km square width) (map 7) which are the following levels of the hierarchy of the arrondissements in France, even if the districts today only retain few functions (Verdier, 2013).
5 The “arrondissements” are intermediate districts between the cantons and the departments. Before 1926
Beyond the obvious, two aspects deserve to be mentioned. The first concerns the relationship to synthesis, which may or may not enable variations in scale. On the one hand, the larger the mesh size, the less diversity it reduces, and thus the easier it is to read: the printing of large homogeneous areas decreases when the grid size is reduced. It should be noted, however, that while this aspect is theoretically always true, it appears that some moments remain particularly legible whatever the scale adopted. This is thus true of the 1864 cut which shows a moment of strong homogenization of the territory. To a lesser extent, the 1968 cut offers a somewhat similar reading, probably due to the saturation of space at the time. Thus, on the one hand, there would be moments for which the variation of scale would provide more information, while for other moments it would offer little gain.
The second aspect concerns the impression of homogeneous equipment of the territory. The larger the mesh, the earlier this impression may appear. Evidently, this seems quite logical. It should be noted, however, that there seem to be levels from this point of view, because if we observe the empty squares, they disappear at the same time at the departmental and district levels, whereas they continue to exist at the cantonal level throughout the period.
Map 7: Evolution of post office densities in France between 1707 and 2010 (cantonal scale)
These two aspects give rise to a number of questions. Of these, we will highlight two. The first relates to what, since Stan Openshaw's work, has become known as the MAUP (Modifiable Areal Unit Problem) (Openshaw, 1977, 1981 and 1984). We are talking here about the artefactual aspect of the results of a change of scale. Is it possible that, if we had chosen other scales, the variations observed here would have been called into question? In this case, how can we determine this disturbance and, if not eliminate it, control it and take advantage of it in the description of the processes that concern us? Starting from the idea that there would be moments for which scale does not matter, the question would then be whether the choice of spatial scale for the analysis of a process should vary or not over time. It might be possible in this framework to find other scales for which, at some date, we would see a form of scale invariance of a phenomenon. We would then have to examine whether the results of a series of successive scales would be of the same morphology, while others would differ. All of this therefore encourages us to vary the scales in our search either for similarities or for differences useful to the knowledge of the process, and thus to take into account not only space but also time in these questions of scale, and to go further, to question what the spatial and temporal scales most useful to the understanding of a process might be.
Ignorance is the mother of all MAUPs6
It is by starting from the previous questionings that the investigation was relaunched by placing the questioning not only on space but also on time. Concerning space, rather than establishing certain levels as more relevant than others, it was a question of starting from the principle that it was necessary to make the scale vary in a regular and constant way so as to try, a little like a zoom which
6 Ignorance is the mother of all vices is a saying used by François Rabelais (1483-1553) to evoke the necessary
would always be clear, to perceive the modifications produced by the change of scale. As for time, here again rather than choosing, as had been done until now at the rate of a date every thirty years, it was a question of taking all the dates entered, that is 41 during the period which extends from 1707 to 2016, to try to observe if groupings operate differently according to the chosen scales of space.
Sidebar 1: Exploitation of massive data, the French postal network since 1700
Starting from a grid covering the entire metropolitan territory, the choice was to start with 2 km squares, then increase them 2 km by 2 km until they reached 70 km width, or 35 successive scales to
apprehend the same phenomenon. This potentially represents 35 times 41 pieces of information or 1,435 performances in total (Sidebar 1). One way of showing this set of variations between scales for different dates is to look at the evolution, according to scale, of the proportion of the number of squares with at least one post office. The graph is composed of annual curves - one curve per time section (Figure 2). As the size of the square increases, so does the proportion of squares equipped, until it reaches 100% of the territory. (In our case, as the French territory goes through the various changes mentioned above, it often happens that we do not reach 100% of the current territory of the country).
Figure 2: Proportion of squares equipped per year (1707-2015)
The history of letter post can be read in part in the gradual shift of the curve from southeast to northwest of the graph. At the beginning of the period, the very heterogeneous distribution of offices, due to their alignment on communication routes, makes it possible to maintain large areas, and therefore potentially vast squares unequipped: there are a few rare empty 40km squares. From 1830 onwards, the homogenization of the territory's coverage greatly reduced the possibility of finding large empty squares: the curves moved towards the west. As early as 1901, there were practically no empty squares larger than 14 km. The curve at the extreme northwest of the graph is the one representing 1968, i.e. the time of the maximum coverage of the territory: the squares of more than 12 km of side are all equipped with an office, or almost there. Beyond this history remain curious elements, such as the fact that these curves are not smooth, and that on the contrary they experience jerks in their trajectory. Sometimes these jerks are limited to a given curve and grid level. At other times one observes valid jerks in many curves, such as around the 34 km grid, or even that of 52 or 58 km of side.
Map 8: Variations of scale around the same information: the distribution of post offices in 1901
Another way of showing these variations is to observe the different maps for the same year (Map 8). The most interesting thing here is certainly these patterns which appear or disappear in turn in the maps of the same date at the same time as the change of scale. Take for example the case of the year 1901, by only showing variations of 6 km by 6km in order not to multiply the images. There is a vast, better equipped area that would connect Nantes to Angers, then to Périgueux and Carcassonne, which appears from 14 km squares, or rather 20 km, to maintain itself up to 38 km squares, before reappearing around 50 km, then disappearing immediately, before reappearing one last time with the 68 km squares. It is therefore a relatively robust territorial structure, since one would tend to say that it remains fairly present despite the change in scale. However, studying it with 44, 56 and 62 km squares would make it disappear at the same time as this kind of link between the Atlantic and the Mediterranean. Similarly, the fact that with a step of 6 km things seem to follow each other is in fact only weakly indicative. Thus, maps with squares of 34 and 36 km show a strong break between Périgueux and Carcassonne that we will find with squares of 40 km side. There would therefore exist, beyond the apparent structures, a form of scalar instability. Rather than drawing a nihilistic conclusion that all scales of apprehension are false, or a less negative reading stating that all scales are good but that the results observed on one scale are not opposable to those observed on another (Revel, 1996; Les Annales, 1989), it seems more interesting here to try to find the origin of this instability, by looking at the artefactual aspects described in the reflections on the MAUP (Dusek, 2004).
Sidebar 2: Scales and grid gauges
Whether the observations concern the observation of curves or the observation of maps, it seems to follow the work on the MAUP that there are actually two major disturbance factors (sidebar 2). The first is that the variation in the size of the plots reveals a new element at a given moment when it was at its border at the previous level; there is therefore a rocking aspect during the change of scale that accentuates the differences that a smoothing could make less pronounced. The second aspect is related to the grid and corresponds to what one could call the grid setting, i.e. the fact that the grid,
when the scale is changed, shifts in one direction or another, and absorbs differently points which, with another setting, could have been in other squares. In our case the starting point of the grid is located in Ouessant, the extreme west of metropolitan France.
Figure 3: Extract of the graph showing the proportion of squares equipped: jolt of grid 58
In order to reduce these variations, and thus increase the robustness of the series, there is a method which makes it possible to attenuate the threshold effect and which consists in making the grid slide a few kilometers (2 km) in several directions, then to average the result. If this procedure does not completely eliminate the jerks in the curves, it reduces them and makes it possible to distinguish the few zones of indecision, i.e. those for which there is no explanation as in the case of grids 36, 58 and 66. These strong variations can be explained by at least two hypotheses. In the first, there would be a structure specific to the object under study, which would mean that the 36, 58 and 66 km grids would be structuring levels for the Postal Service. This result is not impossible, but in view of the postal
structure which is largely based on the administrative meshes which existed in the 19th and 20th centuries, it remains very unlikely. Moreover, this would imply the relative stability over time of a spatial scale of relevance, whereas the acceleration of means of transport as well as the homogenization of space by communication routes suggests an evolution rather than a stability. The second hypothesis would be that there would be maximum moments of artefactual incoherence resulting from the relationship between a seedling and a particular territory. What supports this second hypothesis is the fine observation of the largest jolt of the curves, i.e. what takes place at the level of the passage of the grids 56, 58, 60 (figure 3). In the 58-kilometre squares, the proportion of squares equipped is more strongly increasing than before.
Two aspects of this graph should interest us here. The first is the historical aspect of the graph. To summarize, the more time passes, the less the break between two levels of scale is strong. The homogenization of postal presence tends to reduce the consequences of moving from one scale to another. The reduction in the difference between grids 56 and 58 on the one hand, and grids 58 and 60 from the last third of the 19th century is a strong indication of this. It shows that the changes linked to changes in scale remain in line with the distribution of post offices in space and its evolution. The second aspect lies in the reversal of the trend between 1870 and 1918, when part of the national territory (Alsace-Lorraine) disappeared, even if it remained within the territory considered by the survey. The creation of squares equipped with an edge effect seems to play a strong role here, and to be combined with the displacement of the grid when the meshes grow. There is therefore an undeniable artifactual aspect, even if it informs us about an event that has consequences for the postal system.
From scale laws to scalar profiles
All these elements put aside, what should be done with the results observed after the sliding of the grid, and the setting aside of the most marked jolts? To better understand what happens when scale changes, and how this allows a better understanding of a spatialized process, it seems necessary to take up the reflections developed by Laurent Nottale and others about the laws of scale, and more precisely the reflections he led with Maxime Forriez and Philippe Martin, in 2010 (Forriez, Martin, Nottale, 2010; Pumain, 2010), or even Denise Pumain's comments on these works. More than the question of fractals, what is most important for us in these texts lies in the way they pose the scalar dimension at the same level as the temporal and spatial dimensions, to think what, in a comprehensive way, can be called a social fact (Lahire, 1996; Werner, Zimmermann, 2003). This requires us to seriously consider the necessary scalar description of objects and to do so to go beyond the classical contextualization scheme, which generally places social facts in only two dimensions: space and time. The difficulty here obviously lies in the multiplication of variations when we go from a pair to a trio: space, time and scale. Within this framework, space and time see their scales potentially vary, without necessarily changing together. In a complementary way, the scale can have a temporality and a spatiality. As Nottale, Forriez and Martin ask, one of the strong elements of the description lies in the relationship between scalar variations and fractality. Taking here the definition of fractality given by Denise Pumain in the Encyclopedia Hypergéo (Pumain, 2004), we will postulate that fractality is the quality of a scalar series such that the same properties appear at different scales. However, let us be clear here that this existence of similar properties in no way implies that the observed distributions are the same. As we have seen in our case, varying the scales by applying different grids leads to modifications in the apparent distributions, but does not change anything to the nature of the relationship which is set up between solid squares and empty squares.
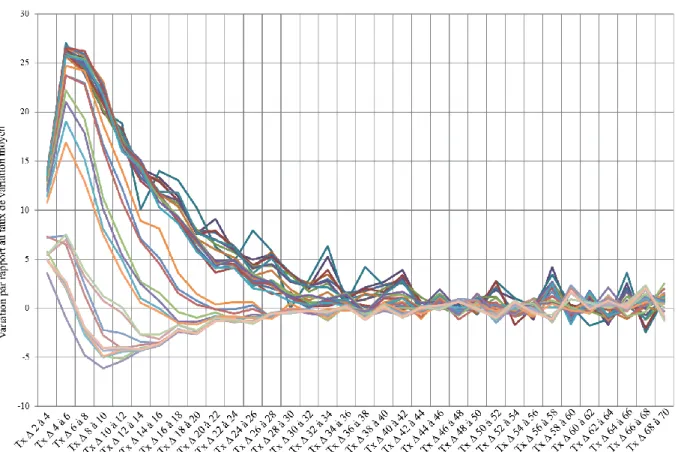
As for the proportion of squares equipped, we can see that, from a certain level, variable in time, there is a relatively fractal aspect linked to the progressive saturation of space (map 8). Nothing in itself is surprising about that. The interesting thing lies in the methodology put in place by the authors in their work on the transition between fractal and non-fractal (Nottale, 1993) on these curves. To quote them: "the fractal dimension of an object is the numerical expression of the rate of change of information when one passes from one scale to another" (Forriez, Martin, Nottale, 2010). This encourages us to proceed in the same way by proposing an analysis by rates of change in order to make the processes at work appear better (Figure 4).
Figure 4: Change rate between scalar levels of the proportion of squares equipped with post offices 1707-2015
Here we find some already known information. This time the postal story is read from top to bottom. The first years are concentrated at the top and at the bottom we find the most recent years. What is interesting here is a clearer visualization of the change in the scalar profile of the post that can be synthesized in three moments, even if the period of 1837-1873 turns out to be more a transition than a fixed state (figure 5).
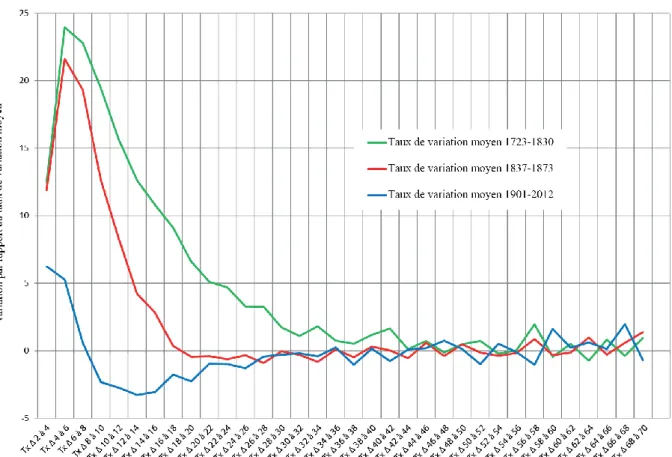
Figure 5: Three postal scalar profiles
What is happening here, is a shift from one profile to another. The first profile, which corresponds to a long 18th century spanning the Revolution, is followed by a transitional phase, which is situated for the chronological sections between 1837 and 1873, but which in fact corresponds to a period which begins with the reform of 1830 and runs until the end of the 19th century. The third profile begins with the 20th century and continues to the present day. Described in this way, the postal history is thus a bit different from the temporalities that had been depicted until now. The break of the mid-twentieth century, that is, the passage through a maximum and the dis-equipment of the 1960s and 1970s, has no clear consequences in this context. It would certainly be possible to refine the results, by no longer taking the threshold of one piece of equipment per square, one could also compare density levels with an average level. In any case, this first measure offers us, despite these limitations, interesting clues on the evolution of the structuring of space by mail.
As for their compositions, these three profiles also offer the advantage of being composite. The strong variations, which show that the change from one scale to another has strong consequences, are followed by moments of slight variations that seem to be fractal. We can therefore observe a transition from one to the other for each profile. All the while being aware that this transition follows a chronology: fractality only appears between 1723 and 1830 in squares more than 44 kilometers apart, then between 1837 and 1873 in squares more than 18 kilometers apart, to return, after 1901, to squares more than 26 kilometers apart. From then on, the non-fractal / fractal transition is more or less long dependent on the moment. This allows us to define minimum scales in which the fractal dimensions are common to the three profiles, such as for example for squares having between 44 and 52 kilometers of side. As for the non-fractal aspects, they lend themselves less easily to the choice of a common scale, all the more so as the period 1901-2012 knows strong variations. Indeed, if the choice of a scale of squares having between 4 and 8 kilometers of side seems clear enough for the first two
periods, by offering a strong variability and thus a possible richness in the commentary, the last period encourages us to also choose among the squares between 8 and 18 kilometers of side to understand all the complexity of the implementation of the postal system.
Conclusion
This set of arguments leads us to conclude with a series of points. The first makes it possible to insist on the interest of the systematic variation of scale: this one produces a strong heuristic effect. Nevertheless, it seems that some scales are more interesting than others in this procedure, and that the simple fact of varying the scale at random, or according to scales belonging to a common culture, however heuristic it may be, can be reflected in order to choose scales that are perhaps more effective than others to produce the most enriched description possible. The second point concerns the existence of scalar profiles of space objects that are evolutionary over time. At a minimum, this confirms the interest that there is in associating scale with space and time during a geohistorical survey, and beyond in all surveys on social facts. Beyond this, this idea of evolutionary scalar profiles should make it possible to work further on the evolutions, and thus to qualify evolutionary processes by their scalar profiles. The third point emphasizes the idea of variation in the relevance of scales over time. In other words, if it is possible that there are scales whose interest is constant throughout the period, it is also necessary to pay strong attention to the scalar moments and to consider every moment in which a particular scale seems potentially richer in diversity than others. This should allow us to think about space templates and their evolution. For example, in the case of letter mail, the fact that the non-fractal part of the profiles is reduced and then increased encourages a better qualification of the evolution of the postal system's spatial coverage efficiency scale.
Bibliography
Arbellot G., 1973, "La grande mutation des routes de France au XVIIIe siècle", Annales Economies,
Sociétés, Civilisations, 28e année, No.3, 765-791.
Boudon P., 1992, De l’architecture à l’épistémologie : la question de l’échelle, Paris, PUF. Boudon P., 2002, Echelles, Paris, Economica.
Boudon P., 1978, Richelieu ville nouvelle, Dunod.
Bretagnolle A. & Verdier N., 2007, "Expanding the Network of Postal Routes in France 1708-1833", in M. Leroux (ed.), Post Offices of Europe 18th-21th Century. A Comparative History, Paris, 159-176. Bretagnolle A., Giraud T., Verdier N., 2010, "Routes de poste et structuration de l’espace dans la France pré-industrielle (17e-19e siècles)", L’Espace Géographique, No.2, 116-130.
Carré P., 1991, "Un développement incertain : la diffusion du téléphone en France avant 1914",
Réseaux, Vol.9, No.49, 27-44.
Dauphin C., Lebrun-Pezerat P., Poublan D., Demonet M., 1991, "L’enquête postale de 1847", in Chartier Roger (dir.), La correspondance. Les usages de la lettre au XIXe siècle, Paris, Fayard, 1991, 21-126. Delamarre A., 1989, "La carte des 36000 communes", Mappemonde, 1989, 12-16.
Delisle G., 1718, Orléanais et pays voisins, Paris, chez l’auteur, (ark:/12148/btv1b8593256s). On verra l’ensemble de ces cartes sur le site Gallica (http://gallica.bnf.fr).
Detienne M., 2000, Comparer l’incomparable, Paris, Le Seuil.
Dusek T., 2004, "Spatially aggregated data and variables in empirical analysis and model building for economics", Cybergeo: European Journal of Geography, article No. 285, mis en ligne le 9 septembre. Forriez M., Martin P., Nottale L., 2010, "Lois d’échelle et transitions fractal-non fractal en géographie",
L’Espace Géographique, No.2, 97-112.
Hartog F., 2003, Régimes d’historicité, présentisme et expérience du temps, Paris, Eds du Seuil. Lahire B.,1996, "La variation des contextes en sciences sociales, remarques épistémologiques",
Annales Histoire Sciences Sociales, Vol.51, No.2, 381-407.
Lepetit B., 1992, "Séries longues, histoire longue", Genèses, No.9, 102-106.
Lepetit B., 1988, Les villes dans la France moderne (1740-1840), Paris, Albin Michel.
Les Annales, 1989, "Tentons l’expérience", Annales Economies, Sociétés, Civilisations, No.6, 1317-1323. Musso P., 1994, "Aux origines de l’autonomie des télécommunications françaises, la loi de 1923",
Réseaux, Vol.12, 66, 99-117.
Nordman D., Ozouf-Marignier M.-V., Laclau A., 1989, Atlas de la Révolution Française, Vol.4 et 5, Le
territoire, Paris.
Nottale L., 1993, Fractal Space-Time and Microphysics. Toward a Theory of Scale Relativity, Singapour, World Scientific.
Offner J.-M., 1993, "Le développement des réseaux techniques : un modèle générique", Flux, No.13-14, 11-18.
Oger B., 2000, "Les mutations de la poste de 1792 à 1990, entre ruptures et continuités", Flux, Vol.16, No.42, 7-21.
Openshaw S., 1981, "Le problème de l’agrégation spatiale en géographie", L’Espace Géographique, tome 10, No.1, 15-24.
Openshaw S., 1977, "A Geographical Solution to Scale and Aggregation Problems in Region-Building, Partitioning and Spatial Modelling", Transactions of the Institute of British Geographers, Vol.2, No. 4, 459-472.
Openshaw S., 1984, The modifiable areal unit problem, Norwich, Norwich University press.
Ozouf-Marignier M.-V., 1989, La formation des départements. La représentation du territoire français
à la fin du 18e siècle, Paris, Eds de l’École des Hautes Études en Sciences Sociales.
Ozouf-Marignier M.-V., Verdier, N., 2013, "Les mutations des circonscriptions territoriales françaises, Crise ou Mutation ?", Mélanges de l’École Française de Rome, No.125-2, 17 p.
Ozouf-Marignier, M.-V., Verdier, N., 2009, "Le canton d’hier à aujourd’hui, étude cartographique d’un maillage", in Lagadec, Y., Le Bihan, J et Tanguy, J.-F., Le canton, un territoire du quotidien, Rennes, Presses universitaires de Rennes, 281-295.
Pumain D., 2010, "Commentaire : transition fractal non-fractal et objets géographiques", L’Espace
Géographique, No.2, 113-115.
Pumain D., 2004, "Fractale", Hypergéo, 7 mai.
Revel J. (dir.), 1996, Jeux d’échelles. La micro-analyse à l’expérience, Paris, Gallimard/Seuil.
Verdier N., 2013, "La paradoxale circonscription intermédiaire infra-départementale : du district à l’arrondissement", Parlement, Revue d’Histoire Politique, No.20, 19-34.
Verdier N., 2009, "Dal territorio alla carta: posta a cavallo e acculturazione dei rapporti col spazio tra la fine del settecento e l’inizio dell’ottocento", Quaderni Storici, Vol.131, agosto, 579-606.
Werner M. et Zimmermann B., 2003, "Penser l’histoire croisée : entre empirie et réflexivité", Annales