HAL Id: hal-00624590
https://hal.archives-ouvertes.fr/hal-00624590v2
Submitted on 29 Sep 2011HAL is a multi-disciplinary open access archive for the deposit and dissemination of sci-entific research documents, whether they are pub-lished or not. The documents may come from teaching and research institutions in France or abroad, or from public or private research centers.
L’archive ouverte pluridisciplinaire HAL, est destinée au dépôt et à la diffusion de documents scientifiques de niveau recherche, publiés ou non, émanant des établissements d’enseignement et de recherche français ou étrangers, des laboratoires publics ou privés.
the interactive influence of activity space and
neighbourhood of residence on depression.
Julie Vallée, Emmanuelle Cadot, Christelle Roustit, Isabelle Parizot, Pierre
Chauvin
To cite this version:
Julie Vallée, Emmanuelle Cadot, Christelle Roustit, Isabelle Parizot, Pierre Chauvin. The role of daily mobility in mental health inequalities: the interactive influence of activity space and neigh-bourhood of residence on depression.: The interactive influence of activity space and neighbour-hood of residence on depression.. Social Science and Medicine, Elsevier, 2011, 73 (8), pp.1133-44. �10.1016/j.socscimed.2011.08.009�. �hal-00624590v2�
The role of daily mobility in mental health inequalities: the interactive influence of activity space and neighbourhood of residence on depression.
Julie Vallée1,2 , Emmanuelle Cadot1 , Christelle Roustit1 , Isabelle Parizot3 and Pierre Chauvin1,4
1. INSERM, U 707, Research Team on the Social Determinants of Health and Healthcare, Paris, France 2. UMR 8504 Géographie-Cités, (CNRS - University Paris 1 - University Paris 7), Paris, France
3. Centre Maurice Halbwachs, ERIS - Research Group on Social Inequalities (CNRS-EHESS-ENS), Paris, France
4. UPMC University Paris 6, UMRS 707, Paris, France
Julie Vallée : julie.vallee@parisgeo.cnrs.fr
Abstract
The literature reports an association between neighbourhood deprivation and individual depression after adjustment for individual factors. The present paper investigates whether vulnerability to neighbourhood features is influenced by individual “activity space” (i.e., the space within which people move about or travel in the course of their daily activities). It can be assumed that a deprived residential environment can exert a stronger influence on the mental health of people whose activity space is limited to their neighbourhood of residence, since their exposure to their neighbourhood would be greater. Moreover, we studied the relationship between activity space size and depression. A limited activity space could indeed reflect spatial and social confinement and thus be associated with a higher risk of being depressed, or, conversely, it could be linked to a deep attachment to the neighbourhood of residence and thus be associated with a lower risk of being depressed.
Multilevel logistic regression analyses of a representative sample consisting of 3,011 inhabitants surveyed in 2005 in the Paris metropolitan area (France) and nested within 50 census blocks showed, after adjusting for individual-level variables, that people living in deprived neighbourhoods were significantly more depressed that those living in more advantaged neighbourhoods. We also observed a statistically significant cross-level interaction (p=0.01) between activity space and neighbourhood deprivation, as they relate to depression. Living in a deprived neighbourhood had a stronger and statistically significant effect on depression in people whose activity space was limited to their neighbourhood than in those whose daily travels extended beyond it. In addition, a limited activity space appeared to be a protective factor with regard to depression for people living in advantaged neighbourhoods and a risk factor for those living in deprived neighbourhoods.
It could therefore be useful to take activity space into consideration more often when studying the social and spatial determinants of depression.
Keywords
France; Paris; activity space; daily mobility; residential and non residential neighbourhood; neighbourhood exposure; cross-level interaction; mental health; depression.
Introduction
Neighbourhoods of residence have recently emerged in social epidemiology and public health literature as a relevant dimension to be taken into account in studies of health inequalities (Diez-Roux, 2001; Kawachi & Berkman, 2003). Health geography literature has also greatly contributed to the understanding of the central concepts of „place‟ and „space‟ in health studies (Curtis, 2004; Gatrell, 2002; Jones & Moon, 1987).
With regard to mental health, studies have revealed the effect of neighbourhood structural features (such as the socioeconomic composition and the built and services environment) and neighbourhood social processes (such as disorder, social cohesion and perceived violence) on depression, even after adjustment for individual factors in multilevel models (Echeverria et al., 2008; Evans, 2003; Galea et al., 2005; Kim, 2008; Mair et al., 2008; Ostir et al., 2003; Ross, 2000). Some authors have also underscored the importance of not assuming that the effects of the residential context on health operate identically for every resident (Macintyre & Ellaway, 2003; Stafford et al. 2005). Focusing on depression, some studies have shown that the strength of the residential context effect varies according to gender (Berke et al., 2007; Fitzpatrick et al., 2005; Gutman & Sameroff, 2004), racial/ethnic group (Gary et al., 2007; Henderson et al., 2005; Ostir et al., 2003) and socioeconomic status (Weich et al., 2001; Weich et al., 2003). Daily mobility has sometimes been mentioned to explain why a stronger association between neighbourhood characteristics and mental health was observed amongst certain population subgroups. For instance, observing that women were more vulnerable to the characteristics of their neighbourhood of residence, Stafford et al. postulate that this may be due to the fact that women spend more of their time in their neighbourhood than men (2005). The authors of one of the few studies that consider the nonresidential neighbourhood environment in addition to the characteristics of the residential neighbourhood stress the need to include nonresidential neighbourhood exposure in order to accurately measure the association between the residential neighbourhood and self-rated health (Inagami et al., 2007). It could be interesting not to limit place-based health research to analyses place-based on residential location and to take into consideration the possible mediating role of attributes in extra-local places (Chaix et al., 2009; Cummins, 2007; Matthews, 2011; Rainham et al., 2010). In this paper the idea is then to examine how the spatial extent of daily mobility - within or outside the neighbourhood of residence - can modify an individual‟s vulnerability to residential neighbourhood characteristics. It is reasonable to assume that the residential environment may exert a stronger influence on the mental health of people spending most of their time in their local area than on the mental health of people whose daily travels go beyond residential neighbourhood boundaries.
Apart from the hypothesis that daily mobility could modify the strength of association of attributes of residential neighbourhood with depression, we can assume that daily mobility might be directly associated with depression. Two opposite hypotheses can be formulated a priori about the relationship between daily mobility and depression: (1) spatially limited daily mobility reflects spatial and social
confinement and can be seen as a behaviour correlated with a higher risk of being depressed or, conversely, (2) spatially limited daily mobility is linked both to a deep attachment to the neighbourhood of residence and to neighbourhood well-being and can be seen as a behaviour correlated with a lower risk of being depressed. The complexity of the relationship between the spatial extent of daily mobility and well-being was pointed out in an empirical study of 40 adults with serious mental illness neighbourhoods (Townley et al., 2009). The authors found that those whose daily activities remained close to home tended to have lower life satisfaction but a stronger sense of community in their neighbourhood. For our part, we sought to investigate, in the general population, whether spatially limited daily mobility might be associated with a higher risk of being depressed or, instead, with a lower risk of being depressed. These two seemingly incongruent hypotheses regarding the potential influence of neighbourhood characteristics on depression could both be shown to be correct, depending on the characteristics of the neighbourhood under study. Indeed, in deprived neighbourhoods, spatially limited daily mobility could be associated with a higher risk of being depressed because it could indicate strong exposure to unpleasant residential circumstances, e.g., violence, incivilities, exterior noise, and a lack of key services (Curry et al., 2008; Leslie & Cerin, 2008; Ross & Mirowsky, 2001). On the contrary, in advantaged neighbourhoods, spatially limited daily mobility could be associated with a lower risk of being depressed precisely because it could indicate a deeper attachment to pleasant circumstances. However, to the best of our knowledge, neither the association between daily mobility and depression nor the interactions between daily mobility and neighbourhood deprivation on depression have yet been investigated.
In this paper, neighbourhood deprivation was defined not only through subjective neighbourhood assessments (first individual, then aggregated to neighbourhood level) but also through census based information. As a reciprocal relationship between mental state and area perception probably exists and may lead to a reporting bias (Mair et al., 2008), it was indeed interesting to measure neighbourhood deprivation independently of the perceptions of sample respondents using census as a source of information (Fagg et al., 2008). The idea is to examine whether relationship between depression and neighbourhood deprivation (defined alternately from individual neighbourhood assessments, collective neighbourhood assessments or neighbourhood census social composition) yield concordant results. To study the role of daily mobility in depression, we propose here to use the concept of “activity space”, which can be defined as the space within which people move about or travel in the course of their daily activities. Various measures of activity space have been used in time geography to identify social differences in people‟s access to opportunities (Golledge & Stimson, 1997), in particular, to health-care facilities (Arcury et al., 2005; Nemet & Bailey, 2000; Sherman et al., 2005). Very recently, the concept of activity space also contributed to measuring community integration (Townley et al., 2009) or exposure to the food environment (Kestens et al., 2010). In this research, we use a simplified measure of activity space: the measure of the concentration of daily activities in the perceived neighbourhood. In a previous paper on cervical screening behaviour among women in the Paris
metropolitan area, we provided strong arguments in favour of the association between this measure of activity space and participation in health-care activities. We showed that women who reported concentrating their daily activities within their neighbourhood had a statistically greater likelihood of delayed cervical screening. We also pointed out that the strength of association of attributes of residential neighbourhood with participation in cervical screening was significantly higher among women whose activity space was limited to their neighbourhood of residence (Vallée et al., 2010). The present paper deals with individual and neighbourhood deprivation features associated with depression in the Paris metropolitan area in 2005, with special attention to the combined association of activity space and neighbourhood characteristics, after controlling for individual-level confounders. Our objectives were to determine (1) whether the association of residential neighbourhood deprivation with depression was greater among people who reported concentrating their daily activities within their neighbourhood of residence, and (2) whether the relationship of activity space with depression varied according to neighbourhood deprivation.
Materials and methods Study sample
The SIRS (French acronym for Health, Inequalities and Social Ruptures) survey was conducted between September and December 2005 among a representative sample of the adult French-speaking population in the Paris metropolitan area (Paris and its suburbs, a region with a population of 6.5 million). This survey constituted the first wave of a socioepidemiological population-based cohort study, which is a collaborative research project between the French National Institute for Health and Medical Research (INSERM) and the National Centre for Scientific Research (CNRS). This cohort study was approved by France‟s privacy and personal data protection authority (Commission Nationale de l‟Informatique et des Libertés [CNIL]).
In the present paper, data collected in 2005 were examined cross-sectionally. The SIRS survey employed a stratified, multistage cluster sampling procedure. The primary sampling units were census blocks called “IRISs” (“IRIS” is a French acronym for blocks for incorporating statistical information). They constitute the smallest census unit areas in France (with about 2,000 inhabitants each in the Paris metropolitan area) whose aggregate data can be used on a routine basis. In all, 50 census blocks were randomly selected (overrepresenting the poorer neighbourhoods) from the 2,595 eligible census blocks in Paris and its suburbs. Subsequently, within each selected census block, households were randomly chosen from a complete list of dwellings in order to include at least 60 households in each surveyed census block. Lastly, one adult was randomly selected from each household by the birthday method. A questionnaire containing numerous social and health-related questions was administered face-to-face during home visits. Further details on the SIRS sampling methodology were published previously (Chauvin & Parizot, 2009; Renahy et al., 2008; Roustit et al., 2009).
In 2005, 29% of the people contacted declined to answer, and 5% were excluded because they did not speak French (3%) or were too sick to answer our questions (2%) (Renahy et al., 2008). The final sample consisted of 3,023 persons with a mean of 60.5 participants per census block (range: 60 to 65). The mean age of the SIRS population was 47 years (range: 18 to 97). The mean monthly household income was 1,734 € per consumption unit (range: 50 to 10,000 € per CU). The 3,023 SIRS respondents were predominantly female (61%), French (86%), with a postsecondary education (45%) and in the workforce (55%). Table 1 presents respondents characteristics in the full sample.
Table 1. Selected characteristics of SIRS respondents in 2005
Total sample (n=3,023)
Sex (%) Female 61
Age (mean) - 47 yrs
Nationality (%) French 86
Level of education (%) Postsecondary 45
Secondary school 42
None or primary school 13
Monthly household income (mean) - 1,734 €
Current or last occupational status (%) Never worked 9
Blue collar 14
Lower white-collar 29
Tradespeople, salespeople 4 Intermediary occupation 22
Upper white-collar 22
Current employment status (%) Working 55
Studying 5 Unemployed 9 At home 9 Retired 22 Variables Depression
Depression was investigated by the Mini-International Neuropsychiatric Interview (M.I.N.I.). This is a short, structured diagnostic interview designed in such a manner as to permit administration by non-specialist interviewers. The depression index was determined by a 10-item questionnaire for measuring the occurrence of major depressive disorders during the previous two weeks. Using the validated and usual cut-off score (four positive answers out of ten questions), a binary variable indicating the absence or presence of depression was created. The internal and external validity of this binary variable had been demonstrated in the French population (Lecrubier et al., 1997; Sheehan et al., 1998).
Activity space
In this paper, activity space was assessed from the respondents‟ statements about the location of their regular domestic and social activities. In the SIRS survey, people were asked where they usually 1) go food shopping; 2) use services (bank, post office); 3) go for a walk; 4) meet friends; and 5) go to a restaurant or café. For each of these five activities, three answers were proposed: 1) mainly within their residential neighbourhood; 2) mainly outside their residential neighbourhood; and 3) both within and outside their residential neighbourhood. The neighbourhood of residence was not defined, and its boundaries were left to the individual‟s own assessment and perception - what we call here the „perceived neighbourhood‟.
A measure of activity space was then created: activities said to be performed mainly within the neighbourhood were assigned a value of 100%, while those performed „both within and outside the neighbourhood‟ or „mainly outside neighbourhood‟ were assigned a value of 50% or 0%, respectively. Upon adding these values and dividing the sum by the total number of reported activities, we obtained an individual score measuring the concentration of daily activities in the perceived neighbourhood. The respondents were then ranked on the basis of this score, which ranged from 0 (for people who reported doing every proposed activity mainly outside their neighbourhood of residence) to 1 (for people who reported doing every proposed activity mainly within their neighbourhood of residence). Participants who did not provide answers for any of the five proposed activities (n=12) were excluded from the analysis. This score was then used as a proxy of personal exposure to the neighbourhood of residence.
To analyze cross-level interaction more easily, we also decided to isolate people who reported doing the vast majority of their daily activities within their perceived neighbourhood of residence. We grouped together people with a score greater than or equal to 0.8. They were those who reported that they did either (a) every activity within their perceived neighbourhood of residence, (b) one or two activities both within and outside their perceived neighbourhood of residence, or (c) only one activity mainly outside their perceived neighbourhood of residence. Finally, 520 of the 3,011 respondents (17.5%) were then considered as having an activity space significantly limited to their perceived neighbourhood of residence, while 2,491 (82.5%) were considered as having an activity space larger than their perceived neighbourhood. In a previous published research which used data from the same survey, we showed that being a foreigner, having a low level of education, living in a low-income household, being unemployed, retired or at home, having lived in the neighbourhood for more than 20 years, being physically limited, living in a neighbourhood with a high shop density and with a high mean income increase significantly the likelihood to have an activity space limited to the neighbourhood of residence (Vallée et al., 2010).
Other variables
In addition to sex, age, nationality, level of education, occupational status and employment status, we considered whether the person was living in a couple relationship. Functional limitation was
investigated as well, by the global activity limitation indicator from the Minimum European Health Module (Cox et al., 2009). The respondents were asked whether they perceived themselves as having a severe limitation of at least six months‟ duration in performing activities people usually engage in. Neighbourhood of residence
Neighbourhood deprivation
As stated in the introduction, we considered neighbourhood deprivation in three different manners: (1) from individual assessment, (2) from collective assessment and (3) from census based measures of social composition.
(1) Individual neighbourhood assessments were obtained by asking the participants to rate ten neighbourhood characteristics using a 4-point Likert scale. The neighbourhood attributes were the quality of the public transportation, the quality of the schools, the presence of shops, cohesion between the residents, the condition of the roads and buildings, the local authorities‟ efforts involving the neighbourhood, the level of unemployment, the neighbourhood‟s remoteness, its condition compared to that of other urban neighbourhoods, and its quality as a place to raise children. The responses to these items were summed to create a total index score and divided into two roughly equal groups. In all, 1,298 of the 3,023 participants were classified as having a positive assessment of their neighbourhood of residence, 1,725 a negative assessment.
(2) We also aggregated the neighbourhood assessments by all the participants living in the same census block to create a contextual variable. Neighbourhoods in which a majority of participants had a positive individual assessment of their neighbourhood were categorized as neighbourhoods with a positive collective assessment (n=21), while those in which a majority of participants had a negative individual assessment were categorized as neighbourhoods with a negative collective assessment (n=29).
(3) Neighbourhood census social composition was based on individual socio-occupational data (occupational status and current employment status) from the 1999 census information (Préteceille, 2003). These census socio-occupational data were then aggregated by census blocks (i.e. IRIS units). The idea was here to characterize neighbourhood deprivation independently of the perceptions of our sample respondents. The 50 census blocks which were selected in our health survey were categorized, either as working-class neighbourhoods (n=20) or as upper- or middle-class neighbourhoods (n=30).
Neighbourhood location
Finally, we accounted for location in the Paris metropolitan area. The surveyed census blocks were classified either as being in central Paris (inner-city areas) or outside central Paris (suburban areas), with 13 and 37 census blocks, respectively, in each of these two groups.
Neighbourhood spatial delimitations
In this paper, we used two different spatial delimitations of neighbourhood of residence.
- One of them was based on the participants‟ self-defined areas. It is the one they referred to when they were asked about their daily activities and to give their neighbourhood assessments.
- The other was based on the census blocks (i.e. IRIS units). It was used to characterize neighbourhood social composition (as working-class neighbourhoods or as upper- or middle-class neighbourhoods) and location in the Paris metropolitan area.
Statistical methods
All the proportions presented in this article were weighted to account for the complex sample design (notably, the design effect associated with cluster sampling and the overrepresentation of poorer neighbourhoods) and for the poststratification adjustment for age and sex according to the general population 1999 census data. Significant differences in weighted proportions were measured by the Pearson chi-squared test.
Statistical associations between the individual and neighbourhood characteristics and depression were examined using multi-level logistic regression models of 3,011 individuals (i.e. respondents for whom activity space data were available) at level 1 nested within 50 surveyed census blocks (i.e. IRIS units) at level 2. In these analyses the mean number of respondents per census block was 60.2 (range: 58 to 65). Multilevel logistic regression models were fitted using the xtmelogit command in Stata10 software.
In each regression model, we introduced sex, age, nationality, level of education, occupational status, employment status, couple relationship status, functional limitation, and urban location to control for residual confounding and entered, alternately, the following measures of neighbourhood deprivation: individual neighbourhood assessment (Model 1), collective neighbourhood assessment (Model 2) and neighbourhood census social composition (Model 3). We then calculated the cross-level interaction terms between the measure of activity space and each of these three measures of neighbourhood deprivation. We examined whether the effects of activity space on depression differed across neighbourhood deprivation and, conversely, whether the effects of neighbourhood deprivation on depression differed across activity space. A p-value < 0.05 was considered significant for all the statistical analyses presented.
Results
Individual characteristics and depression
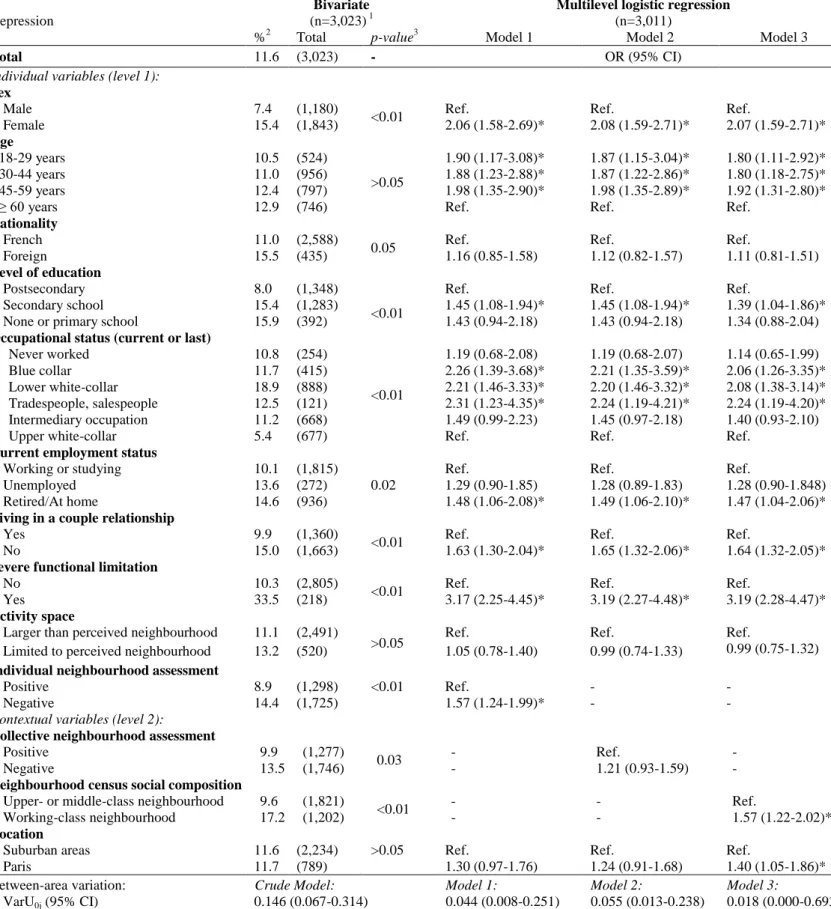
Of the overall population of 3,023 persons, 11.6% were depressed (Table 2). In bivariate analysis (Table 2), we observed that the proportion of depressed people was statistically higher for women (15.4%) than for men (7.4%; p<0.01); for foreigners (15.5%) than for people of French nationality (11%; p=0.05); for people with a low level of education (15.9%) than for those with high level of education (8.0%; p<0.01); for lower white–collar workers (18.9%) than for upper-white collar workers (5.4%; p<0.01); for people who were unemployed (13.6%), retired or at home (14.6%) than for those who were working or studying (10.1%; p=0.02); for those who were not in a couple relationship (15%) than those who were (9.9%; p<0.01); and for people with a severe functional limitation (33.5%) than for those without a severe limitation (10.3%; p<0.01). In multivariate analysis, we observed that
women, people without a postsecondary education, those with a low occupational status, blue-collar workers, lower white-collar workers, tradespeople and salespeople, those who were retired or at home, those who were not in a couple relationship and those with a severe functional limitation had a significantly higher risk of depression. In multivariate analysis, nationality became non-statistically associated with depression.
As regards the relationship between age and depression, we observed that the proportion of depressed people was slightly higher - though the difference was not statistically significant - among the respondents aged 60 years or older (12.9%) than in those under the age of 30 (10.5%). In multivariate analysis, after adjusting for certain age-related variables, such as employment status and functional limitation, the trend reversed, in that the under-60s had a significantly higher risk of being depressed than those aged 60 years or older.
Neighbourhood characteristics and depression
In bivariate analysis (Table 2), we observed that the proportion of depressed people was statistically higher:
- among those who had given (individually) a negative assessment of their neighbourhood (14.4%) compared to those who had given a positive assessment (8.9%; p <0.01);
- among those living in neighbourhoods where the collective neighbourhood assessment was mainly negative (13.5%) compared to those living in neighbourhoods where the collective neighbourhood assessment was mainly positive (9.9%; p=0.03);
- and, lastly, among those living in working-class neighbourhoods (17.2%) compared to those living in upper- or middle-class neighbourhoods (9.6%; p<0.01).
In multivariate analysis (Table 2), we found that the respondents who had given a negative assessment of their neighbourhood had a significantly higher likelihood of being depressed (OR=1.57; 95% CI=1.24-1.99. See Model 1 in Table 2). However, those living in neighbourhoods where the neighbourhood assessment was mainly negative did not have a significantly higher likelihood of being depressed (OR=1.21; 95% CI=0.93-1.59; See Model 2 in Table 2). Lastly, those living in working-class neighbourhoods had a significantly higher likelihood of being depressed (OR=1.57; 95% CI=1.22-2.02; See Model 3 in Table 2), even after adjustment for individual characteristics.
Furthermore, we did not observe a statistical association between depression and urban versus suburban location in bivariate analysis. However, in the last multilevel model (Model 3 in Table 2), we did observe that the respondents living in inner-city areas were statistically more depressed than those living in suburban areas (OR=1.40; 95% CI=1.05-1.86).
Table 2. Individual and neighbourhood risk factors for depression in the population in the Paris metropolitan area (2005)
Depression
Bivariate
(n=3,023) 1
Multilevel logistic regression
(n=3,011)
%2 Total p-value3 Model 1 Model 2 Model 3
Total 11.6 (3,023) - OR (95% CI)
Individual variables (level 1):
Sex
Male 7.4 (1,180)
<0.01 Ref. Ref. Ref.
Female 15.4 (1,843) 2.06 (1.58-2.69)* 2.08 (1.59-2.71)* 2.07 (1.59-2.71)* Age 18-29 years 10.5 (524) >0.05 1.90 (1.17-3.08)* 1.87 (1.15-3.04)* 1.80 (1.11-2.92)* 30-44 years 11.0 (956) 1.88 (1.23-2.88)* 1.87 (1.22-2.86)* 1.80 (1.18-2.75)* 45-59 years 12.4 (797) 1.98 (1.35-2.90)* 1.98 (1.35-2.89)* 1.92 (1.31-2.80)*
≥ 60 years 12.9 (746) Ref. Ref. Ref.
Nationality
French 11.0 (2,588)
0.05 Ref. Ref. Ref.
Foreign 15.5 (435) 1.16 (0.85-1.58) 1.12 (0.82-1.57) 1.11 (0.81-1.51)
Level of education
Postsecondary 8.0 (1,348)
<0.01
Ref. Ref. Ref.
Secondary school 15.4 (1,283) 1.45 (1.08-1.94)* 1.45 (1.08-1.94)* 1.39 (1.04-1.86)*
None or primary school 15.9 (392) 1.43 (0.94-2.18) 1.43 (0.94-2.18) 1.34 (0.88-2.04)
Occupational status (current or last)
Never worked 10.8 (254) <0.01 1.19 (0.68-2.08) 1.19 (0.68-2.07) 1.14 (0.65-1.99) Blue collar 11.7 (415) 2.26 (1.39-3.68)* 2.21 (1.35-3.59)* 2.06 (1.26-3.35)* Lower white-collar 18.9 (888) 2.21 (1.46-3.33)* 2.20 (1.46-3.32)* 2.08 (1.38-3.14)* Tradespeople, salespeople 12.5 (121) 2.31 (1.23-4.35)* 2.24 (1.19-4.21)* 2.24 (1.19-4.20)* Intermediary occupation 11.2 (668) 1.49 (0.99-2.23) 1.45 (0.97-2.18) 1.40 (0.93-2.10)
Upper white-collar 5.4 (677) Ref. Ref. Ref.
Current employment status
Working or studying 10.1 (1,815)
0.02
Ref. Ref. Ref.
Unemployed 13.6 (272) 1.29 (0.90-1.85) 1.28 (0.89-1.83) 1.28 (0.90-1.848)
Retired/At home 14.6 (936) 1.48 (1.06-2.08)* 1.49 (1.06-2.10)* 1.47 (1.04-2.06)*
Living in a couple relationship
Yes 9.9 (1,360)
<0.01 Ref. Ref. Ref.
No 15.0 (1,663) 1.63 (1.30-2.04)* 1.65 (1.32-2.06)* 1.64 (1.32-2.05)*
Severe functional limitation
No 10.3 (2,805)
<0.01 Ref. Ref. Ref.
Yes 33.5 (218) 3.17 (2.25-4.45)* 3.19 (2.27-4.48)* 3.19 (2.28-4.47)*
Activity space
Larger than perceived neighbourhood 11.1 (2,491)
>0.05 Ref. Ref. Ref.
Limited to perceived neighbourhood 13.2 (520) 1.05 (0.78-1.40) 0.99 (0.74-1.33) 0.99 (0.75-1.32)
Individual neighbourhood assessment
Positive 8.9 (1,298) <0.01 Ref. - -
Negative 14.4 (1,725) 1.57 (1.24-1.99)* - -
Contextual variables (level 2):
Collective neighbourhood assessment
Positive 9.9 (1,277)
0.03 - Ref. -
Negative 13.5 (1,746) - 1.21 (0.93-1.59) -
Neighbourhood census social composition
Upper- or middle-class neighbourhood 9.6 (1,821)
<0.01 - - Ref.
Working-class neighbourhood 17.2 (1,202) - - 1.57 (1.22-2.02)*
Location
Suburban areas 11.6 (2,234) >0.05 Ref. Ref. Ref.
Paris 11.7 (789) 1.30 (0.97-1.76) 1.24 (0.91-1.68) 1.40 (1.05-1.86)* Between-area variation: VarU0j (95% CI) Crude Model: 0.146 (0.067-0.314) Model 1: 0.044 (0.008-0.251) Model 2: 0.055 (0.013-0.238) Model 3: 0.018 (0.000-0.693) 1
Except for the bivariate analysis between depression and activity space (n=3,011). 2
Taking into account the complex sample design. 3
Pearson (design-based). * p <0.05
Spatial disparities in depression in the Paris metropolitan area
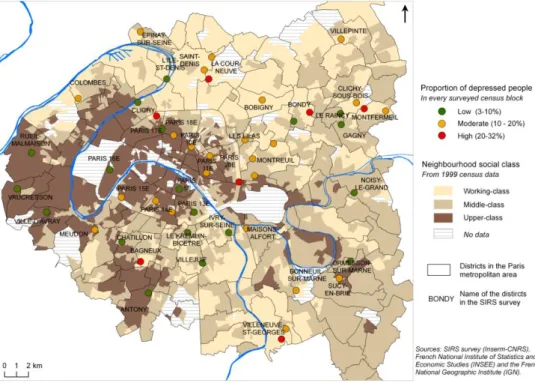
Depending on the surveyed census block, the crude proportion of people with depression varied from 3.1% to 31.6%, as shown in Figure 1. The crude between-area variation (VarU0j) was statistically
significant, which indicates that there were spatial disparities in depression between the 50 census blocks surveyed in the Paris metropolitan area (Table 2). We observed that the between-area variation in depression remained statistically significant when only individual variables were introduced into the model (not shown) but became statistically nonsignificant when measures of neighbourhood deprivation were introduced into other models in addition to individual variables (Models 1, 2 and 3 in Table 2). This means that spatial disparities in depression between the 50 surveyed census blocks in the Paris metropolitan area were fully explained by selected individual and neighbourhood characteristics.
Figure 1. Spatial disparities in depression in the Paris metropolitan area in 2005.
Activity space, neighbourhood characteristics and depression
We did not observe a statistical association between activity space and depression either in bivariate analysis or in multivariate analysis when individual and contextual characteristics were considered. However, interaction between activity space and neighbourhood characteristics was found to be statistically significant regardless of the method for characterizing neighbourhood deprivation: individual neighbourhood assessment (p<0.01; See Tables 3 and 4); collective neighbourhood assessment (p=0.01; See Tables 5 and 6) or neighbourhood census social composition (p<0.01; See Tables 7 and 8).
Table 3. Association between activity space and depression as determined from the multilevel logistic regression model for two subpopulations, by type of individual neighbourhood assessment
Depression1 People with: Entire population n=3,011 Interaction Activity space x individual neighbourhood assessment A positive assessment of their (perceived) neighbourhood n=1,291 A negative assessment of their (perceived) neighbourhood n=1,720
Odds Ratio (95% CI)
Activity space
p<0.01
Larger than the perceived neighbourhood Ref. Ref. Ref.
Limited to the perceived neighbourhood 0.58 (0.36-0.93)* 1.61 (1.10-2.36)* 0.97 (0.72-1.29)
1 After adjustment for sex, age, nationality, level of education, occupational status, employment status, couple
relationship status, functional limitation and urban location * p <0.05
Table 4. Association between individual neighbourhood assessment and depression as determined from the multilevel logistic regression model for two subpopulations, by type of activity space
Depression1
People with an activity space:
Entire population n=3,011 Interaction Activity space x individual neighbourhood assessment
Larger than the perceived neighbourhood n=2,491 Limited to the perceived neighbourhood n=520
Odds Ratio (95% CI)
Individual neighbourhood assessment
p<0.01
Positive Ref. Ref. Ref.
Negative 1.30 (1.00-1.70)* 3.29 (1.91-5.67)* 1.55 (1.22-1.96)*
1 After adjustment for sex, age, nationality, level of education, occupational status, employment status, couple
relationship status, functional limitation and urban location * p <0.05
Relationship between activity space and depression according to neighbourhood deprivation
Table 3 compares the point estimates of the odds ratios for the association between activity space and depression among the respondents who had individually given a negative or a positive assessment of their neighbourhood of residence. Those with an activity space limited to their perceived neighbourhood had a significantly higher risk of being depressed if they gave a negative assessment of their neighbourhood (OR=1.61; 95% CI=1.10-2.36) but a significantly lower risk of being depressed if they gave a positive assessment (OR=0.58; 95% CI=0.36-0.93).
Similarly, we observed (Table 5) that the respondents with an activity space limited to their perceived neighbourhood had a higher risk (but not statistically significant) of being depressed if they lived in neighbourhoods where the collective assessment was negative (OR=1.38; 95% CI=0.95-2.00) but a significantly lower risk of being depressed if they lived in neighbourhoods where the collective assessment was positive (OR=0.54; 95% CI=0.33-0.89).
Table 5. Association between activity space and depression as determined from the multilevel logistic regression model for two subpopulations, by type of collective neighbourhood assessment
Depression1
People living in neighbourhoods:
Entire population n=3,011 Interaction Activity space x collective neighbourhood assessment
Whose residents gave a mainly positive assessment n=1,269 Whose residents gave a mainly negative assessment n=1,742
Odds Ratio (95% CI)
Activity space
p=0.01
Larger than the perceived neighbourhood Ref. Ref. Ref.
Limited to the perceived neighbourhood 0.54 (0.33-0.89)* 1.38 (0.95-2.00) 0.97 (0.72-1.29)
1 After adjustment for sex, age, nationality, level of education, occupational status, employment status, couple
relationship status, functional limitation and urban location * p <0.05
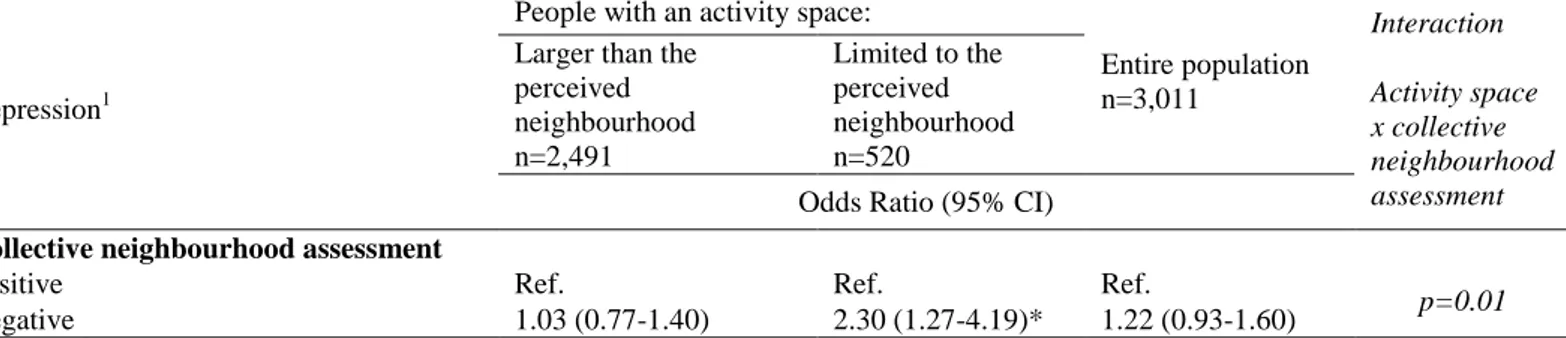
Table 6. Association between collective neighbourhood assessment and depression as determined from the multilevel logistic regression model for two subpopulations, by type of activity space
Depression1
People with an activity space:
Entire population n=3,011 Interaction Activity space x collective neighbourhood assessment
Larger than the perceived neighbourhood n=2,491 Limited to the perceived neighbourhood n=520
Odds Ratio (95% CI)
Collective neighbourhood assessment
p=0.01
Positive Ref. Ref. Ref.
Negative 1.03 (0.77-1.40) 2.30 (1.27-4.19)* 1.22 (0.93-1.60)
1 After adjustment for sex, age, nationality, level of education, occupational status, employment status, couple
relationship status, functional limitation and urban location * p <0.05
Lastly, it is seen in Table 7 that the participants with an activity space limited to their perceived neighbourhood had a significantly higher risk of being depressed (OR=1.62; 95% CI=1.06-2.49) if they lived in a working-class neighbourhood but a significantly lower risk of being depressed (OR=0.65; 95% CI=0.43-0.98) if they lived in an upper- or middle-class neighbourhood (as measured from census socio-occupational data).
Briefly, an activity space limited to the perceived neighbourhood may be seen as a protective factor with regard to depression for those living in advantaged neighbourhoods and as a risk factor with regard to depression for those living in deprived neighbourhoods - regardless of the method used for characterizing neighbourhood deprivation.
Table 7. Association between activity space and depression as determined from the multilevel logistic regression model for two subpopulations, by type of neighbourhood census social composition
Depression1
People living in:
Entire population n=3,011 Interaction Activity space x neighbourhood social composition Upper- or middle-class neighbourhoods n=1,815 Working-class neighbourhoods n=1,196
Odds Ratio (95% CI)
Activity space
p<0.01
Larger than the perceived neighbourhood Ref. Ref. Ref.
Limited to the perceived neighbourhood 0.65 (0.43-0.98)* 1.62 (1.06-2.49)* 0.97 (0.72-1.29)
1 After adjustment for sex, age, nationality, level of education, occupational status, employment status, couple
relationship status, functional limitation and urban location * p <0.05
Table 8. Association between neighbourhood census social composition and depression as determined from the multilevel logistic regression model for two subpopulations, by type of activity space
Depression1
People with an activity space:
Entire population n=3,011 Interaction Activity space x neighbourhood social composition
Larger than the perceived neighbourhood n=2,491 Limited to the perceived neighbourhood n=520
Odds Ratio (95% CI)
Neighbourhood census social composition
p<0.01
Upper- or middle-class neighbourhood Ref. Ref. Ref.
Working-class neighbourhood 1.31 (0.98-1.77) 4.05 (2.11-7.79)* 1.57 (1.21-2.04)*
1 After adjustment for sex, age, nationality, level of education, occupational status, employment status, couple
relationship status, functional limitation and urban location * p <0.05
Greater effect of neighbourhood characteristics on depression according to activity space
Table 4 compares the point estimates of the odds ratios for individual neighbourhood assessments among the respondents with an activity space limited to their perceived neighbourhood and those with a larger activity space. Their mental health was statistically more affected by a negative individual neighbourhood assessment if they had reported an activity space limited to their neighbourhood (OR=3.29; 95% CI=1.91-5.67) compared to those who had reported an activity space extending beyond their perceived neighbourhood (OR=1.30; 95% CI=1.00-1.70).
Similarly, we observed (Table 6) that the odds ratios for the association between a negative collective neighbourhood assessment and depression were statistically greater in the participants with an activity space limited to their perceived neighbourhood (OR=2.30; 95% CI=1.27-4.19) compared to those whose activity space extended beyond their perceived neighbourhood (OR=1.03; 95% CI=0.77-1.40). Lastly, Table 8 compares the point estimates of the odds ratios for the association between neighbourhood census social composition and depression among the respondents with an activity space limited to the perceived neighbourhood and those with a larger activity space. Their mental
health was statistically more vulnerable to neighbourhood deprivation if they had an activity space limited to their perceived neighbourhood (OR=4.05; 95% CI=2.11-7.79) compared to those whose activity space extended beyond their perceived neighbourhood (OR=1.31; 95% CI=0.98-1.77).
Briefly, living in a deprived or negatively perceived neighbourhood had the most negative effect in terms of depression in the respondents with an activity space limited to their perceived neighbourhood of residence.
Sensitivity analysis
Individual and collective neighbourhood assessments were first continuously measured. Before categorizing these two neighbourhood variables, we checked in multilevel logistic regression models that they were linearly related (p=0.01) to depression. We decided to convert these two continuous variables to binary variables to more easily analyze the cross-level interactions according to these assessments (Table 3 and Table 5).
For the same reason, we decided to divide the respondents into two groups on the basis of their activity space score. We chose a cut-off of 0.8, which led to 17.5% of the respondents being classified as having an activity space limited to their neighbourhood of residence. If a cut-off of 0.7 had been used, it would have led to 29.3% of the respondents being classified as having a limited activity space. In this case, cross-level interactions would have been statistically significant for individual neighbourhood assessment (p<0.01) and neighbourhood census social composition (p=0.04), but not for collective neighbourhood assessment (p=0.18). If a cut-off of 0.6 had been used, it would have led to nearly half of the surveyed population (42.6%) being categorized as having a limited activity space, and the cross-level interactions would have been statistically significant for individual neighbourhood assessment (p<0.01), but not for neighbourhood census social composition (p=0.15) or collective neighbourhood assessment (p=0.32). Finally, when the score measuring the concentration of their daily activities in their neighbourhood was considered as a continuous variable in the models, the cross-level interactions were found to be statistically significant for individual neighbourhood assessment (0.03), but not for collective neighbourhood assessment (p=0.18) or neighbourhood census social composition (p=0.10). In conclusion, even if our models‟ ability to detect significant interactions was obviously dependent on the cut-off chosen for reasons of statistical power, we observed that (i) the point estimates of the odds ratios for neighbourhood deprivation were always higher among the respondents with a limited activity space than among those with a larger activity space, and that (ii) the point estimates of the odds ratios for a limited activity space were always greater than 1 in deprived neighbourhoods (which indicates a higher risk of being depressed) and less than 1 in more privileged neighbourhoods (which indicates a lower risk of being depressed).
Discussion
Greater sensitivity to residential characteristics in people with a limited activity space
In this research, we observed greater vulnerability to neighbourhood deprivation in the respondents who concentrated their daily activities in their perceived neighbourhood of residence. This vulnerability could be due to the fact that a limited activity space may increase contact with the people, institutions, spatial structures and norms present in the neighbourhood of residence (Hanson, 2005). On the other hand, a larger activity space may permit exposure to a greater variety of neighbourhoods, people and social norms. Urban geographers and environmental psychologists who have studied the role of daily mobility in neighbourhood attachment have described daily travels within the overall city as a way to escape the constraints of one‟s residential neighbourhood (Authier, 1999; Gustafson, 2008; Ramadier, 2007). This interpretation was still being developed by Inagami et al. (2007), when they studied adult self-rated health and found that residential neighbourhood effects are suppressed by exposure to other environments.
Association between activity space and depression according to neighbourhood deprivation status. This research also revealed that an activity space limited to the neighbourhood of residence was protective with regard to depression for people living in advantaged neighbourhoods. We can postulate that spatial confinement may have indeed promoted individual well-being for people living in places where social cohesion and public and private facilities were assessed positively by the residents. In addition, we can also hypothesize that spatial confinement within advantaged neighbourhoods results from a choice rather than a constraint. Consequently, an activity space limited to one‟s residential neighbourhood may be associated with well-being in privileged neighbourhoods because this spatial behaviour is voluntary.
On the other hand, spatially limited daily mobility appeared to be associated with more frequent depression in deprived areas. This inverse association could be a consequence of constrained spatial confinement within deprived neighbourhoods due to the material and physical difficulties or symbolic barriers to moving outside such neighbourhoods.
Lastly, the opposite relationship between activity space and depression according to neighbourhood deprivation status may explain why we did not observe a significant association between activity space and depression in the models with no interaction (e.g., OR=0.99; 95% CI=0.74-1.33; See Model 2 in Table 2). In these models, we did not, in fact, observe an association between activity space and depression precisely because this association varied in an opposite direction according to neighbourhood deprivation status.
Activity space, functional limitation and depression
Previous research has shown that functional limitation (or disability) was frequently related to greater depression (Bierman & Statland, 2010; Gayman et al., 2008). Some studies have suggested a reciprocal, potentially spiralling relationship between depression and functional limitation, notably in late life (Bruce, 2001; Carriere et al., 2009). In this research, we also observed that participants with
severe functional limitation were significantly more depressed (Table 2). However, reducing the role of daily mobility in health to functional limitation alone would be restrictive. Indeed, we observed - according to neighbourhood deprivation status - a relationship between activity space and health, even after adjusting for functional limitation. These results suggest that one should explore both functional limitation and activity space when examining in detail the role of daily mobility in depressive symptoms.
Methodological bias
The frequency with which each activity was engaged in was not considered in the computation of activity space score. It could nonetheless affect the quality of the activity space score, particularly for discriminating social activities. Eating out at a restaurant weekly as opposed to once a year could reflect a different way to move about within a city. If frequency data were available - which is not the case in our survey database- it could be interesting to weight the activity space score with frequency data.
The main limitation of the simplified measure of activity space proposed in this paper stems from the impossibility of distinguishing between the actual spatial extent of daily mobility and the perceived neighbourhood delimitation (Vallée et al., 2010). Our measure of activity space was not defined on the basis of the precise location of the daily activities, but was instead directly linked to the respondents‟ neighbourhood representation, since they were asked to place their activities within or outside what they considered their neighbourhood of residence. So, when studying in the same analysis both measure of activity space based on the individual perceived neighbourhood delimitation and the measure of neighbourhood deprivation based on the census neighbourhood delimitation (See Model 3 in Table 2), a potential spatial discrepancy can appear and lead to a misinterpretation of personal exposure to the neighbourhood for some individuals (Vallée et al., 2010). Depending on the individual, the spatial delimitation of the perceived neighbourhood may be the same, smaller or larger than the census unit. Unfortunately, data collected in 2005 did not enable us to study precisely individual perceived neighbourhood boundaries. To address this potential spatial discrepancy it was therefore interesting to take into account neighbourhood individual assessments which were logically based on individual perceived neighbourhood boundaries. When considering both the model of activity space, based on the respondents‟ statement, and the measure of neighbourhood deprivation, based on respondents‟ assessments (See Model 1 in Table 2), the potential spatial discrepancy should disappear.
However, we must also consider that an individual‟s neighbourhood delimitation may vary according to the question. A “one-size-fits-all” definition of the neighbourhood may be too simplistic (Stafford et al., 2008). For example, a person may delimit his or her neighbourhood as a small building block when reporting the location of his or her domestic and social activities but delimit his or her neighbourhood as a larger space when evaluating the quality of his or her residential environment.
Reporting bias is another important methodological bias, as discussed in the literature investigating neighbourhood effects on depression (Mair et al., 2008). Reporting bias exists if people who are depressed are more likely to give a more negative assessment of their neighbourhood because of their depression, even if, objectively, the neighbourhood conditions are actually good. To address this potential reporting bias, we used census information to characterize neighbourhood deprivation independently of the perceptions of our sample respondents.
In short, we suggest that reporting bias might be less problematic when the neighbourhood characteristics of interest were measured from information collected independently of the sample respondents (i.e. census information). Conversely, we suggest that potential spatial discrepancy might be less problematic when the measures of neighbourhood deprivation were derived from individual or collective participant perceptions. Models incorporating either individual neighbourhood assessments (Model 1), collective neighbourhood assessments (Model 2) or neighbourhood census social composition (Model 3) yielded concordant results. Regardless of the method for characterizing neighbourhood deprivation, similar significant relationships between depression, activity space and neighbourhood deprivation were then observed.
Reverse causation and causality
Cross sectional analyses such as those presented here cannot be discussed in terms of causality. Specifically, it is not known (i) if a limited activity space leads to depression in deprived areas and to well-being in privileged areas, or (ii) if depression leads individuals to concentrate their daily activities within their neighbourhood if they live in a deprived area and to extend their activity space beyond their neighbourhood if they live in privileged areas. Even if it appears implausible to assume that depression leads people in privileged areas to extend their activity space, it would be interesting to analyse longitudinal data collected in 2005 and 2009 among the same population (within the framework of the SIRS cohort) in order to overcome causality interpretation problems, which affect all cross-sectional studies.
Longitudinal analysis could also be useful in limiting reverse causation bias associated with residential trajectories. This reverse causation bias would arise if depressed people were particularly inclined to move into or to remain within deprived neighbourhoods and mentally healthy people were particularly inclined to move into or to remain in advantaged neighbourhoods (Curtis et al., 2009; DeVerteuil et al., 2007). In such case, exposure to neighbourhood characteristics would be a consequence, not a cause of, depression. In cross-sectional studies, residential mobility could thus lead to a misinterpretation of the relationship between depression and exposure to neighbourhood characteristics.
Model adjustment
As in other research studying the association between neighbourhood characteristics and depressive symptoms, individual-level confounders, such as age, gender, couple relationship status, education,
occupational status and employment status, were included in our models to control for residual confounding. However, there is no consensus as to what the key confounders are (Mair et al., 2008). With regard to respondent's 'origin' we used nationality data to distinguish between French people and foreigners. Statistical data on 'race' or 'ethnicity' cannot, by law, be collected or used in research in France. In the final models, we preferred to include occupational status rather than household income, even if people from poor households were found to be more inclined to concentrate their daily activities within their perceived neighbourhood (Vallée et al., 2010) and to be significantly more depressed (models not shown). However, household income and occupational status were too closely correlated to be integrated simultaneously into the same regression models. To be consistent with the choice of socio-occupational data which were used to measure neighbourhood census social composition at the IRIS level, we opted for individual occupational status.
We also accounted for functional limitation because we wanted to be able to study activity space after adjusting for disability. Finally, we included in our models a variable describing urban neighbourhood location because it can be postulated that central urban residence may be associated with a higher risk of depression (Ross, 2000). We observed a significant difference in this regard in only one of the three models (Model 3 in Table 2). Actually, we kept urban location in the regression models to take into account differences in the size of perceived neighbourhood according to urban and suburban location, which were previously described in the Paris metropolitan area (Humain-Lamoure, 2010).
Further implications
Investigating activity space promises a deeper understanding of the mechanisms involved in depression. As for mental health policy, this study suggests that more attention should be paid to people who are spatially confined within a deprived neighbourhood, considering that such confinement may explain, at least in part, the social inequalities in depression prevalence observed in most cities in developed countries. From a medical perspective, since it is known that the accuracy of depression recognition by non-psychiatric physicians is generally low, particularly in underprivileged populations (Cepoiu et al., 2008), it could be useful to inform primary care physicians that not only social isolation but also constrained spatial confinement may bring about conditions conducive to depression. As for city planning policy, this research underscores the importance of enabling people to overcome any material or physical difficulties so that they can move about outside their neighbourhood of residence. Special efforts in public transportation for deprived populations and confined neighbourhoods could then help improve individual well-being.
Since the sample we studied was from the largest metropolitan area in France, where the population is more educated and has higher incomes on average (but also shows the deepest social disparities) and where there is a highly developed public transportation system and numerous (but unevenly distributed) services and recreation resources, our results cannot be extrapolated to smaller urban settings or to rural areas, even if it can be assumed that there could be a similar association between spatial confinement and depression in such places. On the other hand, it would be interesting to
replicate such an approach in other major urban settings, particularly in other world cities that share with Paris similar urban and social patterns.
Conclusion
The social epidemiology, health geography and public health literature studying the relationship between neighbourhood and mental health has seldom accounted for the role of activity space. This paper points out that it may be useful to examine how activity space - representing an individual's experience of place and degree of mobility - modifies in a significant way the strength of neighbourhood effects on depression and how neighbourhood characteristics reverse the association between activity space and depression. Data on activity space as measured by the concentration of daily activities in the perceived neighbourhood are easy to collect in a large sample and permit a deeper understanding of the mechanisms linking the neighbourhood of residence and mental health. Considering only the effect of the neighbourhood of residence on health and excluding non-residential exposure would lead to a “local trap” (Cummins, 2007) and consequently to an exposure misclassification (Basta et al., 2010). We therefore suggest taking activity space into account more systematically when studying the neighbourhood determinants of health outcomes.
Funding/Support
The SIRS survey was supported by the French National Institute for Health and Medical Research (INSERM), the Institute for Public Health Research (IReSP), the Directorate-General of Health (DGS), the Interministerial Delegation for Urban Affairs (DIV), the European Social Fund, the Regional Council of Île-de-France, and the City of Paris. Support for Julie Vallée‟s postdoctoral research was provided by the Fondation de France.
Acknowledgements
The authors would like to thank three anonymous referees for their helpful comments.
References
Arcury, T.A., Gesler, W.M., Preisser, J.S., Sherman, J.E., Spencer, J., & Perin, J. (2005). The Effects of Geography and Spatial Behavior on Health Care Utilization among the Residents of a Rural Region. Health Services Research, 40:1, 135-155.
Authier, J.-Y. (1999). Le quartier à l'épreuve des mobilités “métapolitaines”. Espaces, populations et
sociétés, 2, 291-306.
Basta, L.A., Richmond, T.S., & Wiebe, D.J. (2010). Neighborhoods, daily activities, and measuring health risks experienced in urban environments. Soc Sci Med, 71(11), 1943-1950.
Berke, E.M., Gottlieb, L.M., Moudon, A.V., & Larson, E.B. (2007). Protective association between neighborhood walkability and depression in older men. J Am Geriatr Soc, 55(4), 526-533. Bierman, A., & Statland, D. (2010). Timing, Social Support, and the Effects of Physical Limitations
Bruce, M.L. (2001). Depression and Disability in Late Life: Directions for Future Research. American
Journal of Geriatric Psych, 9(2), 102-112.
Carriere, I., Villebrun, D., Peres, K., Stewart, R., Ritchie, K., & Ancelin, M.L. (2009). Modelling complex pathways between late-life depression and disability: evidence for mediating and moderating factors. Psychol Med, 39(10), 1587-1590.
Cepoiu, M., McCusker, J., Cole, M.G., Sewitch, M., Belzile, E., & Ciampi, A. (2008). Recognition of depression by non-psychiatric physicians--a systematic literature review and meta-analysis. J
Gen Intern Med, 23(1), 25-36.
Chaix, B., Merlo, J., Evans, D., Leal, C., & Havard, S. (2009). Neighbourhoods in eco-epidemiologic research: delimiting personal exposure areas. A response to Riva, Gauvin, Apparicio and Brodeur. Soc Sci Med, 69(9):1306-1310.
Chauvin, P., & Parizot, I. (2009). Les inégalités sociales et territoriales de santé dans l’agglomération
parisienne : une analyse de la cohorte SIRS Paris: Editions de la DIV (coll. Les documents de
l‟ONZUS).
Cox, B., van Oyen, H., Cambois, E., Jagger, C., le Roy, S., Robine, J.M., & Romieu, I. (2009). The reliability of the Minimum European Health Module. Int J Public Health, 54(2), 55-60. Cummins, S. (2007). Commentary: investigating neighbourhood effects on health-avoiding the 'local
trap'. Int J Epidemiol, 36(2), 355-357.
Curry, A., Latkin, C., & Davey-Rothwella, M. (2008). Pathways to Depression: The Impact of Neighborhood Violent Crime on Inner-City Residents in Baltimore, Maryland, USA. Soc Sci
Med, 61(7), 23-30.
Curtis, S. (2004). Health and Inequality: Geographical Perspectives. London: Sage.
Curtis, S., Setia, M. & Quesnel-Vallee, A. (2009) Socio-Geographic Mobility and Health Status: a longitudinal analysis using the National Population Health Survey of Canada. Soc Sci Med, 69, 12, 1845-1853
DeVerteuil, G., Hinds, A., Lix, L., Walker, Jl, Robinson, R., & Roos, L. (2007). Mental health and the city: intra-urban mobility among individuals with Schizophrenia. Health & Place, 13, 310– 323.
Diez-Roux, A. (2001). Investigating neighborhood and area effects on health. American Journal of
Public Health, 91(11), 1783-1789.
Echeverria, S., Diez-Roux, A.V., Shea, S., Borrell, L.N., & Jackson, S. (2008). Associations of neighborhood problems and neighborhood social cohesion with mental health and health behaviors: the Multi-Ethnic Study of Atherosclerosis. Health & Place, 14(4), 853-865.
Evans, G.W. (2003). The built environment and mental health. Journal of Urban Health, 80(4), 536-555.
Fagg, J., Curtis, S., Clark, C., Congdon, P., & Stansfeld, S. A. (2008). Neighbourhood perceptions among inner-city adolescents: Relationships with their individual characteristics and with independently assessed neighbourhood conditions. Journal of Environmental Psychology, 28(2), 128-142.
Fitzpatrick, K.M., Piko, B.F., Wright, D.R., & LaGory, M. (2005). Depressive symptomatology, exposure to violence, and the role of social capital among African American adolescents. Am J
Orthopsychiatry, 75(2), 262-274.
Galea, S., Ahern, J., Rudenstine, S., Wallace, Z., & Vlahov, D. (2005). Urban built environment and depression: a multilevel analysis. J Epidemiol Community Health, 59(10), 822–827.
Gary, T.L., Stark, S.A., & LaVeist, T.A. (2007). Neighborhood characteristics and mental health among African Americans and whites living in a racially integrated urban community. Health
& Place, 13(2), 569-575.
Gatrell, A. (2002). Geographies of Health. Oxford: Blackwell.
Gayman, M.D., Turner, R.J., & Cui, M. (2008). Physical limitations and depressive symptoms: exploring the nature of the association. J Gerontol B Psychol Sci Soc Sci, 63(4), S219-S228. Golledge, R.G., & Stimson, R.J. (1997). Spatial Behaviour - A geographic perspective. New York:
Guilford Press.
Gustafson, P. (2008). Mobility and Territorial Belonging. Environment and Behavior.
Gutman, L.M., & Sameroff, A.J. (2004). Continuities in depression from adolescence to young adulthood: contrasting ecological influences. Dev Psychopathol, 16(4), 967-984.