HAL Id: hal-03212674
https://hal.archives-ouvertes.fr/hal-03212674
Submitted on 30 Apr 2021
HAL is a multi-disciplinary open access
archive for the deposit and dissemination of
sci-entific research documents, whether they are
pub-lished or not. The documents may come from
teaching and research institutions in France or
abroad, or from public or private research centers.
L’archive ouverte pluridisciplinaire HAL, est
destinée au dépôt et à la diffusion de documents
scientifiques de niveau recherche, publiés ou non,
émanant des établissements d’enseignement et de
recherche français ou étrangers, des laboratoires
publics ou privés.
A novel model evaluation approach focusing on local and
advected contributions to urban PM<sub>2.5</sub>
levels – application to Paris, France
H. Petetin, M. Beekmann, J. Sciare, M. Bressi, A. Rosso, O. Sanchez, V.
Ghersi
To cite this version:
H. Petetin, M. Beekmann, J. Sciare, M. Bressi, A. Rosso, et al.. A novel model evaluation approach
focusing on local and advected contributions to urban PM<sub>2.5</sub> levels – application to
Paris, France. Geoscientific Model Development, European Geosciences Union, 2014, 7 (4),
pp.1483-1505. �10.5194/gmd-7-1483-2014�. �hal-03212674�
www.geosci-model-dev.net/7/1483/2014/ doi:10.5194/gmd-7-1483-2014
© Author(s) 2014. CC Attribution 3.0 License.
A novel model evaluation approach focusing on local and advected
contributions to urban PM
2.5
levels – application to Paris, France
H. Petetin1, M. Beekmann1, J. Sciare2, M. Bressi2, A. Rosso3, O. Sanchez3, and V. Ghersi3
1LISA/IPSL, Laboratoire Interuniversitaire des Systèmes Atmosphériques, UMR CNRS7583,
Université Paris Est Créteil (UPEC) et Université Paris Diderot (UPD), France
2LSCE, Laboratoire des Sciences du Climat et de l’Environnement, CNRS-CEA-UVSQ, Gif-sur-Yvette, France
3AIRPARIF, Agence de surveillance de la qualité de l’air, Paris, France
Correspondence to: H. Petetin (herve.petetin@lisa.u-pec.fr)
Received: 16 October 2013 – Published in Geosci. Model Dev. Discuss.: 5 December 2013 Revised: 7 March 2014 – Accepted: 21 May 2014 – Published: 18 July 2014
Abstract. Aerosol simulations in chemistry transport
mod-els (CTMs) still suffer from numerous uncertainties, and di-agnostic evaluations are required to point out major error sources. This paper presents an original approach to evaluate CTMs based on local and imported contributions in a large megacity rather than urban background concentrations. The study is applied to the CHIMERE model in the Paris region (France) and considers the fine particulate matter (PM2.5)
and its main chemical constituents (elemental and organic carbon, nitrate, sulfate and ammonium), for which daily mea-surements are available during a whole year at various sta-tions (PARTICULES project). Back-trajectory data are used to locate the upwind station, from which the concentration is identified as the import, the local production being deduced from the urban concentration by subtraction. Uncertainties on these contributions are quantified. Small biases in urban
background PM2.5simulations (bias of +16 %) hide
signifi-cant error compensations between local and advected contri-butions, as well as in PM2.5chemical compounds. In
particu-lar, winter time organic matter (OM) imports appear strongly underestimated while local OM and elemental carbon (EC) production is overestimated all along the year. Erroneous continental wood burning emissions and missing secondary organic aerosol (SOA) pathways may explain errors on ad-vected OM, while the carbonaceous compounds is likely to be related to errors in emissions and dynamics. A statisti-cally significant local formation of nitrate is also highlighted from observations, but missed by the model. Together with the overestimation of nitrate imports, it leads to a bias of
+51 % on the local PM2.5 contribution. Such an evaluation
finally gives more detailed insights on major gaps in current CTMs on which future efforts are needed.
1 Introduction
Fine particulate matter (PM2.5, particulate matter with
aero-dynamic diameter below 2.5 µm) pollution is well-known to produce adverse health effects (Chow et al., 2006), and to affect ecosystems and monuments through acidic deposition soiling (Likens et al., 1996; Lombardo et al., 2013). It also impacts on climate directly through its diffusing and absorp-tive properties and indirectly through various modifications of cloud properties (Lohmann and Feichter, 2005), leading to changes in the earth radiative balance (Forster et al., 2007).
In the European Union, many member states, including France, still fail to reach both daily and annual PM stan-dards (EEA, 2012). Besides some rural areas (e.g., Po valley and Silesia), the exceedances of air quality standards mainly occur in cities that gather population and associated anthro-pogenic activities. In 2010, about 21 % of EU urban pop-ulation has been exposed to levels not complying with the PM10 daily limit value (daily 50 µg m−3 concentration
ex-ceeded less than 35 days per year). During the 2001–2010 period, all regulated EU pollutant emissions contributing to fine particles have decreased as follows: by about −15 % for PM2.5 (decrease in all source sectors except non-industrial
fuel combustion that increases), and for its gaseous
precur-sors by about −54 % for SO2, −27 % for NOx, and −10 %
for NH3. Nevertheless, trends in PM2.5 concentrations
re-main unclear (EEA, 2012), due to variations in meteorologi-cal conditions and due to the possibly important contribution of biogenic sources.
2.5
Chemistry-transport models (CTMs) have become a very useful tool for both air quality forecasting and emission sce-nario analysis in order to help air quality managers and policy-makers finding appropriate solutions for pollution abatement. Nevertheless, strong uncertainties in emissions, meteorological data, physical parameterizations and chem-ical schemes still prevent CTMs to correctly retrieve PM concentrations and even more its chemical speciation. In the framework of the Air Quality Modelling Evaluation Interna-tional Initiative (AQMEII) project (Rao et al., 2011), a re-cent cross-comparison over a whole year of ten CTMs in Europe and North America has shown a strong variability between models, with root-mean square errors (RMSE) for PM10around 7.3–15.2 µg m−3(Solazzo et al., 2012). Most of
these models tend to largely underestimate PM10
concentra-tions, with biases ranging from −14 to +1.4 µg m−3. Results
are better for PM2.5, particularly in terms of correlation (R
in the range of 0.4–0.8, compared to 0.2–0.7 for PM10).
Au-thors have underlined that performances and discrepancies between models are also important during specific episodes of enhanced PM levels. By comparing five CTMs during a winter PM episode in Europe, Stern et al. (2008) have shown
biases ranging from −15 to +7 µg m−3. Many other model
studies in Europe (e.g., Sartelet et al., 2007) drew similar conclusions concerning the PM underestimation.
Various uncertainty sources are at stake in CTMs. Among them, emissions still remain a critical point, with strong un-certainties both in emission factors and/or spatial distribution for some source sectors, such as biomass burning, road dust re-suspension (usually missing in inventories), and agricul-ture. Even with similar input data, discrepancies can raise from emission preprocessing (Solazzo et al., 2012). Sec-ondary organic aerosol (SOA) formation also represents a large field of research, with various formation pathways still ignored or poorly understood (see for example Hallquist et al., 2009, and references therein). Meteorological errors can also impact on PM levels through advection and dispersion (wind speed and direction, vertical mixing in the boundary layer) or removal by precipitation (Vautard et al., 2012). In their cross-comparison, Solazzo et al. (2012) have underlined that underestimated wind speed and overestimated precipi-tation frequency can partly explain the negative PM10 bias.
Because of the lack of measurements, dry deposition repre-sents another important uncertainty source (Nopmongcol et al., 2012).
CTM parameterizations evaluation is traditionally limited to comparison between modeled and measured concentra-tions at various sites. Nevertheless, such an approach usu-ally conceals the geographic provenance of errors in terms of local emission/production and regional import. This is particularly important for PM2.5 since, in addition to direct
emissions, it can be formed from gaseous precursors and ad-vected over long distances, due to limited chemical removal pathways for most PM compounds and slow dry deposition of aerosol present in the accumulation mode (Van Dingenen
et al., 2004). This sometimes leads to strong regional back-ground that is advected toward cities and adds to the local urban pollution increment. Large advected PM contributions have already been shown in megacities such as New York through strong proportions of secondary species, with 54 and 24 % of organic aerosol (mainly oxidized, at 64 %) and sul-fate, respectively (Sun et al., 2011). Several studies in Paris have indicated the potential significant influence of PM im-ports (Sciare et al., 2010; Bressi et al., 2013; Zhang et al.,
2013). Through a modeling exercise of long-term PM10
con-centrations in the Paris region, Hodzic et al. (2005) have pointed out some error compensations between the local pro-duction and the rural background.
If many PM studies in megacities have recently given rise to a potential strong advected contribution, very few have intended to systematically quantify it. Lenschow et al. (2001) have developed a methodology (that will be de-tailed in Sect. 4), based on measurements at sites of various typologies (rural and urban background, traffic) and applied to the greater Berlin area, to discriminate these local and re-gional contributions. This approach turns out to be useful in
air quality management to assess both the sources of PM2.5
and the relevance to work on local emissions. Results have shown that the long-range transport accounts for about 50 % of the Berlin urban background PM10concentrations.
Based on this approach, this paper intends to evaluate the ability of a regional CTM to retrieve the correct share
between local and imported PM2.5 contributions in a large
megacity. Assessing these two contributions separately is a novel and useful approach which goes beyond traditional model evaluation based on simulation-observation compar-isons for particular sites. It will be applied to the CHIMERE model in the greater Paris region. This large urban area gath-ers all the characteristics of a megacity, including more than 10 million inhabitants and concentrates an important part of the French economic activities.
The observational data base used in this paper is based on the results of the one-year PARTICULES campaign (AIR-PARIF, 2012; Bressi et al., 2013) in the greater Paris region,
that consists of daily PM2.5 chemical speciation
measure-ments at various sites.
After a short description of the measurement data base (Sect. 2), the CHIMERE model will be presented as well as its configuration used for this study (Sect. 3). Then the methodology to derive the urban and the advected part of PM2.5will be detailed (Sect. 4). Results will be first analysed
for each of the main PM2.5compounds and then implications
for model evaluation will be discussed (Sect. 5), before con-clusion (Sect. 6).
2 Measurement data base
In the framework of the PARTICULES project
closure measurements have been performed in the Paris re-gion and its surroundings during a whole year period, from the 11 September 2009 to the 10 September 2010. Six sites have been documented, including an urban background site (PAR) and three rural background sites, respectively, in the northeast (RNE), south (RUS), and northwest (RNW) of Paris. Bressi et al. (2013) have described in details the sam-pling and analytical setup and have presented the experimen-tal database obtained from this campaign. At each site, PM2.5
has been collected by two Leckel samplers, one equipped with Teflon filters for gravimetric and ions measurements, the other with quartz filters for carbon measurements. Mea-surement techniques and uncertainty estimates for main com-pounds are summarized in Table 1.
Three different measurements of PM2.5 concentration are
available (among which two are independent): the PM2.5
concentration measured by a tapered element oscillating mi-crobalance coupled with a filter dynamics measurement
sys-tem (TEOM-FDMS) considered here as reference (PMref),
the gravimetric measurement at RH (relative humidity) be-low 20 % (PMgrav), and the chemically reconstructed PM2.5
concentration calculated from the aforementioned
measure-ments/estimations of each compound (PMchem). That last
value requires OC measurements to be converted into organic matter (OM). The OM / OC conversion factors are taken as 1.95 and 2.05 for the urban and the rural background sites, re-spectively, in general agreement although in the upper range of values given by other studies (Bressi et al., 2013). Using only these conversion factors, correlation coefficients (R2)
between PMchem and PMgrav reach more than 0.98 at
ev-ery site. In order to be consistent with the chemical com-pounds analysis, notably in terms of contribution, all PM2.5
concentrations mentioned in the paper refer to PMgrav
mea-surements.
It is worthwhile noting that filter sampling can induce significant artifacts especially due to evaporation of volatile compounds (mainly ammonium nitrate and organic species) (Pang et al., 2002), or adsorption and eventually oxidation of some gaseous compounds (such as nitric acid, ammo-nia, sulfur dioxide or some volatile organic carbons, VOC) (Cheng and Tsai, 1997; and references therein). To assess the uncertainties associated with these filter measurements, Bressi et al. (2013) have performed an intercomparison dur-ing 40 days in wintertime for ion measurements with a particle-into-liquid-sampler (PILS) coupled with ion chro-matography (IC). A satisfactory agreement has been found, with discrepancies remaining in the range of the measure-ment uncertainty fixed by the authors, i.e., around 20 %. Another intercomparison has been performed for carbona-ceous compounds during 70 days in winter and early spring with hourly VOC-denuded EC and OC concentrations from the OCEC Sunset field instrument, again leading to satisfac-tory agreement (discrepancies below 25 %, i.e., in the range of measurement uncertainties). However, these comparisons have been carried out during a period with potentially low
evaporation (low temperature, high RH), whereas various studies have shown that filter measurement artifacts increase with higher temperature (Keck et al., 2005; Yu et al., 2006).
Based on TEOM-FDMS measurements (PMref)available
during the campaign, it is possible to derive an upper limit of the error induced by filter measurements. The comparison with PMgrav shows that filter artifacts are mostly negative,
meaning that evaporation losses on filter exceed adsorption gains (except in August). By assuming that this error mainly affects ammonium nitrate and organic matter, one can esti-mate the underestimation of the total of both compounds at around −30 % in winter and −50 % in summer (see analysis in the Supplement, Sect. S1).
Concerning EC, it is to be noted that differences with black carbon (BC) measurements (Andreae et Gelencsér, 2006; Salako, 2012) can lead to misinterpretations of comparisons with model results if emission factors used in the inventory are not consistent with the measurements. In our case, the PM speciation used in simulations is derived from EC (and not BC) emission factors.
This study will focus on the main PM2.5components
anal-ysed during the PARTICULES campaign: OM, EC, nitrate, sulfate and ammonium. Sea salts and dust were minor com-pounds, and are not directly used for model evaluation. Note that for PM2.5and these six chemical constituents, depending
on the station, the missing data percentage ranges between 2 and 10 % of the year.
3 Simulations
3.1 CHIMERE model
Our work in this paper is performed with the v2008b version of the CHIMERE regional CTM (Schmidt and Derognat, 2001; Bessagnet et al., 2009; Menut et al., 2013) (www.lmd. polytechnique.fr/chimere). This model is widely used both in research activities and operational air pollution survey and forecasting in France (ESMERALDA, www.esmeralda-web. fr, and PREVAIR, www.prevair.org, platforms run by AIR-PARIF for the north and west of France and by PREVAIR at the national scale, respectively) and European Union (GMES-MACC program). The ESMERALDA project is a pooling of technical, human and financial means for Air qual-ity forecast system and emission inventory set-up by the fol-lowing nine French air quality monitoring networks, Atmo Picardie, Atmo Nord-Pas de Calais (north of France), Atmo Champagne-Ardennes, LIG’AIR (center region), Air Nor-mand (Haute-NorNor-mandie), AIRPARIF (Ile de France), AT-MOSF’AIR (Burgundy), AIRCOM (Basse-Normandie), and AIR BREIZH (Brittany). In the following, a focus will be made on the aerosol module of the CHIMERE model, which is of particular interest for this study.
2.5
Table 1. Measurement techniques and instruments for PM2.5and each of its compounds.
Species Measurement technique Instrument Uncertainty/Sensitivity
PM2.5
Gravimetry Microbalance Sartorius
MC21S
−/±1 µg TEOM-FDMS
Organic carbon (OC), elemental carbon (EC)
Thermo-optical Sunset Laboratory
instrument, EUSAAR-2 protocol
20 %∗20 %
Ions (NO−3, SO2−4 , NH+4) Ion chromatography Dionex DX600 5 %∗
∗Measurement error, not including filter sampling errors.
3.2 Aerosol module description
The main processes affecting the aerosol size distribution and chemical speciation are represented in the CHIMERE aerosol module. This includes emissions, nucleation, coag-ulation, condensation, and dry and wet deposition. Through a sectional representation within eight bins of size (diame-ter ranging from about 40 nm to 10 µm), the module takes into account various chemical species: primary material – in-cluding primary organic aerosol (POA), EC and the so-called mineral particulate matter (MPM) corresponding to the re-maining part –, nitrate, sulfate, ammonium, water, and SOA compounds.
Primary species (POA, EC, MPM) are treated as inert species that can only deposit by wet and/or dry processes. The SOA scheme consists of a single-step oxidation of an-thropogenic and biogenic VOC lumped species, giving di-rectly semi-volatile organic compounds that partition be-tween gaseous and particulate phases. SOA yields come from laboratory experiments (Pun and Seigneur, 2007). SOA pre-cursors include five biogenic lumped species – API (alpha-pinene, sabinene), BPI (beta-(alpha-pinene, delta-3-carene), LIM (limonene), OCI (ocimene, myrcene), ISO (isoprene) – and three anthropogenic ones – TOL (benzene, toluene, other mono-substituted aromatics), TMB (trimethylbenzene, other poly-substituted aromatics) and n-C4H10(higher alkanes).
Absorption processes are considered using a kinetical-dynamical approach, with equilibrium concentrations de-rived from a tabulated version of the ISORROPIA thermo-dynamic model (Nenes et al., 1998) for secondary inorganic species, and from a temperature dependent partition coeffi-cient according to Pankow (1994) for semi-volatile organic species. Coagulation (Gelbart and Seinfeld, 1980) and sulfu-ric acid nucleation (Kulmala et al., 1998) are also included in the model.
Aqueous sulfate chemistry is represented (Lee and Schwartz, 1983; Berge, 1993), including iron and man-ganese catalyzed oxidation reactions of the sulfite ion (SO2−3 )and hydrogen sulfite (HSO−3)(Hoffman and Calvert, 1985). Some heterogeneous reactions recommended by Jacob (2000) are also included in the model to take into
Figure 1. Nested domains used for the simulations, and ESM area
of the bottom-up anthropogenic emission inventory.
account the nitric acid formation onto existing particles and cloud droplets. Additionally, the HONO production from
NO2 reactions on wet particles (Aumont et al., 2003) is
added.
The dry deposition parameterization follows the tradi-tional resistance analogy (Wesely, 1989). Concerning wet de-position, the model accounts for both in-cloud (Tsyro, 2002; Guelle et al., 1998) and sub-cloud wet scavenging.
3.3 Model configuration
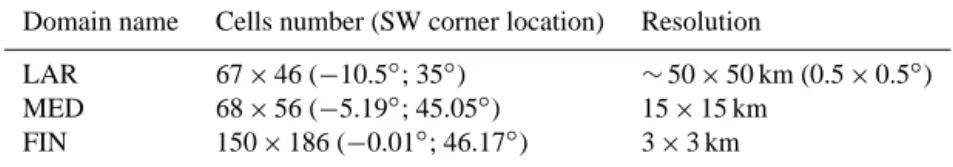
Simulations are performed with the ESMERALDA opera-tional modeling platform. Three nested domains – a large (LAR), a medium (MED) and a fine (FIN) one – are con-sidered with horizontal resolution progressively increasing
from 0.5◦(roughly 50 km) to 15 km to 3 km (see Fig. 1 and
description in Table 2), each with eight vertical levels, from 40 m to about 5 km height.
Meteorological inputs come from PSU/NCAR MM5 sim-ulations (Dudhia, 1993), performed over three nested do-mains with increasing resolutions of 45, 15 and 5 km, respectively, and using Final Analyses (FNL) data from the
Table 2. Domains description.
Domain name Cells number (SW corner location) Resolution
LAR 67 × 46 (−10.5◦; 35◦) ∼50 × 50 km (0.5 × 0.5◦)
MED 68 × 56 (−5.19◦; 45.05◦) 15 × 15 km
FIN 150 × 186 (−0.01◦; 46.17◦) 3 × 3 km
National Centers for Environmental Prediction (NCEP) as boundary conditions and large scale data.
Anthropogenic emissions come from the 1×1 km-resolved local ESMERALDA inventory, which was developed by lo-cal agencies over the so-lo-called ESM area (delimited by ad-ministrative borders, see Fig. 1), e.g., AIRPARIF (2010) for the Paris region and mainly derived from a bottom-up ap-proach. Following the methodology developed in the Euro-pean FP7/HEAVEN project, traffic emissions are computed from traffic data, fleet description and emission factors us-ing the COPERT IV approach (EEA, 2013). Fuel evaporation emissions are also taken into account. However, road, tire and brake abrasion emissions are ignored, as well as road dust re-suspension. So far, ammonia traffic emissions are not taken into account. The inventory includes emissions from other means of transport (aircraft, shipping, railway). Industrial sector emissions are derived from official statements when they exist or are computed from various types of data (e.g., national raw material consumptions, national productions). Basically, residential emissions are mostly computed using a bottom-up approach, from detailed local housing data (fuel type, housing type, age and size) and associated national consumption estimates. For wood burning related residen-tial emissions, because of the lack of local data, equipment (boiler, open/closed fireplaces, etc.) distribution is taken from national statistics. These ESMERALDA emissions are ap-plied to both the MED and FIN domains, while emissions outside the ESM area are taken from the 0.5 × 0.5◦-resolved EMEP (European Monitoring and Evaluation Programme) inventory for all primary pollutants (Vestreng, 2003). Note that only this last inventory is used in the coarse simulation over the LAR domain.
Biogenic emissions (including isoprene, alpha- and beta-pinene, limonene, ocimene, humulene) are computed from MEGAN (Model of Emissions of Gases and Aerosols from Nature) emission factors (Guenther et al., 2006), apart from the ESM area where refined biogenic emission factors are computed from the 1 × 1 km-resolved French national for-est inventory (NFI). The land-use data used to process emissions is taken from Corine Land Cover (EEA, 2000), with a resolution of 250 m over Europe. Table S1 in the
Supplement (Sect. S2) gives the speciations of PM2.5 into
EC, OM, and mineral PM used for both the continental domain (with EMEP emissions) and the two refined do-mains (with the ESMERALDA inventory). For these latter domains, speciation is based on a bibliographic study carried
out by AIRPARIF. Initial and boundary conditions are taken from LMDz-INCA2 (Folberth et al., 2006) global model for gaseous species and GOCART (Goddard Chemistry Aerosol Radiation and Transport) (Chin et al., 2000) for particulate species.
4 Methodology
4.1 Determination of the advected and local PM2.5
fraction
The local greater Paris urban contribution to PM2.5 levels
can be deduced from concentrations measured at rural and urban background sites following the so-called Lenschow approach (Lenschow et al., 2001). Daily PM measurements are available at one urban (PAR (48.849◦N, 2.365◦E)) and three rural background sites located in three directions (RNE
(49.088◦N, 3.076◦E), RUS (48.363◦N, 2.26◦E), RNW
(49.063◦N, 1.866◦E)). Such a data set allows discriminating the local contribution to urban PM2.5 levels by subtracting
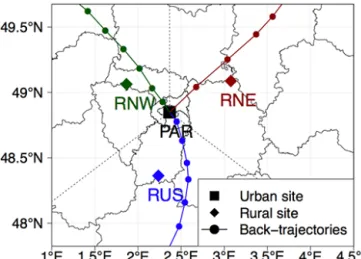
the appropriate upwind rural concentration. To choose the upwind site among the three rural background sites, a rather simple and automatic procedure has been developed, based on back trajectories. During the whole year, the FLEXTRA model (Stohl et al., 2001) has been initiated every 6 h with 10 particles distributed in the center of Paris, leading to a daily set of 40 back trajectories. Three main sectors are de-fined according to the following locations of the rural sites with respect to Paris: northeast (0–120◦), south (120–240◦) and northwest (240–360◦). The distance between Paris center and rural stations is about 50 km. By determining the dom-inant sector for particles in the last 4 hours before reaching Paris, the upwind rural site can be deduced. Figure 2 gives an illustration for 3 particular days. Due to the complexity of wind fields, this procedure is certainly too simplistic to account for all meteorological situations that may occur over the Paris region (e.g., back trajectories originating from more than one sector, recirculation). However, all these problems relative to the choice of the appropriate upwind rural site are tackled by the quantification of advected-contribution uncer-tainties in which all the three rural concentration values are included, as described in the next section.
Following Lenschow et al. (2001), the methodology thus relies on the assumption that (i) both the PAR station and the upwind rural station are representative of urban background and advected regional background, respectively, and that
2.5
Figure 2. Location of measurement sites in Paris (urban site, PAR)
and around (rural sites, RNE, RUS, RNW) greater Paris. Straight black lines delimit the three wind sectors. Back-trajectories for 3 specific days, one for each sector, are also represented by colored lines. Colored points over back trajectories indicate air mass loca-tion at each hour.
(ii) no significant changes affect the aerosol chemical com-position between rural sites and the edge of the agglom-eration (e.g., photochemistry, thermodynamic equilibrium). Concerning this latter hypothesis, the short distance between rural sites and Paris is likely to prevent most SOA produc-tion during the transport of air masses, as well as too strong discrepancies in thermodynamic conditions. The validity of the first hypothesis is further discussed in Sect. 4.2. In addi-tion, it should be noted that PM species concentrations are quite similar from one rural site to another, at least in aver-age over the year. However, strong discrepancies sometimes appear for the OM species, larger values at the RNE site be-ing probably related to some local wood burnbe-ing (domestic heating) emissions at this site. The RNE rural site can thus not be considered as representative of the OM rural back-ground, but this local wood burning pollution is not assumed to significantly impact the other species. In order to avoid in-validating all data from the RNE site, OM concentrations are invalidated only when the discrepancies with the two other sites are stronger than 30 % (see analysis and a discussion of this threshold value in the Supplement, Sect. S3).
4.2 Uncertainty discussion
In this section, we first discuss the uncertainties associated to the choice of the up-wind rural station. Uncertainties re-lated to the PM2.5urban background heterogeneity in greater
Paris, and consequently the representativeness of PAR mea-surements, are then investigated. Note that, throughout the paper, the term “urban” always refers to the urban back-ground concentration in the city, thus including both ad-vected and local contributions.
4.2.1 Uncertainties associated with the up-wind station
choice
The methodology is based on the hypothesis that the cho-sen rural station is reprecho-sentative of the rural background air mass advected toward the city. We investigate here the uncer-tainty associated with the choice of the up-wind rural station. For each day, up to three rural background stations may be available for estimating the advected contribution toward Paris. Considering the regular distribution of these stations in all directions around Paris, let us assume that the exact value of the advected contribution is bound by the lowest and highest concentrations among them. For each day i, the con-centration range among rural stations can thus be seen as the possible absolute error eion advected contribution. Based on
our first hypothesis, this value represents an upper limit of the uncertainty since the additional information given by the wind direction that allows the choice of a particular station is not taken into account. Considering a period of n days, from error propagation, the absolute uncertainty on the averaged advected contribution can then be estimated as
en= 1 n v u u t n X i=1 e2i. (1)
4.2.2 Urban background heterogeneity
The methodology used in this work is also based on the as-sumption that the PAR station is representative of the greater
Paris urban background. However, the PM2.5 heterogeneity
can be significant in this area. Although the model grid cell corresponding to the measurement site (with 3 km horizon-tal resolution) has been chosen for comparison purposes, the simulations may not correctly express the larger scale intra-urban variability, or the sub-grid variability. This would partly prevent us from interpreting the observed differences in the local contributions as representative for the whole ur-ban area.
Three other TEOM-FDMS are available in greater Paris from the AIRPARIF network (in the suburban area of Paris),
measuring both PM2.5 semi-volatile and non-volatile parts.
The top panel of Fig. 3 shows the PM2.5concentration range
of this station set including the PAR station, the mean PM2.5
concentration of these four stations, and the concentration measured at the PAR station. Discrepancies to the mean
daily PM2.5 concentration (bottom panel) range from −15.5
to +22.7 µg m−3, but most of the values (89 % of available
data) do not differ more than ±5 µg m−3 from the mean.
Large discrepancies may be due to specific local events or stagnant conditions preventing air masses from horizontal mixing. This latter situation occurred for instance on the 28 October, on which the lowest wind speed of the whole period was measured at the MONTSOURIS meteorological station (48.822◦N, 2.337◦E) in the center of Paris (daily
O N D J F M A M J J A S 0 10 20 30 40 50 60 70 Range Mean PAR station O N D J F M A M J J A S !10 0 10 20 O N D J F M A M J J A S PM2.5 concentr ation (µµ g. m !! 3)
Discrepancies to mean PM2.5 concentr
ation (µµ g. m !! 3)
Figure 3. Daily PM2.5 concentration range (black) from a set of
four urban background stations in greater Paris (top panel), with mean daily (red) and PAR (green) concentration. Bottom panel: the same minus the mean PM2.5concentration.
largest PM2.5 departure from the mean, which is also
visi-ble with PM10or NO2(not shown). On average, the PM2.5
concentration at the PAR site is slightly lower than the mean urban background concentration, with a discrepancy of −0.4 µg m−3.
Similarly to advected contributions, we define the abso-lute uncertainty on the urban background concentration as the maximum concentration range between this panel of ur-ban stations. However, as only PM2.5data are available in the
Paris region, the approach cannot be applied to main chemi-cal constituents of PM2.5.
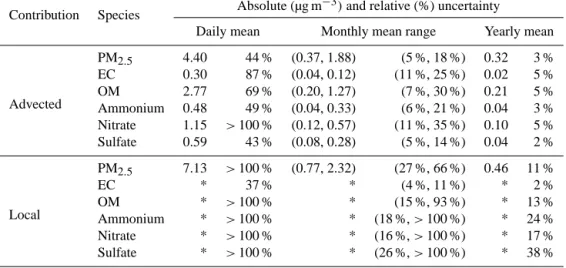
4.3 Overall contribution uncertainties
All these uncertainties are given in the Table 3 for all com-pounds at three time scales (daily, monthly, annual), and re-ported in Fig. 9 for each month. As local contributions (L) are deduced from advected ones (A) and urban background concentrations (U) by simple subtraction (L = U − A), from errors propagation it follows that these uncertainties on im-ports (eA)represent a minimum for the local contribution:
eL=
q
e2U+eA2, (2)
to which the uncertainty associated with the urban
back-ground concentration (eU)must be added. As seen before,
this latter uncertainty eUcannot be estimated for PM
chemi-cal constituents (as for PM2.5mass) due to missing additional
observations. The uncertainty on their local contributions is thus not fully quantified (as for PM2.5 mass), but has a low
limit given by the uncertainty on their imports. This might lead to an underestimation of this uncertainty.
At the daily scale, these uncertainties are quite strong. In relative terms, they prove to be too strong to be compared to model results. Moreover, as most compounds are mainly advected (except EC), uncertainties on local contributions are much stronger than on advected ones (despite their par-tial quantification). This explains the significant noise in the
daily time series. They are seriously reduced for monthly contributions, which justifies our choice to discuss results at this time scale. Such a decrease comes from a simple math-ematical consideration, that the uncertainty decreases with the root of the number of days, when considering errors on individual days as independent. Except for some chemical constituents during specific months of relatively low imports (EC and OM in October, nitrate in summertime), relative monthly uncertainties on advected contributions remain be-low ±20 %. Concerning monthly local contributions, values remain reasonable for EC (mainly local), ranging between
±4 and ±11 % depending on the month. Local OM monthly
uncertainties are more critical (±43 % in average), particu-larly during wintertime (January and February, with abso-lute uncertainties above 1 µg m−3for local contributions be-low 0.8 µg m−3)when they almost reach a factor of 2. They
are much stronger for secondary inorganic compounds (to a lesser extent for nitrates), due to very low monthly local contributions, often largely below the absolute uncertainty. However, several months show a non-negligible local con-tribution, specifically October, December and January.
Lo-cal PM2.5 contribution uncertainties show an average value
around ±41 %, with strongest values exceeding ±40 % in September, February and March (±51, ±47 and ±52 %, re-spectively). Uncertainties at the annual scale are below ±5 % for advected contributions, and below ±20 % for local contri-butions for most compounds (expect ammonium and sulfate that have almost negligible annual local production).
Based on these results, it follows that the choice of the up-wind rural station does not very much affect the discus-sion of monthly advected contributions, compared to mea-surement uncertainties. However, most of local contributions show larger uncertainties (particularly local OM) that, even if they are usually associated with very low contributions, have to be taken into account in the discussion of the comparison with simulation results.
4.4 Model evaluation
The idea of the approach developed in this paper consists of evaluating separately the local and advected contributions. After interpolation of concentrations at all four sites, simu-lated contributions are derived in the same way as observed ones. We will attempt to answer the following question: is the CHIMERE model (as implemented in the ESMERALDA platform) able to correctly simulate both advected and local contributions for the main chemical constituents of PM2.5?
Comparisons between measurements and simulations will be achieved on an annual and monthly basis.
Statistical metrics used in this paper are defined as follow-ing:
2.5
Table 3. Mean absolute and relative uncertainties on observed imported and local contributions at three time scales (see text for details), and
range of uncertainties among all monthly contributions over the period.
Contribution Species Absolute (µg m
−3)and relative (%) uncertainty
Daily mean Monthly mean range Yearly mean
Advected PM2.5 4.40 44 % (0.37, 1.88) (5 %, 18 %) 0.32 3 % EC 0.30 87 % (0.04, 0.12) (11 %, 25 %) 0.02 5 % OM 2.77 69 % (0.20, 1.27) (7 %, 30 %) 0.21 5 % Ammonium 0.48 49 % (0.04, 0.33) (6 %, 21 %) 0.04 3 % Nitrate 1.15 >100 % (0.12, 0.57) (11 %, 35 %) 0.10 5 % Sulfate 0.59 43 % (0.08, 0.28) (5 %, 14 %) 0.04 2 % Local PM2.5 7.13 >100 % (0.77, 2.32) (27 %, 66 %) 0.46 11 % EC * 37 % * (4 %, 11 %) * 2 % OM * >100 % * (15 %, 93 %) * 13 % Ammonium * >100 % * (18 %, > 100 %) * 24 % Nitrate * >100 % * (16 %, > 100 %) * 17 % Sulfate * >100 % * (26 %, > 100 %) * 38 %
∗Idem than advected.
– Mean bias (MB): MB = 1 n n X i=1 (mi−oi) (3)
– Normalized mean bias (NMB):
NMB = 1 n n P i=1 (mi−oi) o (4)
– Root mean square error (RMSE):
RMSE = v u u t 1 n n X i=1 (mi−oi)2 (5)
– Normalized root mean square error (NRMSE):
NRMSE = s 1 n n P i=1 (mi−oi)2 o (6) – Correlation coefficient (R): R = n P i=1 (mi−m)(oi−o) s n P i=1 (mi−m)2 n P i=1 (oi−o)2 , (7)
where mi and oi are the modeled and observed
concentra-tions at time i, respectively, and m and o their average over the period.
5 Results
This section presents the model evaluation results. In a first part, the meteorological simulation is evaluated in the center of Paris (Sect. 5.1). A quick overview of observed pollution regimes during the whole year is presented in a second part, with annual average results from observations (Sect. 5.2). Simulation annual results are then described (Sect. 5.3), fol-lowed by a description of results for each individual main
chemical constituents of PM2.5 focussing on seasonal
vari-ations (Sects. 5.4 to 5.7). Implicvari-ations for model evaluation are finally discussed (Sect. 5.8).
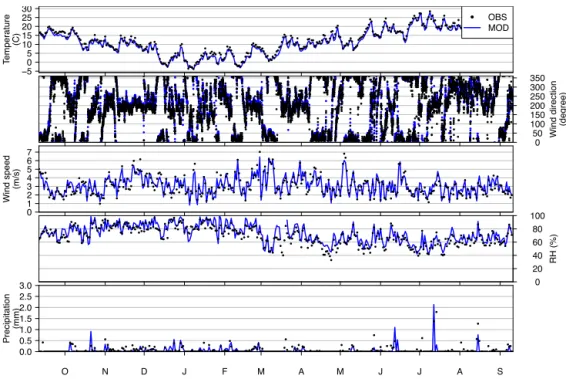
5.1 Meteorology evaluation
Current meteorological parameters – temperature, wind speed and direction, RH and precipitation – are measured in the center of Paris at the MONTSOURIS station. Figure 4 shows the comparison with MM5 simulations used in the CHIMERE CTM, statistical results are given in Table 4.
The model adequately simulates temperature and RH, with only a slight bias of −1◦C and +3.1 %, respectively, while NRMSE remains low (around 13 % for RH). According to diurnal profiles (not shown), these biases occur mainly dur-ing the night and in the morndur-ing. Wind speed also shows a very low bias (+0.1 m s−1 or +2 % in relative), but with
a stronger NRMSE around 30 %. Again, discrepancies are stronger during the night, the early morning and the early
evening. With mean discrepancies around 11.8◦, simulation
of wind direction appears to be satisfactory as well. Consid-ering the difficulty to correctly simulate precipitations, the bias in simulations (−0.02 mm or −34 % in relative) is quite good. The model is nevertheless not able to correctly catch all the events or sometimes wrongly predicts events, leading