HAL Id: hal-01134217
https://hal.archives-ouvertes.fr/hal-01134217
Submitted on 5 May 2015HAL is a multi-disciplinary open access archive for the deposit and dissemination of sci-entific research documents, whether they are pub-lished or not. The documents may come from teaching and research institutions in France or abroad, or from public or private research centers.
L’archive ouverte pluridisciplinaire HAL, est destinée au dépôt et à la diffusion de documents scientifiques de niveau recherche, publiés ou non, émanant des établissements d’enseignement et de recherche français ou étrangers, des laboratoires publics ou privés.
XPS study of Ni-base alloys oxide films formed in
primary conditions of pressurized water reactor
Loïc Marchetti, Frédéric Miserque, Stéphane Perrin, Michèle Pijolat
To cite this version:
Loïc Marchetti, Frédéric Miserque, Stéphane Perrin, Michèle Pijolat. XPS study of Ni-base alloys oxide films formed in primary conditions of pressurized water reactor. Surface and Interface Analysis, Wiley-Blackwell, 2015, 47 (5), pp.632-642. �10.1002/sia.5757�. �hal-01134217�
XPS study of Ni-base alloys oxide films formed in primary water conditions of pressurized water reactor
L. Marchettia, F. Miserqueb, S. Perrinb*, M. Pijolatc
a
CEA, DEN, DTCD, SECM, Laboratoire d’étude du Comportement à Long Terme des matériaux de conditionnement, F-30207 Bagnols-sur-Cèze, France
b
CEA, DEN, DPC, SCCME, Laboratoire d’Etude de la Corrosion Aqueuse, F-91191 Gif-sur-Yvette, France
c
Ecole Nationale Supérieure des Mines, centre SPIN, Département PRESSIC, UMR CNRS 5307-LGF, 158 Cours Fauriel, F-42023 Saint-Etienne, France
* Corresponding author: F. Miserque
CEA Saclay, DEN/DANS/DPC/SCCME, Laboratoire d'Etude de la Corrosion Aqueuse, Bâtiment 458 - PC 50, 91191 GIF sur YVETTE Cedex, France.
Tel.: +33 1 69 08 16 19; Fax: +33 1 69 08 15 86. E-mail address: frederic.miserque@cea.fr
Abstract
The oxide scales formed on alloy 690 during it exposure to PWR primary simulated media at 325 °C for different periods of time, ranging between 24 h and 858 h, have been characterized through XPS analysis. These results have been compared to the data obtained on Cr2O3,
NiCr2O4, NiFe2O4 and Ni(OH)2 reference compounds.
This comparison leads to the following conclusions about the scale formed on alloy 690: (i) the deconvolution of Cr-2p3/2 core level spectra seem to show that the internal oxide scale is made of a mix of chromite and chromia, (ii) the evolution of the height ratio between satellite and principal peaks, on the Ni-2p3/2 core level has highlighted the presence of nickel
hydroxide for all corrosion durations; and (iii) XPS analysis can be used to study the kinetics of nickel ferrite precipitation. In order to obtain a more complete description of such oxide scales based upon XPS measurements, reference data, obtained on nickel ferrites and chromites in which Fe is partially substituted to Ni, are needed.
The comparison of published data and reference spectra performed in this work also lead to conclude that core level fits are dependent on the energy resolution which can be achieved with specific spectrometer and analysis procedures. Therefore reference compound spectra need to be recorded in the very identical analytical configuration before dealing with results obtained on corroded specimen.
Keywords: nickel base alloys, PWR primary media, oxide scale, XPS, chemical states, Ni and Cr oxides reference spectra
1- Introduction
Nickel base alloys such as alloys 600 and 690 are two materials used in the manufacturing of steam generator (SG) tubes in pressurised water reactors (PWR). Under operating conditions, these tubes are corroded in the PWR primary medium, i.e. water at high temperature (about 285-325 °C) and high pressure (about 155 bar) containing boron, lithium, and dissolved
hydrogen. The oxide scale formed during this corrosion phenomenon plays a key role in two degradation processes well known by PWR operators: (i) nickel release from the material during the corrosion process and its subsequent activation into radioactive cobalt in the reactor core, thereby increasing the overall radioactivity of the primary circuit, and (ii) the initiation of stress corrosion cracking (SCC) in SG tubes which induces a decrease in SG thermal exchange efficiency.
The oxide scales formed on nickel base alloys exposed to high temperature hydrogenated water (ranging from 285 °C to 360 °C), in order to simulate corrosion phenomena in PWR primary medium, have always been described as a multilayer structure [1-17].
For very short exposure times (a few minutes) of alloy 600 at 325°C in hydrogenated water (2 mg/L Li, 1200 mg/L B, P(H2) = 0.3 bar and pH = 7.1), Machet et al. [1] describe, mainly on
the basis of X-ray Photoelectron Spectroscopy (XPS) analysis, a duplex oxide scale composed of an internal Cr2O3 layer and an external layer comprised of Ni(OH)2. These results are
consistent with those reported in Ref. [2] obtained by XPS analysis of alloy 600 exposed for 2 hours in aqueous water at 285 °C (P(H2) = 1 bar and pH = 7).
For longer exposure times (100 hours) in high purity hydrogenated water (P(H2) = 1 bar) at
360 °C, Angeliu and Was [3] studied the oxides formed on model alloys, with compositions close to those of alloys 600 and 690, by XPS and Transmission Electron Microscopy (TEM). They reported the same type of duplex oxide scale: Ni(OH)2 surmounting Cr2O3. For the same
exposure duration of alloy 600 in hydrogenated water at 325 °C (2 mg/L Li, 1200 mg/L B, P(H2) = 0.3 bar and pH = 7.1), Machet et al. [4] also observed, through XPS analysis, this
same type of oxide scale.
However, in an earlier paper, Machet et al. [5] studied, using Scanning Electron Microscopy (SEM) and XPS techniques, the oxide scale formed on alloy 600 in the same conditions for exposure times ranging from 50 to 400 hours. They observed, (i) an outer layer composed of well-defined octahedral crystals rich in Fe, and (ii) an inner layer rich in chromium in which NCr/NNi ratio is close to 2, which is in good agreement with the presence of NiCr2O4.
These last results are much more consistent with the results published by Carrette et al. [6-7], who have exposed alloy 690 to high temperature (325 °C) hydrogenated water (2 ppm Li, 1000 ppm B, P(H2) ≈ 0.2 bar and pH = 7.3) for durations ranging between 24 and 2160 hours.
The oxidized samples were studied employing a set of characterisation techniques including SEM, TEM, XPS, Secondary Ion Mass Spectrometry (SIMS) and Grazing Incidence X-Ray Diffraction (GIXRD). The external oxide layer is described as being comprised of hydroxide and NiFe2O4 or NiCr2O4, depending on media saturation, while the internal oxide seems to be
Cr2O3.
Others results obtained, by SEM, TEM, GIXRD and SIMS mainly, on alloys 600 [8-10] or 690
[8-9]
exposed to hydrogenated water at 360 °C (2 ppm Li, 1200 or 1000 ppm B and P(H2) = 0.3
or 0.17 bar respectively in Ref. [8, 10] or [9]) dealt with an external scale made of Fe and Ni rich spinel oxide and an internal oxide rich in Cr. These last papers are in good agreement with the description made by Carrette et al. [6-7].
It is clear, from the presented literature review, that the nature of the passive film formed on nickel-base alloys in PWR primary simulated media is still a controversial subject and must be further studied using a combination of characterisation techniques in order to obtain a satisfactory description.
In previous papers [11-13], we investigated the structure of the oxide layers formed on nickel-based alloys (alloys 600 and 690) in PWR primary medium by SEM and TEM [11-12] as well as by photoelectrochemical techniques (PEC) [13]. These studies have led us to propose an oxide layer divided into two major parts: an external layer composed of nickel ferrite (Ni
(1-z)Fe(2+z)O4) and nickel hydroxide, formed by precipitation phenomena [12] and an internal layer
mainly composed of a continuous spinel of a mixed iron and nickel chromite (Ni (1-x)FexCr2O4). Furthermore, nodules of Cr2O3, with a size about 5 nm, were uniformly
distributed at the interface between this internal spinel layer and the alloy. A scheme of this proposed scale is presented in figure 1.
In PWR primary conditions, the thickness of the internal scale varies from one nanometer to several tens of nanometers depending on the experimental conditions (surface state,
duration…) [4-5, 14-15]. In this range of thicknesses, XPS seems to be a promising way to improve the description of this oxide scale.
Nevertheless, it must be remembered that in this type of system, i.e. a mixture of different Fe, Ni and Cr oxides, the interpretation of the shape of XPS spectra, in terms of chemical state, is complicated, notably by (i) the emergence of “shake-up” satellite peaks superimposed to the primary structure of the Ni-2p core levels [18-20] and (ii) the existence of a multiplet structure on the Cr-2p core levels [21-22]. Indeed, after the photoemission of a core electron, there is a finite probability that the ion would be left in an excited state. In the case of transition metals (and notably for nickel), this excited state correspond to an electronic transition toward the unfilled 3d shell. When the ion is left in this state, the kinetic energy of the photoelectron is reduced by the energy needed for this electronic transition, which leads to the emergence of a “shake-up” satellite at a binding energy higher than the main peak. Multiplet splitting is the consequence of interactions between the core electron hole resulting from the photoemission process (on the 2p level in the case of first row transition metals), and the unpaired electrons in the 3d shell. These interactions can create a number of final states which can emerge on the photoelectron spectrum. Moreover, for conductive metals as Cr or Ni, there is an enhanced probability that the emitted photoelectron loses kinetic energy by interaction with conduction electrons. These losses are weak and result in an asymmetry of the main peak toward high binding energy values.
In this context, the aim of this paper is, first, to study the structure of XPS spectra performed on reference compounds of Ni and Cr oxide or hydroxide and to compare the obtained results with literature data. Then, XPS analysis will be performed on the alloy 690 samples that have been exposed to PWR primary simulated medium; these samples have been previously analyzed by TEM and PEC [11-13]. Lastly, XPS results obtained on these samples will be discussed in the light of (i) those performed on reference compounds and (ii) samples characterizations previously performed.
2- Materials and methods 2-1- References compounds
Five reference compounds have been analyzed by XPS: Ni0, Ni(OH)2, Cr2O3, NiFe2O4 and
NiCr2O4.
The NiFe2O4 and NiCr2O4 powders used as reference samples were >99% pure and were
respectively supplied by Alfa Aesar and IoLiTec GmbH. These powders were characterized by XRD and correspond respectively with JCPDS files #10-0325 and #1-075-1728 (not shown).
In order to make the Cr2O3 reference sample, a chromium plate supplied by Goodfellow
(99.99% in purity) was used. The sample, in the form of 1 mm thick sheets, was mirror-polished with SiC paper up to grade 1200, diamond paste up to 1 µm and alumina gel finished.
This sample was then oxidized for 6 hours at 900 °C under a 1 bar Ar-20%O2 mixed
atmosphere. The scale was analysed by GIXRD (not shown here) and identified as Cr2O3
(JCPDS file #38-1479).
A nickel sheet supplied by Goodfellow, 99.999 % in purity, was used to prepare de Ni0 and Ni(OH)2 reference samples. Plate samples, 1 mm thick, were mirror-polished with SiC paper
up to grade 1200, diamond paste up to 1 µm, and alumina gel finished.
In order to make Ni0 reference spectra, this type of sample is introduced in the spectrometer and in situ cleaned by Ar+ sputtering prior to XPS analysis in order to remove the native oxide layer and any surface contamination.
For the preparation of a Ni(OH)2 reference sample, a nickel sheet was used as a working
electrode in a classical three-electrode electrochemical cell. The reference electrode was a saturated calomel electrode and the counter-electrode was a platinum grid. The electrolyte was a nickel sulphate aqueous solution (0.1 mol.L−1) containing sodium hydroxide
adjunction (pH = 12). This solution was maintained under an atmosphere of 1 bar O2 at 90
°C. The open circuit potential was measured to -200 mV/SCE and the working electrode was then anodically polarized at -100 mV/SCE for 24 hours. Under these conditions the stable solid phase, β-Ni(OH)2[23], is expected to grow at the surface of the working electrode. This
reference sample was only analysed by XPS because of the thinness of the grown oxide scale and the obtained results were compared to literature data.
2-2- Corrosion tests performed in PWR primary simulated medium
The Ni base alloy used in this study is the alloy 690. Its composition is given in table 1. Coupons (30 × 20 × 2.5 mm) were mechanically mirror-polished with SiC paper up to grade 1200, diamond paste up to 1 µm and alumina gel finished. Specimens were rinsed in an ethanol-acetone binary mixture in ultrasonic bath and dried.
Seven corrosion durations were investigated (24 h, 48 h, 66 h, 164 h, 304 h, 406 h and 858 h). All corrosion experiments were performed at 325 °C, under 155 bar in a recirculation autoclave with a flow rate of 17 L.h-1. This testing device has previously been detailed in Ref. [12]. The aqueous solution contained 2 ppm lithium (LiOH) and 1000 ppm boron (H3BO3) in equilibrium with a hydrogen overpressure of 0.29 ± 0.02 bar. This overpressure
ensures a dissolved H2 concentration of 1.3 10-3 mol.L-1 at 325 °C (corresponding to a molar
fraction of 3.4 10-5) and a low oxygen content (O2 < 10 ppb).
The recirculation loop used in this work is equipped with ion-exchange resins. The aim of this device is to maintain the concentration of metallic cations in the liquid phase as low as possible to avoid precipitation. Their efficiency is much dependent on the temperature. Optimizations have led to their use at 20 °C. However, experiments with two durations (164 h and 858 h) were carried out under so-called “damaged conditions”, i.e. at 32 °C,
temperature for which the ion-exchange resins efficiency was lower.
Two SEM have been used for the observation of the oxide scales: a LEO 1450VP and a Karl Zeiss 1525 equipped with a Field Emission Gun (FEG).
XPS analyses on reference compounds and corroded samples were carried out with
Thermofisher Escalab 220i XL and 250 XI using a monochromatic Al Kα source (10 mA, 20 kV). Due to an important charge effect the powder reference samples were analysed using a charge compensation flood gun. The instrument was calibrated to the silver Fermi level (0 eV) and to the 3d5/2 core level of metallic silver (368.3 eV). The C-1s signal for adventitious carbon was used to correct the charge effect. The C-C/C-H component of C-1s spectra was fixed at 285.0 eV. The analysis zone was ~ 1×1 mm2 for the monochromatic source. The pass energy for overview and high resolution spectra was 100 eV and 20 eV, respectively. The data processing was performed using the commercial Avantage software. For the fitting procedure, a Shirley background has been used and Lorentzian-Gaussian (L/G) ratio was fixed at 30 %.
3- Results and discussion
The data collected in the literature on the Cr-2p3/2, Ni-2p3/2 and O-1s core levels, as well as the results obtained by analyzing the same core levels on reference compounds or corroded samples are presented in this section in order to identify the chemical state of Cr, Ni and O in the oxide scale formed. The chemical state of Fe, also present in the oxide, was not
investigated, neither on its 2p3/2 core level because of the overlapping of nickel Auger peaks due to acquisition conditions, nor on its 2p1/2 core level because of the lack of published data. Nevertheless, the acquisitions of the 2p1/2 core level of Fe have been used in order to compare (i) the relative intensities of Fe on XPS spectra to (ii) precipitation phenomena observed by SEM for different exposure durations (see subsection 3-2-2).
3-1- Comparison between literature data and XPS analyses performed on reference compounds for the identification of chemical state on Ni-2p3/2, Cr-2p3/2 and O-1s core levels
Besides the binding energy (BE), many different parameters have been used for the analysis of XPS spectra in order to differentiate two compounds. These parameters include, but are not limited to: (i) mathematical parameters defining an asymmetric peak, (ii) the full width at half maximum (FWHM) of a peak, and (iii) the peak intensity ratios observed on the same core level, expressed as the part of one peak in the total area of a core level envelope or the height ratio between two peaks.
In this section, the comparison of reported data is limited to binding energies and peak intensity ratios because the FWHM values strongly depend of the spectrometer and
implemented acquisition conditions. However, when asymmetric peaks were used in order to fit XPS spectra, particularly in the case of the metallic Ni or Cr core levels, this factor is mentioned even if the peak shape parameters published were not reported.
Moreover, for all peak positions reported in the literature and discussed below, the C-C/C-H component of C-1s spectra was fixed at 285.0 eV when this datum is mentioned in the cited article. When it is not the case, this is clearly noticed in the text.
3-1-1- Identification of the chemical state on the Ni-2p3/2 core level for different nickel compounds
The study of chemical state on the Ni-2p3/2 core level is difficult because of the emergence of satellite peaks superimposed on the primary structure of the spectra [1, 18-20]. The use of multiplet structures for assignment of Ni-2p spectral profiles has also been reported, particularly in the case of nickel oxide or hydroxide [20, 24-25].
In order to compare with literature data discussed more in details below, Ni-2p3/2 core level spectra recorded in this work on various reference compounds are shown in figure 2.
From Refs. [20, 24-25], the spectra of metallic nickel can be fitted using 3 peaks: a main asymmetric peak at 852.6 eV which represents roughly 80 % of the total area of the core level, and two broader satellites peaks with BE near 3.7 eV and 6.1 eV above the main contribution, respectively for the minor (less than 7 % of the total area of the core level) and the major (ranging between 12 to 15 % of the total area) ones.
The spectrum obtained here for metallic Ni is shown in figure 2(a). The Ni-2p3/2 main peak (BE at 852.6 eV) highlights an asymmetry on the high binding energy side and is linked to a shake-up satellite peak (6.3 eV above the main contribution). The fitting parameters found on this spectra (BE, asymmetry of the main peak, intensity ratio between the main and the satellite peaks) are consistent with literature data. Nevertheless, only the satellite peak found at roughly 6 eV above the main peak component has been used in the fitting procedure. It can be pointed out that depending on the parameters used to fit the asymmetric main peak, the minor satellite reported in literature can be covered by the main contribution.
The spectra of NiO can be fitted using a multiplet structure of five peaks. The two highest peaks with regards to BE (i.e. 864.2 and 866.5 eV) each represent less than 4 % of the total area of the core level [24-25]. Regarding the three main contributions, they peaked at 853.9 eV, 855.6 eV and 861.1 eV. Furthermore, by considering only the spectrum envelope of the 2p3/2 core level, the 853.9 eV and 855.6 eV peaks form a doublet of peaks, with two identifiable maxima, on spectra reported in Refs. [20, 24] which seems to be characteristic of the presence of NiO.
Considering (i) this distinctive characteristic and (ii) that NiO growth on nickel base alloys exposed to primary water is not expected at the concentration of dissolved hydrogen studied in this work, no reference compound of this oxide was analyzed.
As for NiO, the Ni-2p3/2 core level of NiFe2O4 have been fitted with a multiplet structure of
five peaks [25]: two minor peaks at 864.9 eV and 867.2 eV (less than 4% of the total area of the envelope for each one) and three main ones, which peaked at 854.7 eV, 856.2 eV and 861.6 eV. By comparison with the case of NiO, the three main peaks are shifted toward higher BE and the envelope of the core level published by Biesinger et al. [25] for NiFe2O4 exhibit a
partial superimposition of the peak components at 854.7 eV and 856.2 eV leading to a shoulder toward high energies on the spectrum, instead of the NiO doublet of peaks. It can be interesting to note that in 1975, McIntyre and Cook [18] published a less accurate spectrum for the Ni-2p3/2 core level of NiFe2O4 which exhibits only two peaks: a principal
contribution at 855.3 eV and a satellite band at higher BE (evaluated at roughly 862 eV on the basis of the published spectrum, but this last value is not reported in the original article). It can then be supposed that the satellite component identified in Ref. [18] matches with the broad one reported at 861.6 eV in Ref. [25]. In the same way, the main contribution reported in Ref. [18] (855.3 eV) can correspond to the two partially superimposed ones (respectively at 854.7 eV and 856.2 eV) identified by Biesinger et al. [25]. This last remark should explain why spectra obtained on a same compound can be fitted with more or less peaks in the literature, depending, in this case, on the energy resolution associated with the spectra acquisition.
With our energy resolution, five peaks can be distinguished on the Ni-2p3/2 core level recorded on the NiFe2O4 reference compound (figure 2(b)): (i) two partially superimposed
one at 855.3 eV and 856.8 eV resulting in a shoulder toward high energies on the envelope, (ii) a broader shake-up satellite peak at 862.0 eV and (iii) two minor contributions at 865.7 eV and 868.0 eV respectively. These results are in overall good agreement with the literature data mentioned above.
The methods of deconvolution reported in literature concerning the fit of NiCr2O4 spectra also
differ in the many published works. In Refs. [26-27], the Ni-2p3/2 core level of this oxide is fitted with two peaks: a main contribution which peaked in the 856-856.5 eV range (note that in these two articles, the BE of the C-C/C-H component of C 1s spectra is not reported) and a satellite one between 5.1 eV and 5.35 eV above the principal peak. These articles also
reported the height ratio of the satellite to principal peaks, which ranges from 0.71 to 0.74. For the same compound, Biesinger et al. [25] propose a fit using a multiplet structure of six peaks, with three minor contributions at 854 eV, 861.2 eV and 866.2 eV (respectively 7 %, 2.3 % and 6.1 % of the total area of the core level) and three main peaks: (i) two at 856.0 eV and 856.7 eV which are highly superimposed and seem to correspond to the principal peak reported in Refs. [26-27] and (ii) one at 861.5 eV which could correspond to the satellite peak reported by the last authors.
Furthermore, on the spectrum published by Biesinger et al. [25], two features of the envelope could be useful in order to distinguish between NiCr2O4 and other Ni oxides: the partial
superimposition of the 854 eV and 856 eV peaks lead to a shoulder toward low energies on the spectrum, whereas the minor contribution at 866.2 eV is well separated to the one at 861.5 eV and produce a slight but clearly observable peak at higher energy values.
The figure 2(c) shows the Ni-2p3/2 core level recorded on NiCr2O4 reference powder. The
proposed curve fitting method uses only four contributions, rather than the six peaks proposed by Biesinger et al. [25]: two main peak components located at 856.4 eV and 861.7 eV
(corresponding respectively to the main peak and the major shake-up satellite) and two minor ones at 854.2 eV and 866.3 eV in BE. This fitting procedure seems to adequately reproduce the two characteristic features of a NiCr2O4 envelope spectrum: (i) a shoulder toward low
energies on the main peak and (ii) a slight second shake-up satellite above 866 eV. It can also be noted that the height ratio of the major satellite to the main peak measured in this work (0.65) is consistent with those reported in Refs. [26-27].
For Ni(OH)2, Machet [28] reported a deconvolution with two peaks: the main one at BE
ranging from 855.7 eV to 857.4 eV and the satellite peak always 5.8 eV above. It is
interesting to note the value of the height ratio of the satellite to principal peaks reported in this work (0.3).
Mansour and Melendres [29-31] have also reported a deconvolution with two peaks for the
Ni-2p3/2 core level of Ni(OH)2,yH2O, in which the principal component varying between 855.5
eV and 856.2 eV whereas the satellite one ranging from 861.2 eV to 861.8 eV, depending on the hydration state y of the hydroxide.
Moreover, a finer deconvolution have also been proposed, taking into account multiplet splitting on the Ni-2p3/2 core level [24-25] in order to fit the Ni(OH)2 spectrum. This fit is made
of six peaks: four minor peaks at 855.1 eV, 857.9 eV, 860.7 eV and 866.7 eV (each representing less than 7% of the total area of the envelope) and two major contributions exhibiting BE of 855.9 eV and 861.7 eV which could respectively correspond to the principal and satellites peaks in the deconvolution using only two peaks reported above.
A two component deconvolution procedure has been used for fitting the Ni-2p3/2 core level spectra recorded on the Ni(OH)2 layer (figure 2(d)). The major peak is found at a BE value of
856.2 eV whereas a shake-up satellite appears 5.9 eV above. The height ratio of the satellite to the main peak is equal to 0.28 and well agrees with the value reported in Ref [28].
In order to summarize, rather than to deal with a challenging complete multi-component curve fitting, the interpretation of the 2p3/2 core levels of reference Ni compounds and it comparison with existing literature data allows us to emphasize a few key deconvolution parameters or spectral features that can be used in order to identify various Ni chemical states in a mixed oxide scale.
Although the BE values of the main peak cannot be used to distinguish Ni(OH)2 from
NiCr2O4 because they are too close, this parameter allows for the differentiation between
metallic Ni, NiFe2O4,and the two compounds mentioned above (figure 2).
In order to distinguish between Ni(OH)2 and NiCr2O4 or a mix of these compounds, the height
ratio of the major satellite to the main contribution may be useful; this parameter is very different for these two species (roughly 0.3 and 0.7 for Ni(OH)2 and NiCr2O4 respectively). In
addition, the presence of a weaker satellite peak around 866.3 eV may also indicate the presence of NiCr2O4.
3-1-2- Identification of the chemical state on the Cr-2p3/2 core level for different chromium compounds
The spectra of metallic chromium can be fitted using an asymmetric peak with a BE value of 574.4 eV or 574.5 eV according to works published by Biesinger et al. [25] or Halada and Clayton [32].
From Refs. [22, 25], the Cr-2p3/2 core level of Cr(OH)3 can also be fitted with a single but
symmetric peak, ranging from 577.3 eV to 577.6 eV depending on the hydration state of the compound.
The case of Cr2O3 deconvolution is more controversial. Some works exhibit a single and
asymmetric peak with a BE value between 576.3 and 576.7 eV [32-33], whereas other studies use a multiplet structure, involving 3 to 5 peaks, in order to fit the Cr-2p3/2 core level of this oxide [21-22, 25].
For NiCr2O4, Sloczynski et al. [27] propose a deconvolution using a single peak at 576.7 eV
(note that the BE of C-1s peak component for the adventitious is not reported in this article), whereas Biesinger et al. [22, 25], like for Cr2O3 or FeCr2O4, fit their spectra by considering
multiplet splitting.
For the purpose of this study (i.e. to use XPS in order to better identify the different oxides composing the multilayered scale formed during the corrosion of nickel-base alloys in PWR primary medium), it is interesting to compare the Cr-2p3/2 spectral fitting parameters
published in Ref. [25] for Cr2O3, NiCr2O4 and FeCr2O4, especially because they have been
obtained in the same analytical configuration. It can be seen in table 2, that multiplet structure of 4 or 5 peaks has been used to deconvolve the spectra envelope of these oxides. It can be pointed out that the comparison of these deconvolutions for the three oxides mentioned above only exhibit slight differences in BE and associated contributions to the total area of the
Cr-2p3/2 core level. It can also be seen that the fit of FeCr2O4 spectra does not involve a fifth
peak, in contrast to those of Cr2O3 and NiCr2O4; for this last two oxides the fifth peak is only
a minor contribution which need a high resolution acquisition to be evidenced. Although these data may be used in order to differentiate between the XPS spectra recorded on chromium
sesquioxide and nickel or iron chromite, it can be difficult, depending on the energy
resolution achieved, to identify each compound in a mixture of these corrosion products when basing analysis uniquely upon the Cr-2p3/2 core level.
The comparison of curve fitting of Cr2O3 and NiCr2O4 Cr-2p3/2 core level spectra recorded on reference compounds is shown in figure 3. Even if theoretical modeling of Gupta and Sen
[34-35]
predicts a larger number of final states constituting the multiplet splitting structure, the energy resolution, in this work, does not allow the separation of all these final states. The choice of the peak number used to fit the envelope should be coherent with its shape. It is for this reason that in this work the most simplified curve fitting method has been chosen. In order to represent the asymmetrical broad peak shape of multiplet split Cr(III) species,
evidenced in figure 3, a minimum of 3 peaks is needed to fit the resolved envelope shape. The comparisons of (i) the BE values, (ii) the shape of the envelopes, as well as (iii) the area ratios between the 3 peaks seen in figures 3 (a) and (b) for Cr2O3 and NiCr2O4 respectively, leads to
the conclusion that Ipeak1/Ipeak2 is the unique fitting parameters of Cr-2p3/2 that allow a separation of these two oxides by XPS analysis, with the energy resolution achieved in this work. However, in the case of a mixture of these compounds, and particularly for samples corroded in PWR primary media (for which carbon contamination and/or water adsorption are expected to be higher than in the case of reference compounds), it can be difficult to achieve a clear separation of these two oxides.
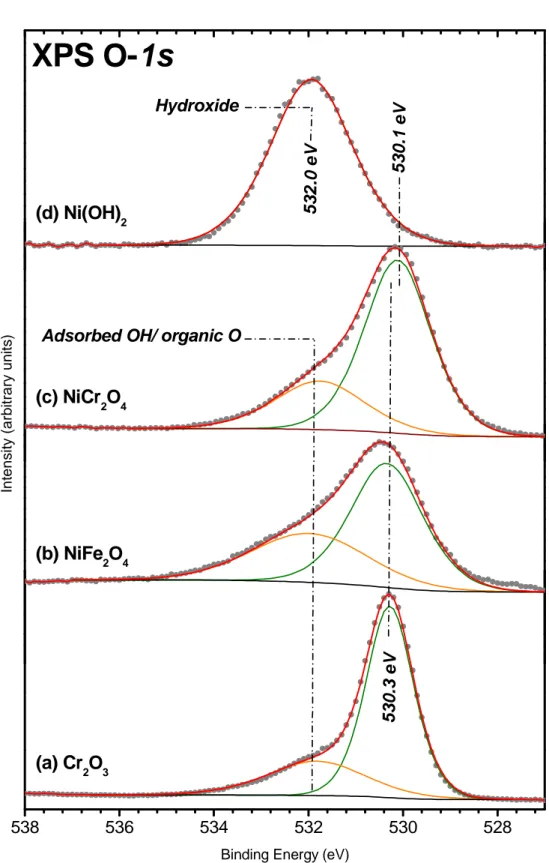
3-1-3- Identification of the chemical state on the O-1s core level for Ni and/or Cr oxides and hydroxides
Except in the case of NiO, for which a minor peak component (2 % of the total area of the
O-1s core level) was identified at 533 eV and attributed to absorbed O2 or H2O [24-25]; whatever
the data considered for the deconvolution of the O-1s core level of Ni and/or Cr oxides, at most two peaks were used for fitting. The main [22, 24-25] or single [18, 27] contribution peak in the 529.5-530.4 eV range is attributed to lattice oxygen. The second peak reported by Biesinger et al. [22, 24-25] shows a BE value in the 531.1-532.1 eV range and was attributed by these authors to defective sites within the oxide crystal whereas other works dealt with hydroxide species [36]. It could be pointed out that for all Ni and/or Cr oxides considered, the contribution of this second peak to the total area of the O-1s core level ranges between 20 % and 40 %.
The O-1s core level spectra for Cr2O3,NiFe2O4 and NiCr2O4 obtained on reference oxides are
presented in Figure 4(a), (b) and (c) respectively. As observed in literature data, a major contribution is found at a binding energy of around 530 eV for the various oxides. A second contribution at higher binding energies side is also present (at 532.0 eV). This contribution is attributed to adsorbed OH [37] or organic oxygen due to contamination.
The spectra obtained on Ni hydroxide can also be deconvolved with two peaks: a main [30] or single [18, 24-25, 29] contribution with a BE ranging from 531.0 eV to 531.2 eV is attributed to hydroxide ions whereas the appearance of a minor component, peaking at 532.4 eV [30] and attributed to H2O, depends on the hydration state of the compound.
It is also the case for Cr(OH)3, for which a main peak is evidenced in the 531.4-531.9 eV
range and a minor one (exhibited BE varying from 532.8 eV to 533.6 eV) is attributed to hydration [22, 25].
The O-1s spectra (Fig. 4(d)) for Ni(OH)2 reference compound is fitted, in this work, using a
single contribution at 532.0 eV which enables the separation on O-1s core level between lattice oxide and hydroxide.
Even if the main peak component on O-1s core level could allow for the differentiation between oxides and hydroxides when analysed separately, in the case of a mixture of
corrosion products, the overlap between the hydroxide peak and the second peak of the oxides makes it very difficult to differentiate one compound from another. In this last case, in order to help with the identification of these products, the intensity ratio between these two peak components, as well as the appearance of a third contribution at higher BE (due to the
hydration of hydroxides) could bring informations concerning a possible compounds mixing.
As it can be seen in subsections 3-1-1, 3-1-2 and 3-1-3, a lot of spectral fitting parameters can be used for the study of the chemical shifts on XPS spectra recorded on Ni and/or Cr oxides and hydroxides. Even if the published data discussed above exhibit some of these parameters which seem to be relevant in order to distinguish between considered compounds, the
diversity of parameters reported could lead to confusing issues when a mixture of corrosion products is analyzed. Moreover, the comparison of data collected in the literature and
reference spectra performed in this work seems to evidence that core level fits are dependent, in a particular study, on the energy resolution which can be achieved with specific
spectrometer and analysis procedures. That is why, before dealing with results obtained on corroded samples, the acquisition of reference compound spectra performed in the same analytical configuration is needed.
3-2- Application to alloy 690 corroded in PWR primary conditions
The XPS analysis of the oxide scale formed on alloy 690 corroded in PWR primary simulated water have been led for all exposition durations investigated (24 h, 48 h, 66 h, 164 h, 304 h, 406 h and 858 h). Through XPS spectrum deconvolutions, it has been found that the set of corrosion durations can be separated into three classes; one duration from each class will be further discussed in detail. The results obtained for three characteristic exposure durations (24 h, 164 h and 858 h) on the Cr-2p3/2, Ni-2p3/2 and O-1s core level spectra are presented in subsection 3-2-1. In the subsection 3-2-2, which deals with the interest of XPS analysis for studying nickel ferrite precipitation phenomena, some results obtained on Ni-2p3/2 and Fe-2p1/2 core levels are discussed for the entire set of exposure times.
3-2-1- Evolution of the oxide scale when increasing the exposition time
The figures 5, 6 and 7 show respectively the evolution of Cr-2p3/2, Ni-2p3/2 and O-1s core level spectra of alloy 690 samples, before exposure and with increasing immersion duration in PWR primary simulated medium.
The Cr-2p3/2 and Ni-2p3/2 core level spectra recorded on the surface of alloy 690 samples before immersion are reported in figures 5(a) and 6(a). They exhibit respectively high Cr0 and Ni0 contributions, which is consistent with the thinness of the native oxide film (roughly 2 nm from Ref. [15]). Moreover, the shape of the Ni-2p3/2 core level, characterized on figure 6(a) by a sharp and asymmetric peak linked to a satellite structure (6 eV above the main peak) is typical of metallic nickel, indicating that this element is excluded from the native oxide layer. It can also be noted that the Cr-2p3/2 core level spectrum recorded on this sample needs to add a multiplet structure (at higher BE) to the Cr0 component in order to fit the shape of the envelope. This result indicates that the native scale is made of chromium oxide and excludes or limits the presence of chromium hydroxide at very low level (see subsection 3-1-2). As the chemical state of Fe was not investigated in details, the presence of this element in the native oxide film cannot be excluded.
The O-1s spectrum presented on figure 7(a) exhibits 3 contributions: (i) one peak component near 530 eV corresponding to oxygen in the oxide lattice, (ii) a minor one at roughly 533.4 eV which is the consequence of water contamination and (iii) the most intense one near 532 eV, despite the absence of hydroxide compounds. This last observation highlights the weight of absorbed OH or organic oxygen, due to contamination, in the O-1s core level balance, in the case of thin (i. e. few nanometers) oxide film analysis.
Figures 5(b) to 5(d) summarize the evolution of Cr-2p3/2 core level spectra recorded on corroded alloy 690 with increasing immersion duration. According to the decrease of the Cr0 peak intensity, the thickness of the oxide scale increased with time. On the basis of literature data and reference spectra discussed in subsection 3-1-2, the curve fitting parameters used to interpret Cr-2p3/2 core level presented on figure 5 (and particularly Ipeak1 to Ipeak2 area ratios,
which range between 0.56 and 0.62) suggest that the oxide scale is composed of a mix of chromite and chromia.
The general evolution of Ni-2p3/2 core level spectra presented on figures 6(b) to 6(d) corroborate the growth of the oxide scale thickness deduced from figure 5: with increasing immersion time, the signal due to Ni containing oxides and/or hydroxides increases in intensity replacing the one due to metallic nickel.
After 24 h of exposure to PWR primary conditions, in addition to the metallic contribution, a second main peak at 856.2 eV linked to a satellite structure (peaking at 861.8 eV) can be evidenced. Considering the values of BE discussed in subsection 3-1-1, these two peaks seem to exclude the presence of nickel ferrite and can be attributed to the formation of nickel hydroxide and/or nickel chromite. Considering the measured height ratio of the satellite to principal peaks, it appears that those components cannot be assigned to the growth of Ni(OH)2
only. Indeed, the measure of this ratio is equal to 0.35 which is an intermediate value between those found for NiCr2O4 and Ni(OH)2 reference compounds (0.65 and 0.28 respectively),
corroborating the coexistence of these two nickel-containing products on the corroded alloy surface. Moreover, this value is closer to the height ratio obtained from Ni(OH)2 than those
measured on NiCr2O4. This could be a consequence of the Ni hydroxide preponderance in the
mixture of corrosion products and therefore might explain why the minor peaks (peaking at 854.3 eV and 866.3 eV), emphasized by the NiCr2O4 reference spectra, are not evidenced on
figure 6(b).
From the corresponding O-1s core level spectrum reported on figure 7(b), the large predominance of the contribution located around 532 eV may be equally related to a main formation of Ni hydroxide compared to chromite but is also, at least partially, due to the balance between the contamination and the thinness of the oxide layer, as emphasized in the case of the initial surface state. It can be added that the Ni(OH)2 seems not to be hydrated: no
contribution of water is noticed on the O-1s spectrum.
In order to fit the Ni-2p3/2 core level spectrum obtained on alloy 690 samples after 164 h of immersion, a supplementary contribution is needed, as it can be seen on figure 6(c), compared to the case of samples immerged 24 h (figure 6(b)). This contribution emerges at a BE of 855.0 eV, close to the main peak component reported for the NiFe2O4 reference compound in
subsection 3-1-1 and corresponding probably to the appearance of nickel ferrite. As it is discussed more in details in subsection 3-2-2, this conclusion is consistent with the
monitoring of the recirculation loop, during this corrosion test, under “damaged conditions” (see subsection 2-2-2 for details) leading to a decrease of ion-exchange resins efficiency.
The value of the height ratio of the satellite to principal peak (0.39 on figure 6(c)) seems to be also in agreement with the presence of nickel ferrite. As reported previously in subsection 3-1-1, NiFe2O4, NiCr2O4 and Ni(OH)2 present their major satellite structure at roughly the same
BE. The overlapping of these shake-up structures make them undistinguishable in the case of a mixture of these compounds but lead to variations of the satellite to principal peak height ratio, depending of compounds proportions in the mixture.
Considering the increase of this height ratio compared to the case of 24 h immersion, it can be concluded that the balance of oxide species increase at the expense of nickel hydroxide, but the respective roles of the chromite growth and the ferrite precipitation on this rise cannot be distinguished.
The increased oxide proportion in the scale of corrosion products formed on alloy 690 after 164 h of immersion, compared to the case of 24 h exposure test, is corroborated by the
respective evolution of the balance between the lattice oxide and the hydroxide contributions, highlighted by the comparison of O-1s core level spectra reported on figures 7(b) and (c).
For the alloy 690 samples corroded during 858 h, metallic contributions are no more observed on the Cr-2p3/2 and Ni-2p3/2 spectra (see figures 5(d) and 6(d) respectively): the oxide layer is thicker than the depth analyzed by XPS. The peak shape of the Ni-2p3/2 spectrum is quite similar with the one reported on figure 2(c) for the NiFe2O4 reference compound. This last
point is in good agreement with SEM observations reported in figure 8 and discussed in subsection 3-2-2, which bring out a large increase of both the number of nickel ferrite crystallites per surface unit and the crystallite size, for this corrosion test.
Nevertheless, samples exposed 858 h to PWR primary simulated media have been well characterized by TEM in a previous study [12]. It has been showed that the oxide scale is at least composed of 3 oxides: nickel ferrite, iron and nickel mixed chromite and discontinuous nodules of chromia along the oxide/alloy interface. As metallic contributions are not
evidenced on figures 5(d) and 6(d), it can be supposed that chromia is too deep in the oxide scale to be measured by XPS, leading to the conclusion that the contribution of the oxidized chromium emphasized on figure 5(d) is due to the presence of chromite in the oxide scale. Therefore, the peak at 856.3 eV on the Ni-2p3/2 core level (figure 6(d)) seems to be also partially due to the presence of chromite. The height ratio of the satellite to the 856.3 eV peak is equal to 0.61, which is close to the value reported for NiCr2O4 in subsection 3-1-1, but not
high enough to exclude the presence of nickel hydroxide from the corrosion products layer. Even if the contribution of lattice oxide is the main one, the appearance of two minor peak components at roughly 531.5 eV and 533.5 eV on the O-1s core level spectrum (figure 7(d)) may be in agreement with the presence of hydrated nickel hydroxide but could be also the consequence of the sample contamination.
The comparison of core level spectra recorded on alloy 690 corroded samples to reference data discussed in subsection 3-1 leads to several remarks. The deconvolution of Cr-2p3/2 core level spectra seem to show that the internal oxide scale growing on alloy 690 exposed to PWR primary simulated medium is made of a mix of chromite and chromia.
Moreover, the interpretation of Ni-2p3/2 spectra highlights some key points about the external oxide layer. The height ratio between satellite and principal peaks on the Ni-2p3/2 core level seems to be useful in order to characterize a mix of nickel-containing corrosion products. In this study, this parameter allows evidencing the presence of nickel hydroxide whatever the corrosion duration, while previous works led by TEM [12] or PEC [13], on the same samples, have not permitted to obtain this result. The presence of this hydroxide in the external layer seems to be also corroborated by the deconvolution of O-1s spectra.
The fit of the Ni-2p3/2 core level seems to permit equally the highlighting of nickel ferrite precipitation.
Nevertheless, a slight difference in the principal peak BE is evidenced between the case of corrosion products formed on alloy 690 and the NiFe2O4 reference spectrum (855.0 eV and
855.3 eV respectively). As discussed above, the minor peaks emphasized on NiCr2O4
reference spectra are also not yet evidenced on spectra recorded on oxidized alloy 690 samples. These could be some consequences of the difference in composition between reference compounds and the ferrite and chromite effectively formed on alloy 690, in which Fe is partially substituted to Ni [11-13]. To clarify this point, the effect of Ni substitution by Fe on the shape of Ni-2p3/2 core level need to be investigated on reference compounds of Ni (1-z)Fe(2+z)O4 and Ni(1-x)FexCr2O4, for different z and x values. The lack of such reference data
does not allow at the present time any more accurate deconvolution of Ni-2p3/2 core level spectra, in the case of corrosion products formed on alloy 690 exposed to PWR primary media.
3-2-2- Evidencing of the precipitation of nickel ferrite by XPS
The precipitation of nickel ferrite during the corrosion process of the alloy 690 in PWR primary environment lead to the formation of well-defined octahedral crystals, which can be easily evidenced by SEM observations [5-7, 12]. Nevertheless, XPS can be useful in order to study the kinetics of this precipitation, because it allows for a mean quantification, although relative, at a scale (roughly 1 mm2) which is consistent with the description of generalized corrosion phenomena. The aim of this subsection is to verify if variations in the 855.0 eV peak intensity (observed on the Ni-2p3/2 core level of alloy 690 corroded samples) can be correlated with those of the nickel ferrite quantity.
SEM observations carried out on alloy 690 samples exposed to PWR primary medium for different durations are reported in figure 8. Optimal working conditions of the ion-exchange resins during corrosion tests (see subsection 2-2-2) result in the presence of only few
crystallites of nickel ferrite on the surface of samples, as seen on micrographs recorded after 24 h and 406 h exposures (figures 8(a) and 8(b)).When the recirculation loop is monitoring under “damaged conditions”, figures 8(c) and 8(d), a large increase of both numbers of crystallites per surface unit and crystallite size are observed. The precipitation of Ni
(1-z)Fe(2+z)O4 is then strongly linked to the efficiency of ion-exchange resins, but seems to be also
bound to immersion time, when comparing figures 8(a) to 8(b) and 8(c) to 8(d).
The relative evolutions of the intensity of the contribution at 855.0 eV on the Ni-2p3/2 spectra and the Fe-2p1/2 complete area, for all investigated immersion times, are reported on figure 9. There are in good agreement with SEM observations: the two exposure times which exhibit the maximum proportions of both contributions correspond to the damaged working
conditions, corroborating that the precipitation of nickel ferrite is emphasized during such experiments. These results highlight the relationship between the concentration of Fe and Ni cations in the media and the growth of the external oxide layer as previously evidenced in a former work [12].
However, it can be pointed out that the complete area of the Fe-2p1/2 is not only linked to ferrite precipitation, but that part of this area is necessarily due to the iron contained in the alloy and in the internal oxide scale (mainly made of Ni(1-x)FexCr2O4). In contrast, the
variations in the 855.0 eV peak intensity seem to be useful for studying the kinetics of ferrite precipitation, even if the detection limit of this phenomenon is lower by XPS than by SEM
(on figure 8(a), few crystallites were observed while no ferrite-associated peak was evidenced on the corresponding Ni-2p3/2 spectra).
4- Conclusions
The aim of this work was to evaluate the contribution of XPS analyses to the description of oxide scales formed on nickel base alloys exposed to PWR primary media, having been previously characterized by SEM, TEM and PEC.
Those corrosion layers are made of a mixture of oxides and hydroxides and the deconvolution of Cr-2p3/2, Ni-2p3/2 and O-1s core level recorded on such samples need to preliminarily perform spectra on reference compounds.
Indeed, the comparison of data collected in the literature and reference spectra performed in this work seems to evidence that core level fits are dependent of the energy resolution which can be achieved with specific spectrometer and analysis procedures. A lack in reference data, recorded under the same analytical configuration, could lead to confusing issues when a mixture of corrosion products is analyzed.
The comparison of core level spectra recorded on alloy 690 corroded samples and reference compounds lead to several conclusions.
(i) The deconvolution of Cr-2p3/2 core level spectra suggests that the internal oxide scale is made of a mix of chromite and chromia.
(ii) The study of the evolution of the height ratio, between satellite and principal peaks, on the Ni-2p3/2 core level has highlighted the presence of nickel hydroxide for all the corrosion durations. This result has not yet been clearly evidenced by TEM or PEC characterizations carried out during former studies using this same set of samples.
(iii) The precipitation of nickel ferrite during the corrosion process can be
evidenced by the variations in intensity of a peak located at a BE of 855.0 eV on the Ni-2p3/2 core level. Such variations allow using XPS analyses to study the kinetics of this phenomenon, with a measure performed on roughly 1 mm2:
i. e. at a scale which is consistent with the description of generalized corrosion
phenomena.
It must be emphasized that, even if this XPS study brings complementary elements to those obtained in our previous works, a more complete description of these oxide scales seems to be achieved, through the use of better adapted reference compounds. Indeed, in nickel ferrite and chromite formed on Ni base alloys exposed to PWR primary medium, Fe is partially
substituted to Ni. The use of reference compounds of Ni(1-z)Fe(2+z)O4 and Ni(1-x)FexCr2O4, with
References
[1] A. Machet, A. Galtayries, S. Zanna, L. Klein, V. Maurice, P. Jolivet, M. Foucault, P. Combrade, P. Scott, P. Marcus, Electrochim. Acta 2004 ; 49, 3957.
[2] N. S. McIntyre, D. G. Zetaruk, D. Oven , J. Electrochem. Soc. 1979 ; 126 , 750.
[3] T. M. Angeliu, G. S. Was, J. Electrochem. Soc. 1993 ; 140 , 1877.
[4] A. Machet, A. Galtayries, P. Jolivet, M. Foucault, P. Combrade, P. Scott, P. Marcus
Corrosion issues in light water reactors: Stress corrosion cracking (Eds. D. Féron, J.-M.
Olive) Woodhead Publishing Limited, Cambridge, 2007, pp. 44-56.
[5] A. Machet, A. Galtayries, P. Marcus, P. Combrade, P. Jolivet, P. Scott, Surf. Interface
Anal. 2002 ; 34 , 197.
[6] F. Carrette, M. C. Lafont, G. Chatainier, L. Guinard, B. Pieraggi, Surf. Interface Anal. 2002 ; 34 , 135.
[7] F. Carrette, M. C. Lafont, L. Legras, L. Guinard, B. Pieraggi, Mater. High Temp. 2003 ;
20 , 581.
[8] C. Soustelle, M. Foucault, P. Combrade, K. Wolski, T. Magnin, Proceedings of the Ninth
International Symposium on Environmental Degradation of Materials in Nuclear Power Systems – Water Reactors (Eds F.P. Ford, S. M. Bruemmer, G. S. Was), The Minerals, Metals
and Material Society (TMS), Warrendale, 1999, pp. 105-113.
[9] F. Delabrouille, B. Viguier, L. Legras, E. Andrieu, Mat. High. Temp. 2005 ; 22 , 287.
[10] J. Panter, B. Viguier, J.-M. Cloué, M. Foucault, P. Combrade, E. Andrieu, J. Nucl.
Mater. 2006 ; 348 , 213.
[11] M. Sennour, L. Marchetti, S. Perrin, M. Pijolat, O. Raquet, Mater. Sci. Forum 2008 ;
595-598 , 539.
[12] M. Sennour, L. Marchetti, F. Martin, S. Perrin, R. Molins, M. Pijolat, J. Nucl. Mater. 2010 ; 402 , 147.
[13] L. Marchetti, S. Perrin, Y. Wouters, F. Martin, M. Pijolat, Electrochim. Acta 2010 ; 55 , 5384.
[14] F. Carrette, L. Guinard, B. Pieraggi, Proceedings of the International conference on
water chemistry in reactors systems, Avignon, France, 2002.
[15] H. Lefaix-Jeuland, L. Marchetti, S. Perrin, M. Pijolat, M. Sennour, R. Molins, Corros.
Sci. 2011 ; 53 , 3914.
[16] L. Guinard, O. Kerrec, D. Noel, S. Gardey, F. Coulet, Nucl. Energy 1997 ; 36 , 19.
[18] N. S. McIntyre, M. G. Cook, Anal. Chem. 1975 ; 47 , 2208.
[19] N. S. McIntyre, D. G. Zetaruk, D. Oven, Appl. Surf. Sci. 1978 ; 2 , 55.
[20] A. P. Grosvenor, M. C. Biesinger, R. St. C. Smart, N. S. McIntyre, Surf. Sci. 2006 ; 600 , 1771.
[21] A. R. Pratt, N. S. McIntyre, Surf. Interface Anal. 1996 ; 24 , 529.
[22] M. C. Biesinger, C. Brown, J. R. Mycroft, R. D. Davidson, N.S. McIntyre, Surf. Interface
Anal. 2004 ; 36 , 1550.
[23] B. Beverskog, I. Puigdomenech, Corros. Sci. 1997 ; 39 , 969.
[24] M. C. Biesinger, B. P. Payne, L. W. M. Lau, A. Gerson, R. St. C. Smart, Surf. Interface
Anal. 2009 ; 41 , 324.
[25] M. C. Biesinger, B. P. Payne, A. P. Grosvenor, L. W. M. Lau, A. R. Gerson, R. St. C. Smart, Appl. Surf. Sci. 2011 ; 257 , 2717.
[26] M. Lenglet, A. d’Huysser, J. Arsène, J. P. Bonnelle, C. K. Jørgensen, J. Phys. C: Solid
State Phys. 1986 ; 19 , L363.
[27] J. Sloczynski, J. Ziolkowski, B. Grzybowska, R. Grabowski, D. Jachewicz, K. Wcislo, L. Gengembre, J. Catal. 1999 ; 187 , 410.
[28] A. Machet, Etude des premiers stades d'oxydation d'alliages inoxydables dans l'eau à
haute température, PhD thesis, Université Pierre et Marie Curie, Paris, France, 2004.
[29] A. N. Mansour, Surf. Sci. Spectra 1996 ; 3 , 239.
[30] A. N. Mansour, C. A. Melendres, Surf. Sci. Spectra 1996 ; 3 , 255.
[31] A. N. Mansour, C. A. Melendres, Surf. Sci. Spectra 1996 ; 3 , 247.
[32] G. P. Halada, C. R. Clayton, , J. Electrochem. Soc. 1991 ; 38 , 2921.
[33] I. Grohmann, E. Kemnitz, A. Lippitz, W. E. S. Unger, Surf. Interface Anal. 1995 ; 23 , 887.
[34] R. P. Gupta, S. K. Sen, Phys. Rev. B 1974 ; 10 , 71.
[35] R. P. Gupta, S. K. Sen, Phys. Rev. B 1975 ; 12 , 15.
[36] H. A. E. Hagelin-Weaver, J. F. Weaver, G. B. Hoflund, G. N. Salaita, , J. Electron.
Spectrosc. Relat. Phenom. 2004 ; 134 , 139.
Tables
Ni Cr Fe C Co Mn Al Ti Cu Si S P
59.31 29.20 9.94 0.018 0.014 0.31 0.13 0.27 <0.002 0.27 <0.0005 0.007
Table 1: Composition (in wt%) of alloy 690
Compounds BE for Peak 1 (eV) ta% BE for Peak 2 (eV) ta% BE for Peak 3 (eV) ta% BE for Peak 4 (eV) ta% BE for Peak 5 (eV) ta% Cr2O3 575.9 36 576.9 35 577.7 19 578.7 8 579.1 5 NiCr2O4 575.4 35 576.4 34 577.2 18 578.3 9 579.4 4 FeCr2O4 576.1 41 577.2 39 578.1 13 579.1 7 -
Table 2: Binding energies (BE) and contributions of the associated peak to the total area of the core level envelope (ta%), for the fit of the Cr 2p3/2 spectra of Cr2O3, NiCr2O4 and
Figures captions
Figure 1: Schematic view of the oxide scale that forms during the exposition of Ni base alloys in PWR primary water [11-13].
Figure 2: Curve fitted Ni-2p3/2 spectra of reference (a) metallic Ni; (b) NiFe2O4; (c) NiCr2O4
and (d) Ni(OH)2 compounds.
Figure 3: Curve fitted Cr-2p3/2 spectra of reference (a) Cr2O3 and (b) NiCr2O4 compounds.
Figure 4: Curve fitted O-1s spectra of reference (a) Cr2O3; (b) NiFe2O4; (c) NiCr2O4 and (d)
Ni(OH)2 compounds.
Figure 5: Curve fitted Cr-2p3/2 spectra of alloy 690 corroded at different exposure times in PWR primary coolant conditions.
Figure 6: Curve fitted Ni-2p3/2 spectra of alloy 690 corroded at different exposure times in PWR primary coolant conditions.
Figure 7: Curve fitted O-1s spectra of alloy 690 corroded at different exposure times in PWR primary coolant conditions.
Figure 8: SEM observations of the surface of alloy 690 after different exposure times and for different ion-exchange resin working conditions: (a-b) exposed to PWR primary simulated water at optimized working conditions, for 24 h (a) and 406 h (b); (c-d) exposed to PWR primary simulated water in “damaged conditions”, for 164 h (c) and 858 h (d).
Figure 9: Evolution of the proportion associated to the Fe-2p1/2 and nickel ferrite Ni-2p3/2 peaks as function of the immersion time of alloy 690 in PWR primary medium at 325 °C.
Figure 1
Ni(OH)
2,yH
2O
Ni
xFe
(1-x)Cr
2O
4Ni base alloys
Ni
(1-z)Fe
(2+z)O
4Cr
2O
3Figure 2
870
865
860
855
850
(b) NiFe
2O
4(c) NiCr
2O
4(d) Ni(OH)
2(a) Ni metal
XPS Ni-2p
3/2
In te n s it y ( a rb it ra ry u n it s )Binding Energy (eV)
Main peak
S
h
a
k
e
-u
p
s
a
t.
2
S
h
a
k
e
-u
p
s
a
t.
8
5
5
.3
e
V
8
5
6
.4
e
V
8
5
6
.2
e
V
8
5
2
.6
e
V
Figure 3
582 580 578 576 574 572 I peak3/Ipeak2 = 0.42 (a) Cr 2O3 (b) NiCr2O4XPS Cr-2p
3/2 In te n s it y ( a rb it ra ry u n it s )Binding Energy (eV) I peak1/Ipeak2 = 0.68 I peak1/Ipeak2 = 0.46 I peak3/Ipeak2 = 0.42 Cr oxide peak 3 57 6 .7 e V Cr oxide peak 2 Cr oxide peak 1 5 7 5 .6 e V 5 7 8.5 e V
Figure 4
538 536 534 532 530 528 (a) Cr 2O3 (b) NiFe 2O4 (c) NiCr 2O4 (d) Ni(OH) 2XPS O-1s
In te n s it y ( a rb it ra ry u n it s )Binding Energy (eV)
5 3 0 .1 e V Hydroxide 5 32 .0 e V 5 30 .3 e V
Figure 5
582 580 578 576 574 572
Cr oxide peak 3
Cr oxide peak 2
(a) Initial surface
(d) A690 corroded 858 h in PWR primary conditions
(c) A690 corroded 164 h in PWR primary conditions
Cr oxide peak 1
Binding Energy (eV)
XPS Cr-2p
3/2 Cr0 (b) A690 corroded 24 h in PWR primary conditions In te n s it y ( a rb it ra ry u n it s )Figure 6
870 868 866 864 862 860 858 856 854 852 850
(a) Initial surface
(d) A690 corroded 858 h. in PWR primary conditions (c) A690 corroded 164 h. in PWR primary conditions Sat. Ni0 Sat. Ni(OH) 2 Sat. NiCr 2O4 Sat. NiFe 2O4 Ni(OH) 2 NiCr 2O4 NiFe 2O4 NiFe 2O4
Binding Energy (eV)
XPS Ni-2p
3/2 Ni0 (b) A690 corroded 24 h. in PWR primary conditions In te n s it y ( a rb it ra ry u n it s )Figure 7
538 536 534 532 530 528 hydroxide/organic O Water (d) A690 corroded 858 h in PWR primaryconditions (c) A690 corroded 164h in PWR primary conditions lattice oxideBinding Energy (eV)
XPS O-1s
(b) A690 corroded 24h in PWR primary conditions
(a) Initial surface
In te n s it y ( a rb it ra ry u n it s )
Figure 8
b
20 µma
20 µmc
20 µmd
20 µmFigure 9
0 200 400 600 800 1000 0,0 0,5 1,0 1,5 2,0 2,5 3,0 3,5 4,0 4,5 5,0 5,5 6,0 6,5 r e la ti v e c o n c e n tr a ti o n ( A to m ic % )peak associated to NiFe2O4 (Ni-2p3/2) peak associated to Fe (Fe-2p
1/2)
Immersion time (hours)