HAL Id: halshs-00586267
https://halshs.archives-ouvertes.fr/halshs-00586267
Preprint submitted on 15 Apr 2011
HAL is a multi-disciplinary open access archive for the deposit and dissemination of sci-entific research documents, whether they are pub-lished or not. The documents may come from teaching and research institutions in France or abroad, or from public or private research centers.
L’archive ouverte pluridisciplinaire HAL, est destinée au dépôt et à la diffusion de documents scientifiques de niveau recherche, publiés ou non, émanant des établissements d’enseignement et de recherche français ou étrangers, des laboratoires publics ou privés.
Measuring well-being across Europe: Description of the
ESS Well-being Module and preliminary findings
Felicia A. Hupper, Nic Marks, Andrew E. Clark, Johannes Siegrist, Alois
Stutzer, Joar Vittersø, Morten Wahrendorf
To cite this version:
Felicia A. Hupper, Nic Marks, Andrew E. Clark, Johannes Siegrist, Alois Stutzer, et al.. Measuring well-being across Europe: Description of the ESS Well-being Module and preliminary findings. 2008. �halshs-00586267�
WORKING PAPER N° 2008 - 40
Measuring well-being across Europe: Description of the
ESS Well-being Module and preliminary findings
Felicia A. Huppert Nic Marks Andrew E. Clark Johannes Siegrist Alois Stutzer Joar Vittersø Morten Wahrendorf
JEL Codes: C81, I31
Keywords: Well-being, European Social Survey, questionnaire design
P
ARIS-
JOURDANS
CIENCESE
CONOMIQUESL
ABORATOIRE D’E
CONOMIEA
PPLIQUÉE-
INRA 48,BD JOURDAN –E.N.S.–75014PARISTÉL. :33(0)143136300 – FAX :33(0)143136310
www.pse.ens.fr
CENTRE NATIONAL DE LA RECHERCHE SCIENTIFIQUE –ÉCOLE DES HAUTES ÉTUDES EN SCIENCES SOCIALES ÉCOLE NATIONALE DES PONTS ET CHAUSSÉES –ÉCOLE NORMALE SUPÉRIEURE
(AC 28.7.2008. - Special issue of SIR)
Not for Citation
Measuring well-being across Europe: Description of the
ESS Well-being Module and preliminary findings
Felicia A Huppert1, Nic Marks2, Andrew Clark3, Johannes Siegrist4, Alois Stutzer5,
Joar Vittersø6 and Morten Wahrendorf4
1
Department of Psychiatry and the Well-being Institute, University of Cambridge, UK 2
Centre for Well-being, new economics foundation, London, UK 3
Paris School of Economics, France 4
Institut für Medizinische Soziologie, Heinrich Heine-Universität Düsseldorf, Germany 5
Department of Business and Economics, University of Basel, Switzerland 6
Institutt for Psykologi, Universitetet i Tromsø, Norway
Author note:
The first six authors were the members of the Questionnaire Design Team for the ESS Well-being Module, which was led by Felicia Huppert and Nic Marks.
Abstract
It has become customary to judge the success of a society through the use of objective indicators, predominantly economic and social ones. Yet in most developed nations, increases in income, education and health have arguably not produced comparable increases in happiness or life satisfaction. While much has been learned from the introduction of subjective measures of global happiness or life satisfaction into surveys, significant recent progress in the development of high-quality subjective measures of personal and social well-being has not been fully exploited. This paper describes the development of a set of well-being indicators which were included in Round 3 of the European Social Survey. This Well-being Module seeks to evaluate the success of European countries in promoting the personal and social well-being of their citizens. In addition to providing a better understanding of domain-specific measures, such as those relating to family, work and income, the design of the Well-being Module recognises that advancement in the field requires us to look beyond measures which focus on how people feel (happiness, pleasure, satisfaction) to measures which are more concerned with how well they function. This also shifts the emphasis from relatively transient states of well-being to measures of more sustainable well-being. The ESS Well-being Module represents one of the first systematic attempts to create a set of policy-relevant national well-being accounts.
Background
Whilst national governments spend substantial amounts of money collecting and analysing economic (and, to a lesser extent, social and environmental) indicators, relatively little attention has been given to how citizens actually experience their lives. In other words, much more is known about the material conditions of people’s lives than about people’s perceived quality of life, which we refer to as their ‘well-being’.
The reliance on objective indicators of progress has recently been challenged by researchers in a number of behavioural and social-science disciplines (Layard, 2005; Diener & Seligman, 2004; Marks & Shah, 2005; Frey and Stutzer 2002). These authors recommend that objective indicators be supplemented by subjective measures of how people experience their lives. The principal reason is that the objective indicators (e.g. GDP, wealth, consumption, crime rate, education) tend to be only relatively weakly associated with people’s experiences, as measured by happiness or life satisfaction (Easterlin 2001; Donovan & Halpern, 2002; Helliwell, 2003; Helliwell & Putnam, 2005). Indeed, there is evidence that in economically developed countries, increasing economic prosperity may even be associated with increasing rates of depression, divorce and suicide (Helliwell, 2007; Layard, 2005). Hence there is a need for reliable subjective indicators of well-being to provide a more complete picture, and one which can help to explain any disconnect between relative prosperity and high rates of individual and social problems. These reliable subjective indicators could be used to inform policy and to evaluate both secular change and the effects of new policies.
How good are standard measures of subjective well-being?
A major criticism of many of the surveys undertaken to date is that they tend to rely on single-item measures of life satisfaction or happiness, rather than more refined, multi-item measures. Although many of the world’s largest surveys have used single-item measures of subjective well-being (e.g. the World Values Survey, Eurobarometer, the first European Quality of Life Survey, ESS Rounds 1 and 2), it is known that single-item measures do not have high reliability, since responses are markedly influenced by contextual factors such as the preceding item. This has led to the development of a number of multi-item measures of satisfaction, of which the two best-known are the 5-item Satisfaction With Life Scale (SWLS) of Diener (Diener
et al., 1985; Pavot et al., 1991) and the 7-item Personal Well-being Index (PWI) developed by Cummins and colleagues (Cummins, 2003; Lau, 2005).
While reliability is undoubtedly improved by these multi-item measures, a reliance on satisfaction measures to assess subjective well-being is problematic. Evaluating one’s level of satisfaction with life in general, or with different domains of life (work, family, health, finance etc.) involves an implicit comparison of a person’s current state against their expectations. Respondents may report a high level of satisfaction if they genuinely experience their life as going well, but they may also report a high level of satisfaction if their experience is far less positive, but their expectations are very low. For this reason, the assessment of subjective well-being requires more direct measures of the respondent’s current state, including questions about positive and negative mood. This has been recognised in a number of large surveys which supplement satisfaction questions with questions about mental state or affective symptoms, using measures such as the General Health Questionnaire (GHQ; Goldberg, 1978), or the Centre for Epidemiologic Studies Depression Scale (CES-D; Radloff, 1977). However, even adding measures of affect to measures of satisfaction does not do full justice to the concept of well-being.
Well-being is a complex construct, worthy of a more nuanced definition and more detailed assessment. Recognition of the limitation of standard measures has led to a call by some distinguished psychologists for the development of a systematic set of subjective national indicators of well-being, or well-being accounts. In their seminal 2004 paper “Beyond Money: toward an economy of well-being” Diener and Seligman called for:
“a national well-being index [to] be created that systematically assesses key well-being variables for representative samples, including positive and negative emotions, engagement, purpose and meaning, optimism and trust, and life satisfaction, as well as satisfaction with specific domains of life.”
A new approach: the ESS Well-being Module
The Well-being Module created for Round 3 of the European Social Survey represents one of the first systematic attempts to develop a coherent set of subjective well-being measures for use in national and cross-national studies. A specific aim was to incorporate two distinct theoretical approaches to well-being: the hedonic approach, which is concerned with pleasure, enjoyment and satisfaction; and the
eudaimonic approach, which is concerned with functioning and the realisation of our potential. Standard single-item measures of well-being are primarily hedonic in nature, as are the more detailed domain-specific measures which examine satisfaction in life domains such as work, finance, relationships and health (e.g. the Personal Well-being Index of Cummins, 2003). In contrast, the eudaimonic perspective has its roots in Aristotle’s work on the life well-lived, creating a bridge between the more private realm of personal happiness to the more public issues of competencies, freedoms and opportunities. These ideas have been powerfully elaborated in the work of Amartya Sen (1999), which highlights the importance of individuals having the opportunities to develop their capabilities and function effectively. The psychologist Sonja Lyubomirsky and her colleagues (2005) emphasize the importance of understanding well-being as an active process, and provide evidence that ‘intentional activities’, i.e. the behavioural, cognitive and motivational choices that we make, account for far more variance in the level of well-being between individuals than do external circumstances, at least in economically-developed countries.
Other influential psychologists have also emphasised the functional aspects of well-being. They include Ryff, whose concept of psychological well-being derives from the eudaimonic perspective, and comprises six components: autonomy, environmental mastery, personal growth, positive relationships, purpose in life and self-acceptance (Ryff, 1989; Ryff & Singer, 1998). Ryan & Deci (2001) regard autonomy, competence (similar to environmental mastery) and positive relationships as the basic psychological needs which must be met if we are to experience well-being. Seligman defines happiness as the combination of pleasure, engagement and meaning (Seligman, 2002), identifying pleasure as the hedonic component and engagement and meaning as the eudaimonic components. The work of authors such as Amabile (Amabile et al., 1994), Kashdan (Kashdan et al., 2004) and Vittersø (Vittersø et al., 2007), examining the domains of engagement, interestingness and curiosity, can also be seen as central to a concept of well-being which focuses on ‘doing’ rather than ‘being’.
A further important aim of the ESS Well-being Module was to go beyond individualistic aspects of well-being, by incorporating measures of social or interpersonal well-being.
The way in which an individual relates to others and to their society is a key aspect of their subjective well-being. This is reflected in the extensive work on social capital, which links the level of a group’s social connectedness to average levels of happiness and satisfaction, health and productivity (Putnam, 2000; Helliwell & Putnam, 2005). Social capital research tends to use objective measures, although measures of social trust are subjective. The Well-being Module includes additional subjective measures of interpersonal experience and functioning in the social domain.
In light of the overwhelming evidence that our perceptions of interpersonal and social interactions play a crucial role in our well-being (e.g. House et al, 1988a, 1988b), the ESS Well-being Module incorporates a substantial number of items covering this important aspect of daily life. Existing scales which assess interpersonal relationships usually focus on measures of social support, i.e. what we receive from others. Important as social support is for well-being, particularly if we have a problem (e.g. Huppert & Whittington, 2003), there is evidence that social contribution, i.e. giving to others, doing things for others or volunteering, may contribute more to our general well-being and even to our physical health, than receiving support (Brown, 2003; Brown et al., 2003; Post, 2005; Meier & Stutzer, 2008). Additionally, the core notion of reciprocity in social exchange is incorporated in measures of interpersonal feeling and functioning (Siegrist, 2005).
Conceptual framework
The different theoretical perspectives described above guided the development of a clear conceptual framework underpinning the ESS Well-being Module. This is represented in Table 1. It is divided into two sections, corresponding to personal and inter-personal dimensions of well-being. Each of these is further sub-divided into feeling (being) and functioning (doing). Key well-being constructs are then listed within their appropriate domain.
While this framework guided our choice of constructs and items, the extent to which these four broad domains are independent of one another remains an empirical question. We plan to investigate the psychometric properties of the Well-being Module using latent variable modelling, multilevel modelling and item response theory (IRT), which are the most appropriate methods for dealing with data with categorical response formats.
Item selection and refinement of the ESS Well-being Module
The overall aim and framework of this module may be readily specified, but the choice of specific concepts within the field of well-being, and the choice of specific items to measure these concepts, proved to be a major challenge. This is because there is not yet any consensus among psychologists about the components of well-being, or what would constitute the “gold standard” for measuring well-being. Nevertheless, there is a consensus that the measurement of well-being is important and should be undertaken in major surveys, all the while recognising that this is an emerging science (Diener, 2006).
Some investigators have adopted a very pragmatic approach to the assessment of well-being, using global life satisfaction and domain satisfaction as their key indicators (eg Cummins, 1997). While a number of measures of satisfaction have been included in the ESS module (in addition to the global life satisfaction question found in the ESS core), we believe that an over-dependence on satisfaction measures is unwise, for the reasons outlined above.
By including in this module certain concepts that most investigators regard as being important aspects of well-being, whether conceived as components or precursors, we have tried to steer a course between the various pragmatic and theoretical approaches to well-being. In Round 3 of the ESS, new modules were restricted to 50 questions (although questions about jobs count as half, since they only apply to about half the population). It was therefore difficult to incorporate whole scales, and we had to be very selective about which items to choose. Where possible, we have used or adapted existing items, but in many cases we found that existing items did not express clearly and succinctly the concept that we were trying to measure, or that the way in which the question was worded would have led to difficulties in
interpretation or translation. Accordingly, a number of items have been developed specifically for this survey. Full documentation concerning the origins of all items is available from the first author.
An exhaustive process of literature review, concept and item selection, followed by item refinement, was undertaken prior to the ESS Round 3 pilot study. Following the pilot study on a sample of over 800 participants from Poland and Ireland, a further stage of item elimination and item refinement was undertaken, using comprehensive psychometric techniques. The final module comprises 54 items which were
incorporated in Round 3 of the European Social Survey.‡
An additional feature of the Well-being Module is that it uses two complementary methodologies: (a) general evaluative questions that assess the individual’s feelings and functionings (within or across domains); and (b) more specific questions that ask about experiences during the past week. By doing so, the module provides information based on the experience of recent events, which will be relatively fresh in the respondent’s memory, as well as the more general, evaluative responses which
are based in part on the person’s self-image§.
Finally, in addition to items which were specifically designed to fit the conceptual framework described above, we have incorporated a number of supplementary items which we believe may have important effects on well-being. These include risk of unemployment, income comparisons, physical activity and feelings about watching television.
The final set of 54 items is listed in the Appendix. Items are listed by the domain to which they are conceived to contribute. An exception is “you felt lonely” which clearly belongs to the domain of interpersonal feelings, but is listed with the other items that comprise the CES-D scale, and thus appears in the domain of personal feelings.
‡
Round 3 fieldwork took place in September-December 2006, and the first data release was in September 2007.
§
The Day Reconstruction Method (DRM - Kahneman et al., 2004), which provides a detailed evaluation of experiences on the previous day, was piloted, but time constraints prevented its inclusion in the final version of the Well-being Module.
Use of the Well-being Module
We recommend that the data obtained from the module be used in a flexible way. At one extreme, Europe-wide responses to individual items will provide valuable descriptive, and often policy-relevant, information. At the other extreme, psychometric analysis of the data obtained from the survey will indicate how items can be combined into the most informative summary measures of well-being. At an intermediate level of analysis, examination of the relationship between these new measures and the single-item life satisfaction/happiness questions should also yield valuable insights into the meaning and validity of these latter widely-used measures.
Preliminary findings
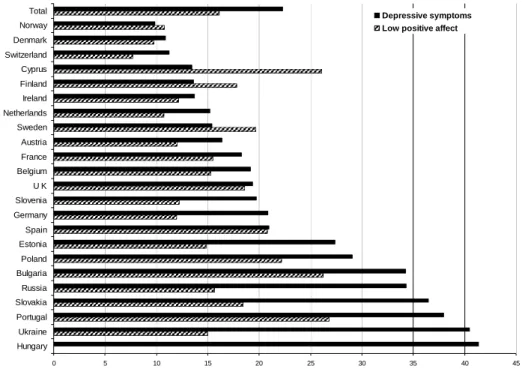
To illustrate the type of information which can be obtained from the module, we have selected sample items from each of the domains in our conceptual framework which was outlined in Table 1. The data are taken from edition 3.1 of the ESS data, which includes 23 of the 25 countries in Round 3. Design weights are applied to the values presented in the Figures. Figure 1 depicts two measures of personal feelings: (1) the percentage who obtained above the threshold scores on the 8-item depression measure – the CES-D (Radloff, 1977; Steffick, 2000) – where depression was defined as a score of >16 using the 1-4 Likert item-response codes; and (2) the percentage who obtained low scores on a positive-affect measure (12 or less on the 6 positive-affect items, using the 1-4 Likert item response codes). A high score on either of these measures is indicative of poor well-being.
Figure 1 about here
It can be seen that rates of depression vary markedly across Europe; there is more than a 4-fold difference between the lowest and highest rates. The lowest rates of depression among these 23 countries are seen in Norway (9.9%), Denmark (10.9%) and Switzerland (11.2%); the highest rates of depression appear in Hungary (41.4 %), Ukraine (40.5%) and Portugal (38%). It is important to note that the CES-D was designed as a scoring measure of depression, not a diagnostic measure. While the high scores in several Eastern European countries and Portugal are a cause of concern, and need to be fully explored, rates of clinically significant depression are likely to be considerably lower. The countries which come out well in relation to
positive affect, i.e. have the smallest percentage of people with low positive affect, are Switzerland (7.7%), Denmark (9.8%), Norway (10.8%) and the Netherlands (10.8%). The countries which come out poorly in relation to positive affect, i.e. have the highest percentage of people with low positive affect, are Portugal (26.8%),
Bulgaria (26.3%) and Cyprus (26.1%).**
High scores on the depression scale are generally associated with low scores on the positive affect measure (for the sample as a whole, Spearman rho=0.56). However, within countries there are some interesting counter-examples: in the Ukraine and Russia, depression rates are very high, but are not accompanied by low positive affect – their rates are better than the European average. In contrast, the depression rate in Cyprus is very low but positive affect is also very low, i.e. the percentage with low positive affect is well above the European average. A similar trend of low negative affect combined with low positive affect is seen in Sweden and Finland. These findings confirm the relative independence of positive and negative affect (Diener et al., 1999; Huppert & Whittington, 2003).
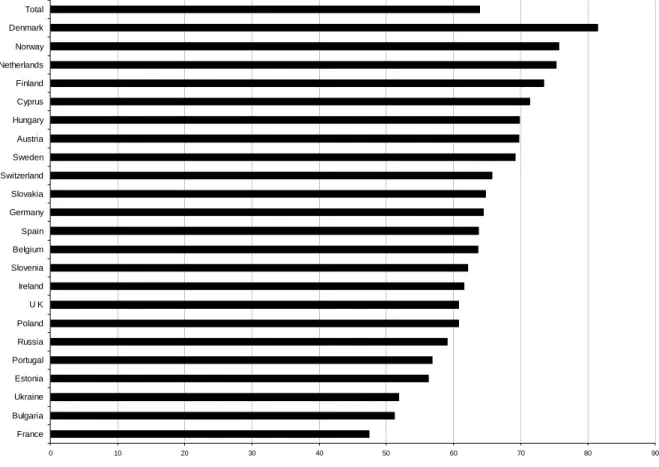
Figure 2 presents an example of a question which evaluates personal functioning. It depicts the percentage of the population in each country who say they have time to do the things they enjoy (i.e. do not agree with the statement “In my daily life, I seldom have time to do the things I really enjoy”).
Figure 2 about here
It can be seen that France has a particular problem in this regard; fewer than half (47.5%) of the respondents in France report having time to do the things they enjoy. On this index of well-being, Bulgaria and the Ukraine also do relatively poorly. On the other hand, people in Denmark do well, with 81.5% saying they have time to do the things they enjoy, followed by participants in Norway, the Netherlands and Finland. An obvious explanation for the cross-national differences might be differences in the average numbers of hours worked per week. However, the average number of hours worked (for those in paid employment, and including overtime) is only modestly correlated with scores on this item (Spearman rho=-0.10). The figure for average weekly hours worked ranges from 34.0 to 45.3, and the figure
**
Note that data on low positive affect are not available for Hungary, since one of the positive affect items – you had a lot of energy – was not included in the Hungarian interviews.
for France is not very different to that for Denmark (38.4 and 37.3 respectively). A different explanation clearly needs to be sought for country differences in perceptions of how much time people have to enjoy their lives.
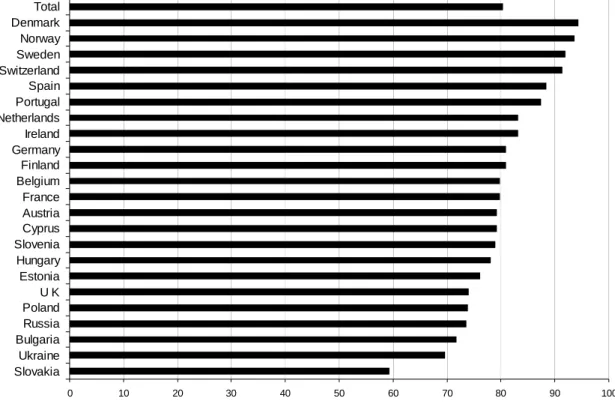
Figure 3 provides an example of a question about interpersonal feelings. It shows the percentage of the population who feel they are treated with respect (scores above the midpoint on the 7-point scale).
Figure 3 about here
Broadly speaking, people in Northern Europe feel they are treated with respect, whereas people in Eastern European countries are less likely to feel respected. Over 90% of respondents in Denmark, Norway, Sweden and Switzerland report that they are treated with respect, compared to less than 70% in the Ukraine and less than 60% in Slovakia. These differences between Northern and Eastern European countries may be related to the well-known variation in levels of social trust between these regions, high trust being linked to good governance, social stability, and relative income equality (Newton, 2004).
Figure 4 provides an example of a question about interpersonal functioning. It shows the percentage of the population who did voluntary or charitable work on at least one occasion in the past year.
Figure 4 about here
A striking disparity is evident across European nations, with an almost 10-fold difference in volunteering. Norway has by far the highest rate, with 67% engaged in voluntary or charitable work, followed by Austria and Switzerland. At the other extreme, only 7% of Bulgarians were engaged in voluntary or charitable work, closely followed by some other Eastern European countries - Poland, Russia, Estonia and Hungary. These very large differences are not explained by cross-national differences in socio-demographic characteristics, hours worked or provision of informal care, although the differences are reduced when social trust is taken into account (Zimmermann & Huppert, In preparation). Differences of the magnitude reported here are worthy of more detailed investigation in future work.
It can be seen from the above Figures that there is a fair amount of variation in the rank ordering of countries across the items selected from the Well-being Module. A regression analysis was run, using only country dummies, to establish the extent to which countries that score high on one of these well-being measures also score high on others. The results are presented in Table 2. All of the variables in this table are coded such that higher numbers mean greater well-being.
Table 2 about here
The strongest associations are between depressive symptoms and a reduced likelihood of being treated with respect (-0.74), and between depressive symptoms and a reduced likelihood of having done voluntary work (-0.82). The first of these associations could reflect the social stigma which often accompanies mental health problems, although another explanation could be that people who are not treated with respect may develop symptoms of depression. Regarding the association with voluntary work, it is likely that someone who is feeling depressed would not have the motivation or confidence to undertake voluntary work; on the other hand, it is known that doing voluntary work can reduce symptoms in people who are depressed (Brown et al., 2003), so there is probably a bi-directional relationship. Overall, while the correlations in Table 2 are significant, their magnitude is only modest. This underlines the fact that while these measures have some commonality, it is valuable to use a range of measures which provide complementary information. Ongoing psychometric analyses will establish the number of relatively independent well-being factors which the items in the Well-being Module measure.
Finally, we look briefly at the relationship between the selected well-being items, gender and age. Table 3 shows that this relationship is complex.
Table 3 about here
Women are more likely to report low well-being when it is assessed by depression and low positive affect, but are more likely to say they are treated with respect. Men are more likely to say they have time to do the things they enjoy and are also more likely to have done voluntary work. Table 3 also shows that depression and low positive affect increase with age in this European sample. Some other studies find that depression follows a hump-shaped function with age, and that positive affect,
measured by a life satisfaction or happiness question, follows a U-shaped function with age (e.g. Blanchflower & Oswald, 2008; Singleton et al., 2001). Investigating differences in age profiles across studies is an important area for future research. Other results in Table 3 are: having time to enjoy things is U-shaped with age, with younger and older people reporting more time than people in mid-career or of prime child-rearing age; being treated with respect increases linearly with age, which is an interesting, if surprising finding in view of concerns about age discrimination; and doing voluntary work is highest in the middle years, despite employment and child-rearing responsibilities. This variety of relationships between age and various well-being items further underscores the value of using a range of measures to obtain a deeper understanding of well-being and the factors which influence it.
Conclusion
The new Well-being Module of the European Social Survey (ESS) provides an opportunity for a richly-textured description of how the citizens of Europe experience their lives. It complements more objective data on economic, social and environmental influences on well-being, which can be derived from other items within the ESS and from other data sources. We believe that the Well-being Module will provide invaluable information for behavioural and social scientists, and contribute to the development of policies and practices for enhancing well-being across Europe.
Acknowledgements
We are grateful to Anne Gadermann and Dr. Anke Zimmermann for assistance with data analysis, and to an anonymous referee for useful suggestions. Thanks also to Drs. Rosemary Abbott, Daniel Johnson, Gabrielle Osborne, and to Julie Aston for editorial assistance.
References
Amabile, T. M., Hill, K. G., Hennessey, B. A., & Tighe, E. M. (1994). The work preference inventory: Assessing intrinsic and extrinsic motivational orientation. Journal of Personality and Social Psychology, 66, 950-967.
Blanchflower, D.G. & Oswald, A.J. (2008) Is well-being U-shaped over the life cycle? Social Science & Medicine, 66(8), 1733-49.
Brown, Stephanie L. (2003) An altruistic reanalysis of the social support hypothesis: The health benefits of giving. In: New Directions for Philanthropic Fundraising. Chap.4, No. 42, Wiley Periodicals Inc.
Brown, Stephanie L., Nesse, Randolph M., Vinokur, Amiram D. & Smith, Dylan M. (2003) Providing social support may be more beneficial than receiving it: results from a prospective study of mortality. Psychological Science, 14(4), 320-327.
Cummins, R.A. (1997) The Comprehensive Quality of Life Scale – Adult
(ComQol-A5). (5th Ed.) School of Psychology, Deakin University, Melbourne.
Cummins, R.A., Eckersley, R. Pallant, J. Van Vugt, J, & Misajon, R. (2003). Developing a national index of subjective wellbeing: The Australian Unity Wellbeing Index. Social Indicators Research, 64, 159-190.
Diener, E. (2006) Guidelines for national indicators of subjective well-Being and ill-Being. Journal of Happiness Studies, 7, 397-404.
Diener, E. (2006) Guidelines for national indicators of subjective well-Being and ill-Being. Journal of Happiness Studies, 7, 397-404.
Diener, E., Emmons, R.A., Larsen, R.J. & Griffin, S. (1985) The Satisfaction With Life Scale. Journal of Personality Assessment, 49, 1, 71-75
Diener, E. & Seligman, M. E. P. (2004) Beyond money: Toward an economy of well-being. Psychological Science in the Public Interest, 5, 1-31.
Diener, E., Suh, E.M., Lucas, R.E. and Smith, H.L. (1999). Subjective well-being: Three decades of progress. Psychological Bulletin, 125, 276-302.
Donovan, N & Halpern, D (2002) Life Satisfaction: the state of knowledge and the implications for government (Prime Minister’s Strategy Unit).
(http://www.strategy.gov.uk/2001/futures/attachments/ls/paper.pdf)
Easterlin, R.A. (2001). Income and Happiness: Towards a Unified Theory. Economic Journal, 111, 473, 465-484.
Frey, B.S., Stutzer, A. (2002). Happiness and Economics: How the Economy and Institutions Affect Human Well-Being. Princeton: Princeton University Press.
Goldberg, D.P. (1978). Manual of the General Health Questionnaire. Windsor: NFER-Nelson.
Helliwell, J.F. (2003). How's Life? Combining individual and national variations to explain subjective well-being. Economic Modelling, 20, 331-360.
Helliwell, J.F. (2007). Well-being and Social Capital: Does Suicide Pose a Puzzle? Social Indicators Research, 81, 455-496.
Helliwell, J. & Putnam, R.D. (2005). The social context of well-being. In FA Huppert, B Keverne & N Baylis (Eds.) The Science of Well-being (pp.435-459). Oxford: Oxford University Press.
House, J.S., Landis, K.R. & Umberson, D. (1988a). Social relationships and health. Science, 214, 540-545.
House, JS., Umberson, D. & Landis, KR. (1988b) Structures and Processes of Social Support. Annual Review of Sociology, 14, 293-318.
Huppert, F.A. & Whittington, J.E (2003) Evidence for the independence of positive and negative well-being: implications for quality of life assessment. British Journal of Health Psychology, 8, 107-122.
Kahneman, D., Krueger, A B., Schkade, D., Schwarz, N. & Stone, AA. (2004). A survey method for characterizing daily life experience: The Day Reconstruction Method (DRM). Science, (3 Dec 2004), 1776-1780.
Kashdan, T.B., Rose, P. & Fincham, FD. (2004) Curiosity and exploration: Facilitating positive subjective experience and personal growth opportunities. Journal of Personality Assessment, 82, 291-305.
Lau, A.L.D., Cummins, R.A. & McPherson, W. (2005) An Investigation into the Cross-Cultural Equivalence of the Personal Wellbeing Index. Social Indicators Research, 72,403-430.
Layard, R. (2005) Happiness: lessons from a new science. London: Penguin books. Lyubomirsky, S. Sheldon, KM. & Schkade, D. (2005) Pursuing Happiness: The Architecture of Sustainable Change. Review of General Psychology, 9, 2, 111-131. Marks, N & Shah, H (2005) A well-being manifesto for a flourishing society. In: Huppert F, Baylis, N & Keverne, B (Eds) The Science of Well-being. Oxford: Oxford University Press.
Meier, S., & Stutzer, A. (2008). Is Volunteering Rewarding in Itself?. Economica, 75, 39-59.
Newton, K. (2004). Social trust: individual and cross-national approaches. Portuguese Journal of Social Science, 3(1), 15-35.
Pavot, W., Diener, E., Colvin, C.R. & Sandvik, E. (1991) Further validation of the Satisfaction with Life Scale: evidence for the cross-method convergence of well-being measures. Journal of Personality Assessment, 57(1), 149-61.
Post, S.G. (2005) Altruism, happiness and health: It’s good to be good. International Journal of Behavioral Medicine, 12, 2, 66-77.
Putnam, R. (2000) Bowling Alone. The Collapse and Revival of American Community. New York: Simon & Schuster.
Radloff, L.S. (1977) The CES-D scale: A self-report depression scale for research in the general population. Applied Psychological Measurement, 1, 385-401.
Ryan, R.M. & Deci, E.L. (2001) On happiness and human potentials: A review of research on hedonic and eudaimonic well-being. Annual Review of Psychology, 52, 141-166.
Ryff, C.D. (1989). Happiness is everything, or is it? Explorations on the meaning of psychological well-being. Journal of Personality and Social Psychology, 57, 1069-1081.
Ryff, C.D. & Singer, B. (1998) The contours of positive human health. Psychological Inquiry, 9(1), 1-28.
Seligman, M. (2002). Authentic happiness: Using the new positive psychology to realize your potential for lasting fulfilment. New York: Free Press.
Sen, A. (1999) Development as Freedom. New York: Random House inc.
Siegrist, J (2005). Social reciprocity and health: new scientific evidence and policy implications. Psychoneuroendocrinology, 30, 1033-38.
Singleton, N., Bumpstead, R., O’Brien, M., Lee, A. & Meltzer, H. (2001) Psychiatric morbidity among adults living in private households, 2000. London:TSO (The Stationery Office).
Steffick, D.E. (2000) Documentation of affective functioning measures in the Health and Retirement Study. HRS/AHEAD Documentation Report. Survey Research Center, University of Michigan.
Vittersø, J., Öhlman, H. I., & Wang, A. L. (2007). Life satisfaction is not a balanced estimator of the good life: Evidence from reaction time measures and self-reported emotions. Journal of Happiness Studies. Epub. DOI 10.1007/s10902-007-9058-1. Zimmermann, A. & Huppert, F.A. (In preparation). Exploring the factors associated with differences in rates of volunteering across Europe, and implications for psychological well-being.
Appendix
List of items in the ESS Well-being Module (response codes are shown after each item or group of items)
Personal Feelings
1. I’m always optimistic about my future.
2. In general, I feel very positive about myself.
3. At times I think I am a failure.
4. On the whole my life is close to how I would like it to be.
[Response code: 1 - Agree strongly, to 5 – Disagree strongly]
5. I will now read out a list of the ways you might have felt or behaved in the past
week. Please tell me how much of the time during the past week:***
(a) … you felt depressed
(b) … you felt that everything you did was an effort (c) … your sleep was restless
(d) … you were happy (e) … you felt lonely (f) … you enjoyed life (g) … you felt sad
(h) … you could not get going (i) … you had a lot of energy (j) … you felt anxious
(k) … you felt tired
(l) … you were absorbed in what you were doing (m) … you felt calm and peaceful
(n) … you felt bored
(o) … you felt really rested when you woke up in the morning
[Response code: 1 – None or almost none of the time, to 4 – All or almost all of the time]
6. How satisfied are you with how your life has turned out so far?
7. How satisfied are you with your present standard of living?
For respondents in paid work
8. All things considered, how satisfied are you with your present job?
9. How satisfied are you with the balance between the time you spend on your
paid work and the time you spend on others aspects of your life? [Response code: 0 – Extremely dissatisfied, to 10 – Extremely satisfied]
*** Items (a) to (h) comprise the short Center for Epidemiologic Studies Depression Scale (CES-D; Radloff, 1977; Steffick, 2000)
10. How much of the time do you find your job: …. interesting?
…. stressful?
[Response code: 0 – None of the time, to 6 – All of the time]
Personal functioning
1. I feel I am free to decide for myself how to live my life.
2. In my daily life I seldom have time to do the things I really enjoy.
3. In my daily life I get very little chance to show how capable I am.
4. I love learning new things.
5. Most days I feel a sense of accomplishment from what I do.
6. I like planning and preparing for the future.
7. When things go wrong in my life, it generally takes me a long time to get back to
normal.
8. I generally feel that what I do in my life is valuable and worthwhile.
[Response code: 1 - Agree strongly, to 5 – Disagree strongly]
9. To what extent do you get a chance to learn new things?
Inter-personal feelings
1. To what extent do you feel that people in your local area help one another?
2. To what extent do you feel that people treat you with respect?
3. To what extent do you feel that people treat you unfairly?
4. To what extent do you feel that you get the recognition you deserve for what
you do?
[Response code: 0 – Not at all, to 6 – A great deal]
5. Considering all my efforts and achievements in my job, I feel I get paid
appropriately.
6. There are people in my life who really care about me.
7. I feel close to the people in my local area.
9. The way things are now, I find it hard to be hopeful about the future of the world. [Response code: 1 - Agree strongly, to 5 – Disagree strongly]
10. How much of the time spent with your immediate family: …. is enjoyable?
…. is stressful?
[Response code: 0 – None of the time, to 6 – All of the time] Inter-personal functioning
How often, if at all, did you do each of the following in the past 12 months:
1. … got involved in work for voluntary or charitable organisations?
2. … not counting anything you do for your family, in your work, or within voluntary
organisations, actively provide help for other people?
3. … help with or attend activities in your local area?
[Response code: 1-At least once a week, 2-At least once a month, 3-At least once every three months, 4-At least once every six months, 5-Less often, 6-Never]
4. If I help someone, I expect some help in return.
Additional items
1. My life involves a lot of physical activity.
[Response code: 1 - Agree strongly, to 5 – Disagree strongly]
2. Do you ever feel frustrated by having watched too much television?
[Response code: 1 - Often, to 5 – Never]
3. How likely would you say it is that you will become unemployed in the next 12
months?
[Response code: 1 – Very likely, to 5 –Not at all likely]
4. How important is it to you to compare your income with other people’s incomes?
[Response code: 0 – Not at all important, to 6 – Very important]
5. Whose income would you be most likely to compare your own with? Please
choose one of the following groups: work colleagues, family members, friends, others.
[[Response code: 1 – Work colleagues, 2 – Family members, 3 – Friends, 4 – Others, 5 – Don’t compare]
Figure 1. Percentage of the population reporting symptoms of depression and low levels of positive affect
0 5 10 15 20 25 30 35 40 45 Hungary Ukraine Portugal Slovakia Russia Bulgaria Poland Estonia Spain Germany Slovenia U K Belgium France Austria Sweden Netherlands Ireland Finland Cyprus Switzerland Denmark Norway
Total Depressive symptoms
Figure 2. Percentage of the population who say they have time to do the things they enjoy (i.e. do not agree to the statement "In my daily life, I seldom have time to do the things I really enjoy".)
0 10 20 30 40 50 60 70 80 9 France Bulgaria Ukraine Estonia Portugal Russia Poland U K Ireland Slovenia Belgium Spain Germany Slovakia Switzerland Sweden Austria Hungary Cyprus Finland Netherlands Norway Denmark Total 0
Figure 3. Percentage of the population who feel they are treated with respect 0 10 20 30 40 50 60 70 80 90 10 Slovakia Ukraine Bulgaria Russia Poland U K Estonia Hungary Slovenia Cyprus Austria France Belgium Finland Germany Ireland Netherlands Portugal Spain Switzerland Sweden Norway Denmark Total 0
Figure 4. Percentage of the population who report doing voluntary work during the past year 0 10 20 30 40 50 60 70 Bulgaria Poland Russia Estonia Hungary Ukraine Slovakia Sweden Portugal France Belgium Slovenia Spain U K Denmark Cyprus Germany Ireland Finland Netherlands Switzerland Austria Norway Total 80 0 10 20 30 40 50 60 70 80 Bulgaria Poland Russia Estonia Hungary Ukraine Slovakia Sweden Portugal France Belgium Slovenia Spain U K Denmark Cyprus Germany Ireland Finland Netherlands Switzerland Austria Norway Total
Table 1.
Conceptual framework for the ESS Well-being Module, and constructs assessed within the four domains
Personal Interpersonal Feeling (having, being) Satisfaction Positive affect Negative affect Optimism Self esteem Belonging Social support Social recognition Societal progress Functioning (doing) Autonomy Competence Interest in learning Goal orientation Sense of purpose Resilience Social engagement Caring Altruism Table 2
The correlation between country rankings for selected well-being items (Spearman correlations; all items coded in a positive direction)
Depressive symptoms Low positive affect Time to do things they enjoy Treated with respect
Low positive affect 0.56*
Time to do things they enjoy
-0.64 -0.41
Treated with respect -0.74 -0.41 0.55
Voluntary work -0.82 -0.56 0.61 0.68
* This value is somewhat inflated, since two of the positive affect items (“you were happy”, “you enjoyed life”) form part of the CES-D (for which they are reverse scored).
Table 3
The relationship between age and gender and selected well-being measures in Europe (average across 23 countries)
Depressive symptoms Low positive affect Time to enjoy things Treated with respect Voluntary work Gender Male 18.0 13.1 65.0 79.8 38.0 Female 26.1 18.8 63.1 81.0 35.9 Age groups < 30 years 16.6 13.2 65.6 77.0 35.9 30 - 44 years 19.0 14.5 57.8 78.9 39.6 45 - 64 years 23.3 16.1 63.0 82.1 39.6 65 and older 32.5 22.2 72.7 83.8 29.4 Total 22.3 16.1 64.0 80.4 36.9