HAL Id: halshs-00607785
https://halshs.archives-ouvertes.fr/halshs-00607785v3
Preprint submitted on 6 Mar 2012
HAL is a multi-disciplinary open access
archive for the deposit and dissemination of sci-entific research documents, whether they are pub-lished or not. The documents may come from teaching and research institutions in France or abroad, or from public or private research centers.
L’archive ouverte pluridisciplinaire HAL, est destinée au dépôt et à la diffusion de documents scientifiques de niveau recherche, publiés ou non, émanant des établissements d’enseignement et de recherche français ou étrangers, des laboratoires publics ou privés.
Ratification Process of the Kyoto Protocol
Alexandre Sauquet
To cite this version:
Alexandre Sauquet. Exploring the Nature of Strategic Interactions in the Ratification Process of the Kyoto Protocol. 2012. �halshs-00607785v3�
Document de travail de la s´erie
Etudes et Documents
E 2011.19
Exploring the Nature of Strategic Interactions in the
Ratification Process of the Kyoto Protocol
Alexandre Sauquet
July, 2011 (revised February 2012)
CERDI
65 BD. F. MITTERRAND
63000 CLERMONT FERRAND - FRANCE TEL. 04 73 71 74 20
FAX 04 73 17 74 28 www.cerdi.org
L’auteur / The author
Alexandre Sauquet
Doctorant / PhD Student
Clermont Universit´e, Universit´e d’Auvergne, CNRS, UMR 6587, CERDI, F-63009
Clermont Fd.
Email : [email protected]
La s´erie des Etudes et Documents du CERDI est consultable sur le site :
http://www.cerdi.org/ed
Directeur de la publication : Patrick Plane
Directeur de la r´edaction : Catherine Araujo Bonjean Responsable d’´edition : Annie Cohade
ISSN : 2114 7957
Avertissement :
Les commentaires et analyses d´evelopp´es n’engagent que leurs auteurs qui restent seuls responsables des erreurs et insuffisances.
R´esum´e / abstract
Do countries interact when they decide whether or not to ratify the Kyoto Pro-tocol? If so, what is the nature of these interactions? To answer these questions,
we provide a theoretical analysis based on the notions of strategic substitutabil-ity and strategic complementarsubstitutabil-ity. Firstly, we analyze the nature of interactions
between countries when they are merely seeking to provide a global public good. Secondly, we argue that countries have ties in several spheres in the real world
and we try to shed light on the nature of the strategic interactions generated by geographic proximity, trade flows, and green investment flows. The empirical
investigation is realized via the estimation of a parametric survival model, and our data sample covers 164 countries for the period from 1998 to 2009. We find
evidence that, while countries’ ratification decisions are originally strategic sub-stitutes, they became strategic complements when we focus on the ratification
decisions of specific peers.
Mots cl´es /Key words : International Environmental Agreements, Kyoto
Proto-col, Ratification, Strategic substitutes/complements, Spatial survival model Codes JEL / JEL codes : C41, F53, H41, Q53, Q56
Remerciements / Acknowledgements
I am grateful to Pascale Combes-Motel, Nelly Exbrayat, Matthias Rieger, Gr´
e-goire Rota-Graziosi and the participants of the doctoral seminar held in Orleans (March 31st and April 1st 2011) for their useful comments. All remaining errors
are my own. I would also thank the ”Conseil Regional d’Auvergne” for their financial support.
1. Introduction
Out of the 1992 United Nations Conference on Environment and Development (or 3rd Earth Summit) in Rio de Janeiro, which gathered 172 governments in order to make
”the difficult decisions needed to ensure a healthy planet for generations to come” (United Nations(1997)), three conventions were born: the United Nations Framework Convention on Climate Change (UNFCCC), the Convention on Biological Diversity and the United Nations Convention to Combat Desertification. At the present time, only the UNFCCC
has given birth to a binding agreement: the Kyoto Protocol (KP). This fact demonstrates the difficulty of achieving consensus among sovereign nations, and highlights the particular
interest we have in understanding the reasons why countries agree to the Kyoto Protocol. Several authors have tried to reveal the role a country’s characteristics may play in
its decision to participate in the KP. For instance Neumayer (2002a) studies the role of democracy level. He finds that democracies are more likely to participate in the KP than
autocracies, as suggested by Congleton (1992), with respect to International Environ-mental Agreements (IEA)1. Fredriksson et al. (2007) and Von Stein (2008) find that the
presence of lobby groups affects the probability of ratifying the Kyoto protocol.
The question of interdependence in ratification decisions has been poorly addressed
in the literature. Yet, the proceeding of climate change negotiations suggests that it could be relevant. For example, the European heads of governments tried to convince
Russia to ratify the KP in order to allow the entry into force of the protocol2,3. By contrast, in the United States, a resolution was adopted by the Senate, which stipulated
that the Congress was not allowed to ratify an agreement in which the United States would have quantitative emission reduction targets while developing countries did not
(Barrett, 1998)4. Following this announcement, Australia, refused to ratify the KP as
1Note that Fredriksson and Gaston(2000) find the same results for the ratification of the UNFCCC. 2See among many newspaper articles from the Guardian by Osborn(2001) and from the New York
Times by Rohter and Revkin(2004).
3Indeed, to enter into force, the protocol had to be ratified by 55 countries representing 55% of
Greenhouse Gas (GHG) in 1990.
well, even though it had initially signed the protocol. This anecdotal evidence suggests that participation in the Kyoto protocol is not an independent decision. Consequently,
the present paper tries to answer the following questions: Do countries interact with each other when they decide whether or not to ratify the Kyoto protocol? If so, what is the
nature of these interactions?
Even if these questions are not addressed in the literature for the KP case, several
authors have tried to measure the presence of interdependencies in environmental treaty participation decisions. Bernauer et al.(2010) study whether the probability of ratification depends on the behavior of similar countries (i.e., they include the share of countries from the same region, income group, that have ratified the agreement in the list of independent
variables). However, this is not a true measure of interactions. Davies and Naughton
(2011) study whether there exists a spatial dependence in the ratification decision process of IEAs. Using a composite index of 247 agreements, these authors investigate whether countries from the same area ratify the same number of agreements, rather than really
demonstrating an effect of a country j ’s decision on a country i ’s one. FinallyBeron et al.
(2003) analyze the ratification of the Montreal protocol. They consider the situation in 1990 and study why countries that ratified the protocol before 1990 did so. They do not find interdependence in the ratification process. However, on the one hand, they make
a cross section analysis, and if there are interactions, they take place over time. On the other hand, they study the Montreal protocol and we are not sure that the participation
of countries in this treaty can be analyzed as a cooperative behavior. Indeed, Murdoch and Sandler (1997) explain that the use of CFC substitutes was probably economically profitable.
Therefore, according to our knowledge, there is no study that precisely measures the
presence or absence of interactions between States when they decide to participate in an IEA, either for the Kyoto Protocol or for any other IEA. Consequently, our contribution
to the literature is to empirically evaluate the presence of interactions between ratification decisions5, and this is done for a major binding agreement, namely the Kyoto Protocol.
The theoretical analysis is based on the notions of strategic substitutability and strategic complementarity. We argue that countries have ties in several spheres in the real world,
and try to shed light on the nature of interactions generated by geographic proximity, trade flows and green investments flows.
The empirical investigation is realized via the introduction of a spatially lagged en-dogenous variable into a duration model, and our data sample covers 164 countries for
the period from 1998 to 2009. We find evidence that the decisions of trade partners, and of green investors, matter.
The rest of the paper is organized in the following manner: we analyze the influence of other countries’ ratification decisions on a country ratification decision in Section 2. In Section 3 we explain how we measure the factors affecting a State’s decision and we present our estimator. Our results are analyzed in Section 4 and finally, in Section 5, we present our conclusion.
2. Analysis of the multiple ties at stake
The interaction between a country and its peers can evolve in two directions. The utility of a country’s contribution to the public good may either (i) decrease with the
contribution of its peers (the contributions thus being strategic substitutes); or (ii) increase with the contribution of its peers (the contributions thus being strategic complements).
In this paper, the contribution to the public good considered is the ratification of a treaty by a country6. We first analyze the likely nature of contributions when a country merely
seeks to provide a global public good. Then, we consider that the ratification could be motivated by other considerations such as neighbor relations, trade relations and the
willingness to host sustainable development projects, e.g., Clean Development Mechanism
to the UN definition, “Upon ratification, the State becomes legally bound under the treaty” (United Nations,2006). See alsoBarrett(1998) for a description of the different stages of the making of a treaty.
6Indeed, we try to understand why countries participate in the KP, not to explain their level of
participation. The latter would have been measured by the decrease in GHG’s emissions, to which
countries committed themselves. For a study on partication level in IEA, see, for example, Bratberg et al.(2005).
(CDM) projects.
2.1. Public good provision
Let us first study how a country is influenced by its peers’ decisions when it merely seeks to provide a global public good, namely preventing climate change. Consider the
utility function of a country “i” represented by Ui(xi, G), where x is the private good and
G the public good. The country chooses to allocate its resources to the provision of the
private good (xi) or the public good (gi). Since in the specific context of climate change,
the emission of z tons of carbon has the same impact whoever emits them, the aggregation technology of contributions is the summation, therefore G = gi +
P
j6=igj. This implies
that i’s contribution and rest-of-world contributions are strategic substitutes (see Cornes and Sandler (1996), p. 144 and Sandler (1998)). Thus, countries will have incentives to let others reduce GHG’s emissions, i.e., to free-ride. This leads us to make our first hypothesis.
Hypothesis 1. The ratification utility of a country “i” is a decreasing function of the participation of the other countries, i.e., participation decisions are strategic substitutes.
Without considering any other participation determinants, it is difficult to explain the formation of an agreement concerning climate change. As underlined by Glazer and Proost (2008), the free-rider problem should deter participation. Furthermore, a large number of theoretical works predict that environmental agreements gathering a relatively
large number of countries are not stable (SeeFinus et al. (2006) for a literature review on this question).
However, we do observe a rise in IEAs. According to Mitchell (2003), more than 700 multilateral agreements and 1000 bilateral agreements exist. Therefore, we argue that
ratification could be motivated by considerations other than the provision of a global public good. We study these alternative motivations in the next subsection.
2.2. Additional ties
“If a small group of people who had an interest in a collective good happened also to be personal friends, or belonged to the same social club, and some of the group left the burden
of providing that collective good on others, they might, even if they gained economically by this course of action, lose socially by it,...” Olson 1965, p. 60.
In the real world, countries are interlinked in several spheres, which could lead them to act as members of a social group. Countries do not attach the same importance to all
countries’ decisions; the importance one country attaches to another’s ratification decision depends upon the former’s ties with the latter. Indeed, as pointed out by Guzman(2008), the participation of a country in an IEA has external consequences. For instance, it could be viewed as a cooperative signal affecting other spheres, such as diplomatic and trade
relations. Moreover, it can be considered that the design of the treaty affects the influence of one country on another, for example, through the green investment flows ensuing from
the Clean Development Mechanism.
2.2.1. The effect of proximity
Geographical proximity often implies cultural similarity, social proximity and economic
interdependencies which result in repeated interactions among countries. This is the first idea advanced by Gleditsch and Ward (2001): “Distance is widely acknowledged to be a primary force shaping the opportunity for interaction among states in the international system.”. This results in diplomatic relations of the utmost importance and leads states
to participate in IEAs even though they do not have immediate incentives or economic interests to do so. Maler (1990) highlights a meaningful example that illustrates this point. He describes the Columbian River Treaty between the US and Canada concerning hydropower generation and flood protection. The negotiations ended with a gain of about
$250 million for Canada and a loss of about $300 million for the United States, one of the US negotiators adding that the growth of Canada was of primary importance for the US.
We argue that strong diplomatic ties between neighboring countries could lead them to ratify an unprofitable environmental agreement in order to maintain those ties. Therefore,
we expect a country will be positively affected by the decision of neighboring countries.
Hypothesis 2. Ratification utility of country “i” and that of its neighbors are strategic complements.
2.2.2. The importance of trade
Let us consider now more economic interdependence, such as that created by trade flows. As pointed out by Neumayer (2002b), we are in a world where we consider that imports mainly benefit the exporter. Therefore, a country aspires to create and maintain a good reputation within the international community if it does not want to face trade
restrictions. In this context, participation in an IEA constitutes a positive signal that enhances a country’s reputation7. This positive signal is also important if a country seeks
to benefit from new preferential trade agreements. On the other hand, several countries fear that the Kyoto Protocol will hamper their competitiveness. The attitude of the US
Senate described in the introduction is now a classic example, but the New Zealand case is also interesting. Yang (2004) detailed the conflict between the Labour-led government and the business lobby. The former wanted a ratification as soon as possible while the latter argued that “New Zealand’s ratification of the Protocol should be conditioned on
its major trading partners’ ratification.”
The three effects described: avoiding trade restrictions, reaching new trade agreements
and avoiding relative competitivity loss, could drive countries to follow the decisions of their trading partners. This leads us to formulate our third hypothesis8.
Hypothesis 3. Ratification utility of country “i” and that of its trading partners are strategic complements.
2.2.3. The CDM role
When a developed country ratifies the Kyoto protocol, it is registered as an Annex 1 country and therefore receives emission reduction targets. To meet these targets, a country
can decrease its carbon emissions on its own territory or resort to a flexibility mechanism, such as the Clean Development Mechanism9. The main rules governing this mechanism
7As shown by Egger et al. (2011) for the case of trade andRose and Spiegel (2009) for the case of
access to credits.
8Note that strategic complementarity may also occur in GHGs emission fall, as shown by Copeland
and Taylor(2005).
9The study of the Joint Implementation mechanism is of limited interest since it began with the first
have been defined at the COP 7 held in Marrakesh in 2001 (Lecocq and Ambrosi, 2007). The principle is to finance an emission-reduction project in a developing country, which
can lead to the creation of saleable certified emission reduction credits10. On the one hand, this mechanism provides developed countries a more flexible way to meet their targets.
On the other hand, it constitutes a great opportunity for developing countries as well. Indeed, one objective of the CDM was to promote sustainable development, through the
financing of new projects and the technological transfers which might ensue11. To host a CDM project, the developing country obviously had to first ratify the KP. Therefore,
we expect that the ratification decision of a developing country will follow that of the developed countries that will fund the CDM projects on its territory.
Hypothesis 4. Ratification utility of country “i” and that of the countries funding CDM projects in its own territory are strategic complements.
3. Empirical strategy
3.1. Data and Measures
To test the hypothesis formulated in the preceding section, we estimate an equation
of the following form:
rit = κ X i6=j rjt+ ϑ X i6=j ωijrjt+ X k ζkXkit+ ηit.
The dependent variable rit takes the value of 1 if country i ratifies during the year
t (as reported by the UNFCCC) and 0 otherwise. The influence of the participation of
other countries j on a country i (the external determinants of ratification) is captured through the parameters κ and ϑ. A set of k control variables X is introduced whose
influence is captured through the ζk parameters. These control variables represent the
internal determinants of the KP ratification, namely the country’s characteristics. ηit is
the remaining error term. Our data sample covers the period from 1998 to 2009 for 164
10Each of them is equivalent to one ton of CO2, and these credits can be used to meet the Kyoto targets
(UNFCCC,2011).
countries. A comprehensive list of the variables, along with their definitions and sources is available in Table 1of the Appendix.
Parameter κ allows us to study the reaction of a country when the number of countries engaged (P
i6=jrjt) increases (variable “Number ratifications”). This will help us to find
out whether or not there is a free-rider problem (driven by a substitutability in ratification decisions).
In order to study strategic complementarities or substitutabilities in ratification deci-sions in the three additional dimendeci-sions described in our theoretical analysis, we borrow
the methodology used in the tax-competition and public spending literature (see Brueck-ner,2003). We estimate a spatial-lag model, where the spatially lagged endogenous vari-able (hereafter ”spatial lag”) is of the form P
i6=jωijrjt. The weighting factor used ωij
measures the intensity of the links between countries i and j and is obviously specific to
each studied sphere. Our weights are normalized (they range from 0 to 100). Their main descriptive statistics can be found in the table 3 of the Appendix.
To evaluate the influence of neighbors’ decision, ωij is defined as
1 d2ij P i6=j 1 d2 ij ∗ 100 where dij is the distance between i’s and j’s capital, provided by the CEPII distance database.
Second, bilateral export flows allows us to estimate the effect of the decision of trading
partners on a country’s decision. ωij is therefore defined as PXij
i6=jXij ∗ 100, where Xij is
the percentage of exports from i to j12. The weighting factor ω
ij corresponds to the part
of exports from i to j in the total exports of i.
Our third weighting factor is the number of registered CDM projects financed by a
developed country j in a developing country i, listed in the CDM pipeline UNEP-RISOE database from 1998 to 2009. Therefore ωij is defined as
Pij
P
i6=jPij ∗ 100, where
P
i6=jPij
is the total number of registered projects in a hosting country at the end of the sample period.
Lastly, following Case et al. (1993) and Lockwood and Migali (2009), we construct a “placebo” weighting scheme that will ensure that the results are not driven by model
12We exploit export data from the UN Comtrade database and X
ij is the mean of available bilateral
misspecification such as omitted common shocks. This weight is constructed as follows: we consider that the first and last countries in alphabetical order are linked (ωij taking
the value of one), then the second and the second to the last are also considered as linked, and so on. We obviously expect a non significant coefficient associated with this spatially
lagged term.
The set of internal determinants first includes the quality of institutions. A country
is considered as “Free” (=3) if the sum of its civil liberty index and its political rights index is below 5 , “Non-Free” (=1) if it is above 10 and “Partly-Free” (=2) otherwise
(variable “Democracy”). Data comes from the Freedom House. Since the ratification of European Union countries was a joint decision, we introduce a dummy when the country
was a member of the EU in 2002 (variable “EU”). We also introduce a dummy variable for Annex 1 countries ( “Annex 1”). The other characteristics of countries are taken
from the World Bank Development Indicator 2010. We introduce the education level of a country, measured by the rate of gross secondary school enrollment (“Education”). We
introduce the GDP per capita and its squared term, in order to take into account the environmental kuznets curve effect (“GDPpercap” and “GDPpercap2”). Finally, following
Neumayer (2002b) and Fredriksson et al. (2007), we introduce the ratio of fuel exports on total export, in order to take into account the lobbying that governments could face
(“Oil exports”).
3.2. Duration issues
We try to explain the number of years a country takes to ratify the KP, from the time
of its opening to ratification in 1998. This requires the use of a duration model. The main advantage of this kind of model for our case is that it allows us to take into account
duration dependence and censoring13,14.
13Technically, we are confronted to single spell data (only one ratification per country) with a
right-censored sample (some countries had not yet ratified the KP at the end of the studied period).
14SeeLancaster(1992),Box-Steffensmeier and Jones(2004) andCleves et al.(2010) for good
introduc-tions to duration models. They are also referred to as transition data, survival model or event-history analysis in the literature.
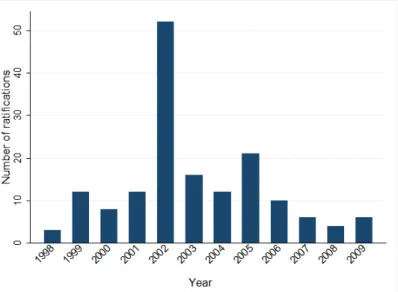
Since we observe yearly ratifications, our scale time is non-continuous and we are confronted to grouped data. Indeed, as shown by Figure 1, the KP is ratified by 17 countries per year on average, with a peak of 54 ratifications in 200215.
[insert Figure 1here]
Therefore, we are confronted with multiple time failure problems, which makes
semi-parametric models like the Cox proportional hazards model inaccurate (see Wooldridge,
2001). This leads us to use a parametric survival model.
The general formulation of a parametric survival model in the proportional hazard metric is as follows:
h(t|xc) = h0(t)exp(β0+ xcβx), (1)
where t is the time scale, c the unit of observation, β0 is a constant and xc a row vector
of independent variables and βx a column vector of coefficients (Cleves et al., 2010). The
hazard rate (h(t|xc)) is the probability that a country i ratifies (rit = 1) during the next
period, considering that it has not yet ratified. The baseline hazard h0(t) is the probability
to ratify that everyone faces, this being modified by the value of the xc, specific to each
individual.
The estimation of a parametric survival model leads us to make an assumption about the baseline hazard distribution h0(t) 16. From a theoretical point of view, any law
repre-senting the distribution of a positive variable can be used to model the distribution of the baseline hazard. Therefore, we calculate the Akaike information criterion17, widely used to
discriminate among the different available laws, to choose between a Weibull, Gompertz,
15This peak can be explained by the adoption of the CDM mechanism through the Marrakesh Accords
in 2001.
16Note that this latter is the counterpart of the error term in standard regressions. The two terms will
be used interchangeably throughout the rest of the paper.
17The Akaike information criterion can be defined as AIC = −2lnL + 2(α + β), where L is the
log-likelihood of the estimation, α the number of explanatory variables and β the number of specific distributions.
log-normal and log-logistic distribution of the baseline hazard. As found by Fredriksson et al. (2007), the hazard rate of the KP ratification process seems to be best represented by a Gompertz distribution, which implies a monotonous evolution of the hazard. With the specification of the baseline hazard as a Gompertz law, we therefore obtain:
h(t|xc) = exp(γt)exp(β0+ xcβx), (2)
Furthermore, since we have panel data, this allows us to control for the unobserved
heterogeneity specific to each individual country. In survival models, this becomes possible with the introduction of a frailty term in the model. The unshared frailty model can be
written as follows:
h(t|xc, αc) = αch(t|xc), (3)
where αc is an unobserved observation-specific effect (Cleves et al. (2010))18. By
specifying a frailty term shared at the country level, we obtain a model analogous to a random-effect model in panel data regressions (Gutierrez (2002)). Our main results will therefore come from the estimation of parametric survival models, with a frailty term shared at the country level.
The shared frailty model can be written as:
h(t|xpf, αf) = αfh(t|xpf), (4)
where f identifies the group of N observations of the same frailty. This model is estimated using maximum likelihood.
3.3. Spatial issues
To measure interdependencies in the ratification process of the Kyoto Protocol, we introduce a spatially lagged endogenous variable in a parametric duration model. This
methodology is similar to the one used by Simmons and Elkins (2004) in their study of
18The distribution of the frailty parameters chosen for its mathematical tractability is the
the spread of liberalization across countries. However, as discussed by Anselin (1988), we could be facing two problems: endogeneity, and spatial error correlation. These two
issues can be treated through the method of moments or maximum likelihood estimation in linear models (see Anselin,2006). Yet, there is no proper estimator for spatial survival model and it is not the scope of this paper to develop it. However, being aware that our model could be subject to the spatial error correlation problem, and endogeneity of the
spatially lagged endogenous variable, we develop several strategies to address this. The presence of spatial error correlation would mean that the model is misspecified and
that there is a correlation between our error terms, which would threaten the properties of the estimator (see Anselin, 2006). Therefore, first, we carefully specify our model and then try to control for correlation between the error terms. We cannot allow spatial error correlation in the way Darmofal (2009) and Banerjee et al. (2003) do. These authors implement (bayesian) parametric spatial survival models, but only for cross-section data. In our case, interactions take place over time and so it is not relevant to investigate them
in a cross section setting. This is the reason why we have decided to control for potential correlation between the error terms, while keeping both our temporal and individual
dimensions. If the results vary when allowing spatial correlation, then misspecification can be suspected. Therefore, we allow for a correlation between the error terms by specifying
a frailty at the continent level, as it is the practice in survival models (Darmofal, 2009). Our strategy to deal with endogeneity is simple. The endogeneity problem comes from
a simultaneity bias, since, at time t, a country is influenced by its neighbors but also influences its neighbors. Therefore we introduce the spatial lags, lagged from one year
instead of the contemporary values of the spatial lags19. This strategy was first applied in a logit model by Dubin (1995,1997) in her studies of technological innovation diffusion.
19Including the variable ”Number ratification”, since it can be seen as a spatial lag with uniform weights
4. Determination of the nature of interactions
4.1. Main results
As previously mentioned, our data sample covers 164 countries for the period from 1998 to 2009. Descriptive statistics on the independent variables are available in Appendix,
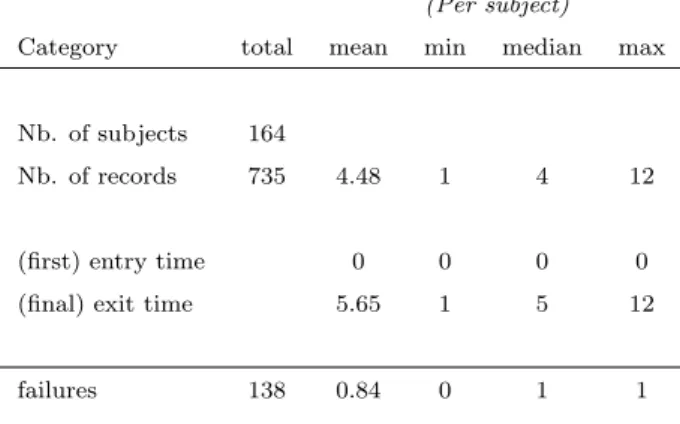
Table 2and3, and the list of countries included in the sample can be found in Table4. A preliminary examination of the descriptive statistics on the dependent variable available in
Table 5shows that 84% of the countries present in our sample ratified the Kyoto protocol before the end of the period studied and that the median country ratifies 5 years after the
opening of the protocol to ratification.
We present our main estimation results in Table6. In column (1) the weighting factor is the distance between capitals, in column (2) the bilateral export flows, in column (3) the number of hosted CDM projects, and in column (4) we used our placebo weight. β
coefficients are reported. A positive coefficient means that an increase in the independent variable increases the probability of ratification20.
[insert table 6here]
First, we find a robust influence of the democracy level. We observe that the probability of ratification increases with the democracy level, which is consistent with former studies
(Fredriksson and Gaston (2000); Neumayer (2002a,b);Von Stein (2008)). We also detect an impact of the oil-lobbies21. The power of the oil-lobbies seems to impede participation,
as found by Fredriksson et al. (2007) andNeumayer (2002b).
20Results from survival models are often presented through hazard ratios. However, in our case, they
lose their interpretation. They cannot be interpreted in a stratified model, such as the one we present in the robustness checks (Cleves et al., 2010). Moreover, in a spatial autoregressive model, the researcher would have to calculate a direct effect and an indirect effect to interpret the coefficients as marginal effects, as described in LeSage and Dominguez (2012) for linear models. It is beyond the scope of this paper to extend the current methodologies for survival models. We will therefore restrain ourselves to the interpretation of the sign, but not the magnitude, of the reported coefficients.
The coefficient associated with the number of involved countries is negative and signif-icant in the four regressions. According to our first hypothesis, this result indicates that
the ratification process of the Kyoto protocol is subject to a free rider problem. Therefore, ratification decisions seem to be strategic substitutes.
However, specifications 3 and 4 indicate that when we take into account the interac-tions with our trade partners or with countries financing CDM projects, the ratification
decisions are strategic complements. Indeed, the coefficient associated with the spatial lag is positive and significant for these two dimensions. Hypothesis 3and 4 are therefore not rejected by the estimations. Interestingly, Hypothesis is not supported by our data. The influence of the decision of a country’s geographic neighbors is not significant. One reason
could be that even if a country has an interest in following a neighbor’s decision in order to maintain diplomatic ties, the country could be eager to build a strategic advantage
compared to a similar geographic neighbor by offering laxer environmental regulations to investors. Another possible explanation is that perhaps the importance of diplomatic
re-lations is nowadays better captured by trade intensity than geographic proximity. Finally, as expected, the coefficient associated with the spatial-lag created thanks to our placebo
matrix is non significant, removing doubt on a potential significance bias of our estimator. Therefore, we find that even if the ratification of the KP is subjected to a free rider
problem, when we study additional dimensions, such as trading relations and the willing-ness to attract green financing, the ratification decisions are strategic complements.
4.2. Robustness checks
To check the strength of our results, we implement several robustness tests. Firstly, we relax the no spatial error correlation assumption, as explained in Section 3.3. Secondly, we distinguish between Annex 1 and Non-Annex 1 countries.
4.2.1. Spatial error correlation
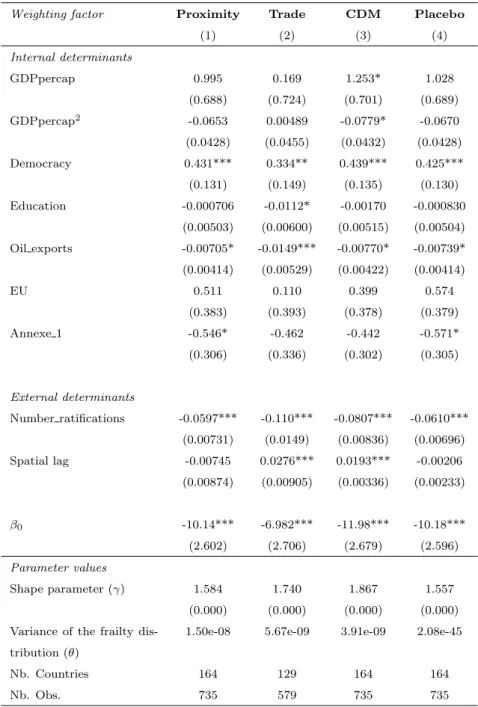
We first control the robustness of our results by specifying a frailty shared at the continent level, as explained in Section 3.3. Results are presented in Table 7.
As we can see, our results are robust to the specification of a frailty term shared at the continent level. Regarding the external determinants, the significance of the
coeffi-cients associated with the spatial-lag term remains unchanged, and the magnitude of these coefficients varies only very slightly. This is also true for the number of involved countries.
This robustness check, therefore, allows us to reject misspecification generated by spatial autocorrelation problem and the omission of important control variables.
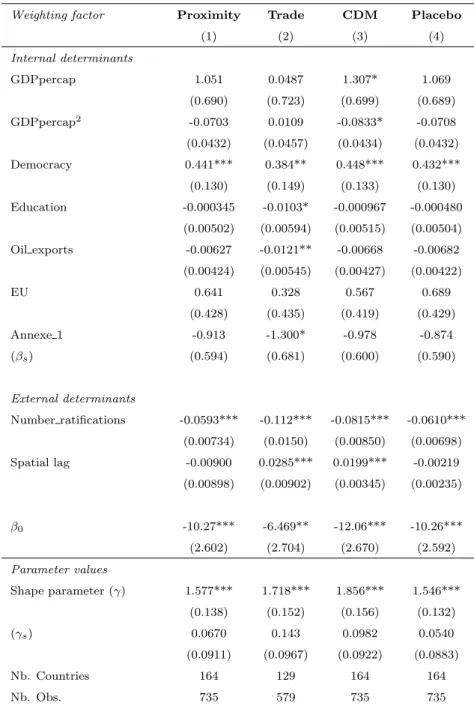
4.2.2. Distinguishing between Annex 1 and Non Annex 1 countries
Countries are differentiated by their status in the Kyoto Protocol. They can either be Annex-1 countries, which means that they face quantitative commitment to reduce
their GHGs emissions, or they can be non-Annex 1, which mainly concerns developing countries. Therefore, following Fredriksson et al. (2007), we can consider that the two groups of countries are in a different dynamic in terms of ratification process. We already make this distinction by introducing a dummy variable equal to 1 if the country is listed
on the Annex 1 of the KP. However, one way to more generally take into account this phenomenon in survival models, is to run a stratified estimation. It implies that both the
model intercept and the shape parameter of the distribution law vary for each value of the strata variable, here “Annex 1”. The baseline hazard, which represent the probability to
ratify that everyone face, has therefore a different shape for the two groups of countries. The stratified proportional hazard model can be written as:
h(t|xc) =
exp(γt)exp(β0+ xcβx) if Annex 1
exp((γ − γs)t)exp((β0− βs) + xcβx) if Non Annex 1
(5)
As a second type of robustness check, we therefore estimate a stratified survival model.
We re-estimated the equations presented in Table 6 and present our new results in Table
8.
[insert table 8here]
Even if the dummy variable “Annex 1” is sometimes significant, the baseline hazard
faced by the two groups of countries does not seem different (γs is never significant).
hazards (h0(t)) of the two groups have the same shape). As our estimates show, results are
therefore not affected by the stratification of the model. Both magnitude and significance
of the coefficients are comparable to the ones found in Tables 6 and 7. We therefore consider that our results are robust.
5. Concluding remarks
The purpose of this work is to examine the interactions between countries’ decisions to ratify an international environmental treaty such as the Kyoto protocol. We offer an
anal-ysis of the nature of interactions between countries, followed by an empirical investigation based on the Kyoto protocol ratification timing.
The findings of this paper have implications both for the theoretical study of the formation of international environmental agreements and for the design of new agreements.
Indeed, there are interactions between countries and they cannot be ignored.
Through our empirical analysis, we find evidence of free riding behavior, which is
consistent with the nature of the public good provided. However, we show that when we study the influence of certain countries, such as trading partners or green investors, the
decision of a country and that of its partners are strategic complements.
Our results imply that the nature of the dilemma countries face when dealing with
climate change, could be altered by the multiple links between countries, i.e., that an agreement gathering a large number of countries can be reached even if it is subjected to
a free rider phenomenon.
The next question is how to use the links among countries highlighted in this work to
increase participation in IEAs. One solution would be to move towards the creation of a multiple treaties system, such as a technology-environment or trade-environment
agree-ment, as pointed byFolmer et al.(1993). A country’s tendency to follow the decision of its trade partners also raises the potential to use commercial sanctions to ensure compliance,
as suggested by Barrett (2003, 2011).
To conclude, this article proposes a framework to understand the formation of
Inter-national Environmental Agreements. It sheds light on important ties that should not be ignored if we want to build a treaty gathering a large number of participants.
References
Anselin, L. (1988). Spatial Econometrics: Methods and Models. Studies in Operational Regional Science. Springer.
Anselin, L. (2006). Spatial Econometrics In T.C. Mills and K. Patterson (Eds.), Palgrave
Handbook of Econometrics: Volume 1: Econometric Theory (pp. 901-969), Palgrave Macmillan, first edition.
Banerjee, S., Gelfand, A. E., & Carlin, B. P. (2003). Hierarchical Modeling and Analysis for Spatial Data. Monographs on Statistics and Applied Probability. Chapman and
Hall/CRC, first edition.
Barrett, S. (1998). On the theory and diplomacy of environmental treaty-making.
Envi-ronmental and Resource Economics, 11(3),317–333.
Barrett, S. (2003). Environment and Statecraft: The Strategy of Environmental
Treaty-Making. Oxford University Press, USA.
Barrett, S. (2011). Rethinking climate change governance and its relationship to the world
trading system. The World Economy, 34(11),1863–1882.
Bernauer, T., Kalbhenn, A., Koubi, V., & Spilker, G. (2010). A comparison of
interna-tional and domestic sources of global governance dynamics. British Journal of Political Science, 40(3),509–538.
Beron, K. J., Murdoch, J. C., & Vijverberg, W. P. M. (2003). Why cooperate? public goods, economic power, and the Montreal protocol. The Review of Economics and
Statistics, 85(2),286–297.
Box-Steffensmeier, J. M., & Jones, B. S. (2004). Event History Modeling: A Guide for
Social Scientists. Analytical Methods for Social Research. Cambridge University Press, first edition.
Bratberg, E., Tjøtta, S., & Øines, T. (2005). Do voluntary international environmental agreements work? Journal of Environmental Economics and Management, 50(3),583 –
597.
Brueckner, J. (2003). Strategic interaction among governments: an overview of empirical
studies. International Regional Science Review, 26(2),175–188.
Case, A. C., Rosen, H. S., & Hines, J. J. (1993). Budget spillovers and fiscal policy interdependence : Evidence from the States. Journal of Public Economics, 52(3),285–
307.
Cleves, M., Gould, W., Gutierrez, R., & Marchenko, Y. (2010). An Introduction to Survival
Analysis Using Stata. Stata Press, third edition.
Congleton, R. D. (1992). Political institutions and pollution control. The Review of
Economics and Statistics, 74(3),412–421.
Copeland, B. R., & Taylor, M. S. (2005). Free trade and global warming: a trade theory
view of the kyoto protocol. Journal of Environmental Economics and Management, 49(2),205 – 234.
Cornes, R., & Sandler, T. (1996). The Theory of Externalities, Public Goods, and Club Goods. Cambridge University Press, second edition.
Darmofal, D. (2009). Bayesian spatial survival models for political event processes. Amer-ican Journal of Political Science, 53(1),241–257.
Davies, R. B., & Naughton, H. T. (2011). Cooperation in environmental policy: A spatial approach. University of Oregon Economics Department Working Papers 2006-18.
Dechezleprˆetre, A., Glachant, M., & M´eni`ere, Y. (2008). The Clean Development Mecha-nism and the international diffusion of technologies: An empirical study. Energy Policy,
Dechezleprˆetre, A., Glachant, M., & M´eni`ere, Y. (2009). Technology transfer by CDM projects: A comparison of Brazil, China, India and Mexico. Energy Policy, 37(2),703–
711.
Dubin, R. (1995). Estimating logit models with spatial dependence.. In L. Anselin, R. J.
G. M. Florax (Eds.), New directions in spatial econometrics (pp. 229-242). Springer, Berlin.
Dubin, R. (1997). A note on the estimation of spatial logit models. Geographical Systems,
4(2),181-193
Egger, P., Jessberger, C., & Larch, M. (2011). Trade and investment liberalization as
determinants of multilateral environmental agreement membership. International Tax and Public Finance, 18(6),605–633.
Finus, M., Ierland, E., & Dellink, R. (2006). Stability of climate coalitions in a cartel formation game. Economics of Governance, 7(3),271–291.
Folmer, H., Mouche, P. V., & Ragland, S. (1993). Interconnected games and international environmental problems. Environmental and Resource Economics, 3(4),313–335.
Fredriksson, P. G., & Gaston, N. (2000). Ratification of the 1992 climate change conven-tion: What determines legislative delay? Public Choice, 104(3-4),345–68.
Fredriksson, P. G., Neumayer, E., & Ujhelyi, G. (2007). Kyoto protocol cooperation: Does government corruption facilitate environmental lobbying? Public Choice, 133(1),231–
251.
Glazer, A., & Proost, S. (2008). Informational benefits of international environmental
agreements. Open Access publications from Katholieke Universiteit Leuven, (Number 123456789/183997).
Gleditsch, K., & Ward, M. (2001). Measuring space: a minimum distance database and applications to international studies. Journal of Peace Research, 38(6),739–756.
Grubb, M., Laing, T., Counsell, T., & Willan, C. (2011). Global carbon mechanisms: lessons and implications. Climatic Change, 104(3-4),539–573.
Gutierrez, R. G. (2002). Parametric frailty and shared frailty survival models. Stata Journal, 2(1),22–44.
Guzman, A. T. (2008). How international law works: A rational choice theory. Oxford
and New York: Oxford University Press.
Lancaster, T. (1992). The Econometric Analysis of Transition Data. (Econometric Society
Monographs). Cambridge University Press.
Lecocq, F., & Ambrosi, P. (2007). The Clean Development Mechanism: History, status,
and prospects. Review of Environmental Economics and Policy, 1(1),134–151.
LeSage, J., & Dominguez, M. (2012). The importance of modeling spatial spillovers in
public choice analysis. Public Choice, 150(3-4),525–545.
Lockwood, B., & Migali, G. (2009). Did the single market cause competition in excise
taxes? evidence from EU countries. Economic Journal, 119(536),406–429.
Maler, K.-G. (1990). International environmental problems. Oxford Review of Economic
Policy, 6(1),80–108.
Mitchell, R. B. (2003). International environmental agreements: A survey of their features,
formation, and effects. Annual Review of Environment and Resources, 28(1),429–461.
Murdoch, J. C., & Sandler, T. (1997). The voluntary provision of a pure public good: The
case of reduced CFC emissions and the Montreal protocol. Journal of Public Economics, 63(3),331–349.
Neumayer, E. (2002a). Do democracies exhibit stronger international environmental com-mitment? A cross-country analysis. Journal of Peace Research, 39(2),139–164.
Neumayer, E. (2002b). Does trade openness promote multilateral environmental cooper-ation? The World Economy, 25(6),815–832.
Osborn, A. (2001). Europe should now push Kyoto. The Guardian, April 6.
Rohter, L., & Revkin, A. C. (2004). Cheers, and concern, for new climate pact. The New
York Time, December 13.
Rose, A. K., & Spiegel, M. M. (2009). Noneconomic engagement and international ex-change: The case of environmental treaties. Journal of Money, Credit and Banking,
41(2-3),337–363.
Sandler, T. (1998). Global and regional public goods: a prognosis for collective action.
Fiscal Studies, 19(3),221–247.
Simmons, B. A., & Elkins, Z. (2004). The globalization of liberalization: Policy diffusion in
the international political economy. American Political Science Review, 98(1),171–189.
UNFCCC (2011). Clean Development Mechanism (CDM). United Nations Framework
Convention on Climate Change official website.
United Nations (1997). UN Conference on Environment and Development (1992). Brief
notes.
United Nations (2006). Treaty Handbook. United Nations publication.
Von Stein, J. (2008). The international law and politics of climate change: Ratification of the united nations framework convention and the kyoto protocol. Journal of Conflict
Resolution, 52(2),243–268.
Wooldridge, J. M. (2001). Econometric Analysis of Cross Section and Panel Data. The
MIT Press, first edition.
Yang, J. (2004). New-Zealand and the Kyoto protocol: Ideals, interests and politics. New
Appendix
Table 1: Source and definition of the variables
Variable Definition Source
Dependent variable
Ratification (rit) Dummy variable equal to 1 if country i ratifies
during year t.
UNFCCC website
Spatial lag weights
Proximity Distance in kilometers between two capitals. CEPII Trade Mean of available bilateral exports flows for
the sample period, in current dollars.
UN Comtrade
CDM Number registred CDM projects from 1998 to 2009.
UNEP-RISOE database
Internal Factors
Democracy The country is considered as ”Free” (=3) if the sum of its civil liberty index and its political right index is below 5 , ”Non-Free” (=1) if it is above 10 and ”Partly-Free” (=2) otherwise.
Freedom House
GDPpercap / GDPpercap2 Logarithm of GDP per capita, in PPA, dollars
2000.
World Development Indi-cator 2010
Oil exports Ratio of fuel exports on total exports. World Development Indi-cator 2010
Education Gross secondary school enrollment in percent. World Development Indi-cator 2010
Annex 1 Dummy variable equal to 1 if a country is reg-istered on the Annex 1 of the Kyoto Protocol.
UNFCCC website
EU Dummy variable equal to 1 if the country was a member of the European Union in 2002.
Official website of the Eu-ropean Union
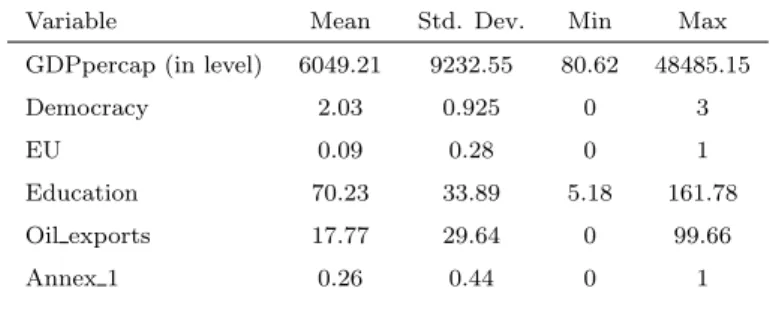
Table 2: Descriptive statistics on the independent variables
Variable Mean Std. Dev. Min Max GDPpercap (in level) 6049.21 9232.55 80.62 48485.15 Democracy 2.03 0.925 0 3
EU 0.09 0.28 0 1
Education 70.23 33.89 5.18 161.78 Oil exports 17.77 29.64 0 99.66 Annex 1 0.26 0.44 0 1
Table 3: Descriptive statistics on the spatially lagged variables
Weighting factor Mean Std. Dev. Min Max Distance 24.98 23.25 0.2574998 93.36 Trade 28.04 34.99 0 99.01 CDM 9.32 28.62 0 100 Placebo 32.30 46.80 0 100
Table 4: List of countries
164 countries included in the estimation sample
Albania Comoros Hungary Mauritius South Africa Algeria Congo, Dem. Rep. Iceland Mexico Spain Angola Congo, Rep. India Moldova Sri Lanka
Argentina Costa Rica Indonesia Mongolia St. Kitts and Nevis Armenia Cote d’Ivoire Iran, Islamic Rep. Morocco St. Lucia
Aruba Croatia Iraq Mozambique St. Vinc. & the Grenadines Australia Cyprus Ireland Namibia Sudan
Austria Czech Republic Israel Nepal Suriname Azerbaijan Denmark Italy Netherlands Swaziland Bahamas, The Djibouti Jamaica New Zealand Sweden Bahrain Dominica Japan Nicaragua Switzerland
Bangladesh Dominican Republic Jordan Niger Syrian Arab Republic Belarus Ecuador Kazakhstan Nigeria Tanzania
Belgium Egypt, Arab Rep. Kenya Norway Thailand Belize El Salvador Kiribati Oman Togo Benin Equatorial Guinea Korea, Rep. Pakistan Tonga
Bhutan Eritrea Kuwait Panama Trinidad and Tobago Bolivia Estonia Kyrgyz Republic Paraguay Tunisia
Bosnia and Herzegovina Ethiopia Lao PDR Peru Turkey Botswana Fiji Latvia Philippines Uganda Brazil Finland Lebanon Poland Ukraine
Brunei Darussalam France Lesotho Portugal United Arab Emirates Bulgaria Gabon Liberia Romania United Kingdom Burkina Faso Gambia, The Libya Russian Federation United States Cambodia Georgia Lithuania Rwanda Uruguay Cameroon Germany Luxembourg Samoa Uzbekistan Canada Ghana Macedonia, FYR Saudi Arabia Vanuatu Cape Verde Greece Malawi Senegal Venezuela, RB Central African Republic Grenada Malaysia Seychelles Vietnam Chad Guatemala Maldives Sierra Leone Yemen, Rep. Chile Guinea Mali Slovak Republic Zambia China Guinea-Bissau Malta Slovenia Zimbabwe Colombia Guyana Mauritania Solomon Islands
Table 5: Ratification timing description
(Per subject) Category total mean min median max
Nb. of subjects 164
Nb. of records 735 4.48 1 4 12
(first) entry time 0 0 0 0 (final) exit time 5.65 1 5 12
Figures
Figure 1: Number of countries ratifying the Kyoto protocol by year, from 1998 to 2009.
Tables
Table 6: Estimation results of the probability to ratify the KP
Weighting factor Proximity Trade CDM Placebo (1) (2) (3) (4) Internal determinants GDPpercap 1.099 0.791 1.273* 1.130 (0.752) (0.986) (0.724) (0.753) GDPpercap2 -0.0726 -0.0309 -0.0795* -0.0743 (0.0471) (0.0612) (0.0448) (0.0471) Democracy 0.437*** 0.326* 0.442*** 0.435*** (0.141) (0.194) (0.138) (0.141) Education 0.000318 -0.0130* -0.00127 0.000110 (0.00548) (0.00785) (0.00535) (0.00549) Oil exports -0.00659 -0.0154** -0.00725* -0.00666 (0.00434) (0.00642) (0.00434) (0.00433) EU 0.551 0.200 0.405 0.594 (0.421) (0.526) (0.392) (0.419) Annexe 1 -0.627* -0.624 -0.471 -0.638* (0.335) (0.432) (0.316) (0.330) External determinants Number ratifications -0.0635*** -0.144*** -0.0815*** -0.0641*** (0.00597) (0.0110) (0.00584) (0.00444) Spatial lag -0.00398 0.0473*** 0.0191*** -0.00163 (0.00974) (0.00994) (0.00324) (0.00242) β0 -10.87*** -10.20*** -12.19*** -10.95*** (2.853) (3.736) (2.778) (2.857) Parameter values Shape parameter (γ) 1.687 2.188 1.907 1.676101 (0.000) (0.000) (0.000) (0.000) Variance of the frailty
dis-tribution (θ)
0.172 0.862 0.057 0.174
Nb. Countries 164 129 164 164
Nb. Obs. 735 579 735 735
Notes: ***=significant at the 1 percent level, **=significant at the 5 percent level, *=significant at the 10 percent level. Standard errors associated to the reported coefficients and parameter values are in parentheses.
Table 7: Estimation results with spatial frailty
Weighting factor Proximity Trade CDM Placebo (1) (2) (3) (4) Internal determinants GDPpercap 0.995 0.169 1.253* 1.028 (0.688) (0.724) (0.701) (0.689) GDPpercap2 -0.0653 0.00489 -0.0779* -0.0670 (0.0428) (0.0455) (0.0432) (0.0428) Democracy 0.431*** 0.334** 0.439*** 0.425*** (0.131) (0.149) (0.135) (0.130) Education -0.000706 -0.0112* -0.00170 -0.000830 (0.00503) (0.00600) (0.00515) (0.00504) Oil exports -0.00705* -0.0149*** -0.00770* -0.00739* (0.00414) (0.00529) (0.00422) (0.00414) EU 0.511 0.110 0.399 0.574 (0.383) (0.393) (0.378) (0.379) Annexe 1 -0.546* -0.462 -0.442 -0.571* (0.306) (0.336) (0.302) (0.305) External determinants Number ratifications -0.0597*** -0.110*** -0.0807*** -0.0610*** (0.00731) (0.0149) (0.00836) (0.00696) Spatial lag -0.00745 0.0276*** 0.0193*** -0.00206 (0.00874) (0.00905) (0.00336) (0.00233) β0 -10.14*** -6.982*** -11.98*** -10.18*** (2.602) (2.706) (2.679) (2.596) Parameter values Shape parameter (γ) 1.584 1.740 1.867 1.557 (0.000) (0.000) (0.000) (0.000) Variance of the frailty
dis-tribution (θ)
1.50e-08 5.67e-09 3.91e-09 2.08e-45
Nb. Countries 164 129 164 164
Nb. Obs. 735 579 735 735
Notes: ***=significant at the 1 percent level, **=significant at the 5 percent level, *=significant at the 10 percent level. Standard errors associated to the reported coefficients and parameter values are in parentheses.
Table 8: Estimation results with Annex statification
Weighting factor Proximity Trade CDM Placebo (1) (2) (3) (4) Internal determinants GDPpercap 1.051 0.0487 1.307* 1.069 (0.690) (0.723) (0.699) (0.689) GDPpercap2 -0.0703 0.0109 -0.0833* -0.0708 (0.0432) (0.0457) (0.0434) (0.0432) Democracy 0.441*** 0.384** 0.448*** 0.432*** (0.130) (0.149) (0.133) (0.130) Education -0.000345 -0.0103* -0.000967 -0.000480 (0.00502) (0.00594) (0.00515) (0.00504) Oil exports -0.00627 -0.0121** -0.00668 -0.00682 (0.00424) (0.00545) (0.00427) (0.00422) EU 0.641 0.328 0.567 0.689 (0.428) (0.435) (0.419) (0.429) Annexe 1 -0.913 -1.300* -0.978 -0.874 (βs) (0.594) (0.681) (0.600) (0.590) External determinants Number ratifications -0.0593*** -0.112*** -0.0815*** -0.0610*** (0.00734) (0.0150) (0.00850) (0.00698) Spatial lag -0.00900 0.0285*** 0.0199*** -0.00219 (0.00898) (0.00902) (0.00345) (0.00235) β0 -10.27*** -6.469** -12.06*** -10.26*** (2.602) (2.704) (2.670) (2.592) Parameter values Shape parameter (γ) 1.577*** 1.718*** 1.856*** 1.546*** (0.138) (0.152) (0.156) (0.132) (γs) 0.0670 0.143 0.0982 0.0540 (0.0911) (0.0967) (0.0922) (0.0883) Nb. Countries 164 129 164 164 Nb. Obs. 735 579 735 735
Notes: ***=significant at the 1 percent level, **=significant at the 5 percent level, *=significant at the 10 percent level. Standard errors associated to the reported coefficients and parameter values are in parentheses.