HAL Id: hal-02988104
https://hal.sorbonne-universite.fr/hal-02988104
Submitted on 4 Nov 2020
HAL is a multi-disciplinary open access
archive for the deposit and dissemination of
sci-entific research documents, whether they are
pub-lished or not. The documents may come from
teaching and research institutions in France or
abroad, or from public or private research centers.
L’archive ouverte pluridisciplinaire HAL, est
destinée au dépôt et à la diffusion de documents
scientifiques de niveau recherche, publiés ou non,
émanant des établissements d’enseignement et de
recherche français ou étrangers, des laboratoires
publics ou privés.
differentiation and activation specifically in inguinal
subcutaneous white adipose tissue
Marianne Bléher, Berbang Meshko, Isabelle Cacciapuoti, Rachel Gergondey,
Yoann Kovacs, Delphine Duprez, Aurore L’honoré, Emmanuelle Havis
To cite this version:
Marianne Bléher, Berbang Meshko, Isabelle Cacciapuoti, Rachel Gergondey, Yoann Kovacs, et al..
Egr1 loss-of-function promotes beige adipocyte differentiation and activation specifically in inguinal
subcutaneous white adipose tissue.
Scientific Reports, Nature Publishing Group, 2020, 10 (1),
Egr1 loss‑of‑function promotes
beige adipocyte differentiation
and activation specifically
in inguinal subcutaneous white
adipose tissue
Marianne Bléher
1,5, Berbang Meshko
1,5, Isabelle Cacciapuoti
4, Rachel Gergondey
1,3,
Yoann Kovacs
1,3, Delphine Duprez
1,2, Aurore L’Honoré
1,3,6& Emmanuelle Havis
1,2,6*In mice, exercise, cold exposure and fasting lead to the differentiation of inducible-brown adipocytes, called beige adipocytes, within white adipose tissue and have beneficial effects on fat burning and metabolism, through heat production. This browning process is associated with an increased expression of the key thermogenic mitochondrial uncoupling protein 1, Ucp1. Egr1 transcription factor has been described as a regulator of white and beige differentiation programs, and Egr1 depletion is associated with a spontaneous increase of subcutaneous white adipose tissue browning, in absence of external stimulation. Here, we demonstrate that Egr1 mutant mice exhibit a restrained Ucp1 expression specifically increased in subcutaneous fat, resulting in a metabolic shift to a more brown-like, oxidative metabolism, which was not observed in other fat depots. In addition, Egr1 is necessary and sufficient to promote white and alter beige adipocyte differentiation of mouse stem cells. These results suggest that modulation of Egr1 expression could represent a promising therapeutic strategy to increase energy expenditure and to restrain obesity-associated metabolic disorders.
White adipose tissue (WAT) plays a crucial role in energetic homeostasis regulation through the storage of excess energy in the large central vacuole of white adipocytes1. WAT also performs metabolic functions and secretes
several hormones such as Resistin (Retn)1–3 and Leptin (Lep) which regulates body weight, lipid and glucose
metabolism4–6. WAT is located in diverse sites throughout the body, such as the subcutaneous inguinal
(SC-WAT), perigonadal (GAT), mesenteric (MAT) and perirenal (PAT) depots7,8. While these depots are collectively
named white adipose tissue, they have different developmental origins: SC-WAT, GAT and MAT derive from lateral plate mesoderm in female mice whereas PAT derive from the somitic mesoderm8. These different origins
could contribute to differences in the physiology of fat depots.
In contrast, brown adipose tissue (BAT) has a critical thermogenic function thanks to its property to dis-sipate excess energy through heat production9. BAT depots are derived from the somitic mesoderm8 and are
located in the inter-scapular region in mice and in both neck and supraclavicular regions in humans9. Brown
adipocytes are smaller than white adipocytes. They exhibit multiple small lipid vacuoles and large number of mitochondria involved in heat production through the constitutive activation of the thermogenic uncoupling protein 1 (Ucp1)10–12.
A third type of adipocyte, called beige adipocyte, has been described within WAT 9,13. Morphological and
transcriptomic analyses show that brown and beige adipocytes are remarkably similar and express the same thermogenic markers, including Ucp114. In mice, beige adipocytes differentiation occurs in response to long
open
1Sorbonne Université, 75005 Paris, France. 2Institute of Biology Paris Seine-Developmental Biology Laboratory,
Inserm U1156, French National Centre for Scientific Research (CNRS) UMR7622, 75005 Paris, France. 3Institute of
Biology Paris Seine-Integrative Cellular Ageing and Inflammation, French National Centre for Scientific Research (CNRS) UMR8256, 75005 Paris, France. 4Inovarion, Paris, France. 5These authors contributed equally: Marianne
Bléher and Berbang Meshko. 6These authors jointly supervised this work: Aurore L’Honoré and Emmanuelle
term cold exposition, fasting or exercise through a process referred to as browning9,15. White, beige and brown
adipocytes have been shown to differentiate in vitro from adipose-derived mesenchymal stem/stromal cells (ASC) isolated from lipoaspirates16–19. In this context, we previously demonstrated that mice lacking Egr1 expression
exhibit spontaneous browning of the inguinal subcutaneous white adipose tissue without external stimulation20.
Egr1 is a multi-faceted transcription factor involved in the development and homeostasis of several organs20–23.
Increased Egr1 expression has been linked to obesity in both humans and murine models22,23. In contrast, Egr1
knock-out mice display an increased energy expenditure and are protected from high fat diet-induced obesity and obesity-associated pathologies23,24. The browning of Egr1−/− mice is associated with up-regulation of beige
adipocyte gene expression such as Ucp1, Cebpb, Cidea and Cox8b, together with a decreased expression of the white adipocyte marker Lep. Egr1 transcription factor can alternatively acts as a repressor or an activator depending of its interacting partners21. In this context, we previously showed that in SC-WAT, both Ucp1 and
Cebpb expressions are repressed by Egr1 through direct binding to their promoters20. Loss of Egr1 can therefore
spontaneously induce SC-WAT browning through the release of this repression and the consequent activation of beige differentiation by Ucp1 and Cebpb20. In this study, we get further to first analyze the consequences of Egr1
knock-out on Ucp1 expression in all adipose tissue depots. Then, we tested whether Ucp1 up-regulation in WAT comes with a shift to a BAT-like oxidative metabolism. Interestingly, we observed that Ucp1 up-regulation in mutant Egr1−/− adipose tissue was restricted to subcutaneous inguinal SC-WAT and associated with an increased
oxygen consumption rate in this fat pad. To further characterize the role of Egr1 in SC-WAT browning, adipose stem cells (mASC) were isolated from control Egr1+/+ and mutant Egr1−/− SC-WAT and compared for their ability
to differentiate into white or beige adipocytes in vitro. We observed that Egr1 was necessary to promote white adi-pocyte differentiation and repress beige differentiation of mASC. Egr1 gain-of-function experiments performed in C3H10T1/2 mesenchymal stem cells confirmed the positive role of Egr1 on white adipocyte differentiation and its negative role on beige differentiation. Collectively, our results indicate that Egr1 favors white adipocyte differentiation and represses SC-WAT browning. Egr1 may thus become a promising target to combat obesity.
Results and discussion
Egr1
−/−mice display spontaneous increase of Ucp1 expression specifically in SC-WAT .
Egr1 loss-of-function in postnatal and 4-month-old mice leads to a reduced body weight despite similar weight of SC-WAT fat pads in control Egr1+/+ and mutant Egr1−/− mice20. Significant body weight reduction wascon-firmed in 8-month-old Egr1-/- mice (Fig. 1A). In addition, all isolated white subcutaneous (SC-WAT), gonadic
(GAT), mesenteric (MAT) and perirenal (PAT) and brown (BAT) fat pads display similar percentage of body weight in control Egr1+/+ and mutant Egr1-/- mice (Fig. 1B, C). These observations indicate that lower body
weight observed in mutant Egr1-/- mice is not due to a reduced adipose tissue mass, and suggest that Egr1
loss-of-function reduces body weight through unknown global metabolic processes. Egr1 loss-loss-of-function has been shown to induce spontaneous browning of SC-WAT, associated with increased Ucp1 expression, without exter-nal stimulation20. Here, we quantified the expression of Egr1, Cebpb, Pparg, Ucp1, Lep and Dcun1d3 in five
dif-ferent adipose tissue depots from control Egr1+/+ and Egr1−/− mice. As expected, Egr1 was nearly undetectable
in mutant Egr1-/- fat pads (Fig. 2A, Supplementary Figs. 1 and 2A–C). A significant increase of Cebpb and Ucp1
expression was observed in mutant Egr1−/− SC-WAT compared to control, associated with a decrease of Lep
expression (Fig. 2A). In contrast, Cebpb, Ucp1 and Lep expression were not altered in the other 4 fat pads in mutant versus control (Supplementary Fig. 1 and 2A–C) except in MAT in which Lep expression was lower in mutants. These observations are consistent with previous results showing the absence of spontaneous brown-ing in BAT and GAT from Egr1-deleted mice23. Our results indicate that Egr1 deficiency induces a browning
phenotype restricted to SC-WAT, and suggest that Egr1 is required to repress SC-WAT browning in standard housing conditions. SC-WAT browning in mutant Egr1−/− mice is characterized by an increased number of beige
adipocytes at the expense of white adipocytes20. Taken together, our results suggest that Egr1 represses Cebpb,
Ucp1 and activates Lep expression in SC-WAT, which is in accordance with previous results showing recruitment
of Egr1 to their promoters20,25. Decreased Lep expression in MAT depot in Egr1-null mice (MAT, Supplementary
Fig. 2B) suggests that Egr1 can activate Lep independently of the browning phenotype. At last, as previously observed, Pparg expression was not affected by Egr1 loss-of-function in SC-WAT 20 neither in the 4 other fat pads
(Fig. 2A, Supplementary Figs. 1 and 2A–C).
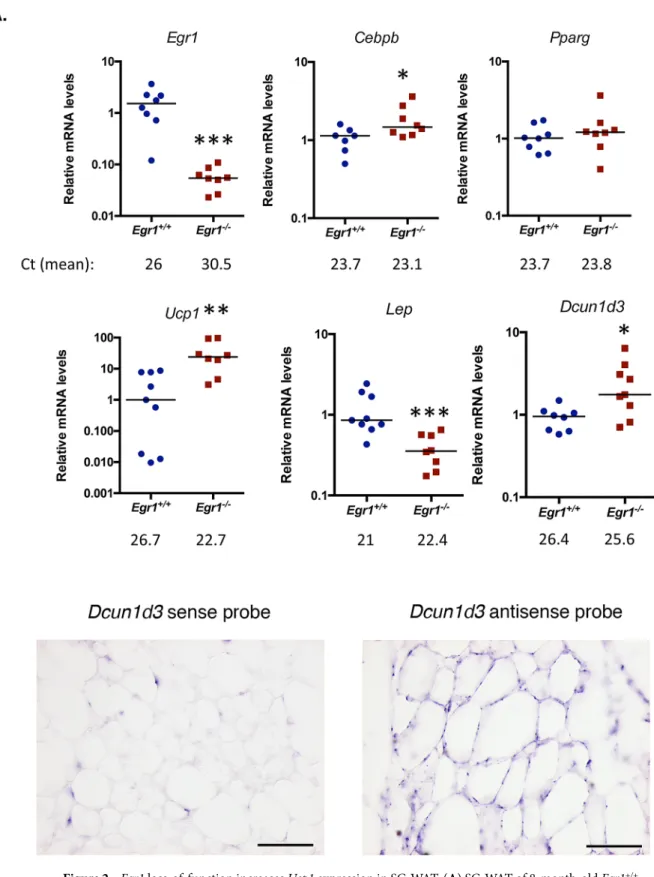
Dcun1d3 has been shown upregulated in mutant Egr1-/- SC-WAT 20. Dcun1d3 is expressed in adipocytes
within adipose tissue (Fig. 2B), however its role has not been elucidated yet. While Dcun1d3 was present in all adipose depots in controls (Fig. 2A, Supplementary Fig. 1 and 2A–C), its expression was specifically upregulated in Egr1-deficient SC-WAT (Fig. 2A, Fig. 2A, Supplementary Figs. 1 and 2A–C). This suggests that Dcun1d3 may be related to SC-WAT browning in mutant Egr1−/− mice.
Taken together, these results indicate that Egr1 loss-of-function increases Cebpb, Ucp1 and Dcun1d3 expres-sion and decreases Lep expresexpres-sion in SC-WAT, resulting in spontaneous browning in this specific adipose tissue depot. One hypothesis could be that Egr1 interacts with specific co-regulators in fat pads, leading to the regula-tion of different genetic programs in each depot. The co-factors allowing Egr1 to regulate the browning program might be specifically expressed in SC-WAT.
Egr1 loss-of-function induces a metabolic shift in white adipose tissue, leading to a BAT-like
oxidative metabolism.
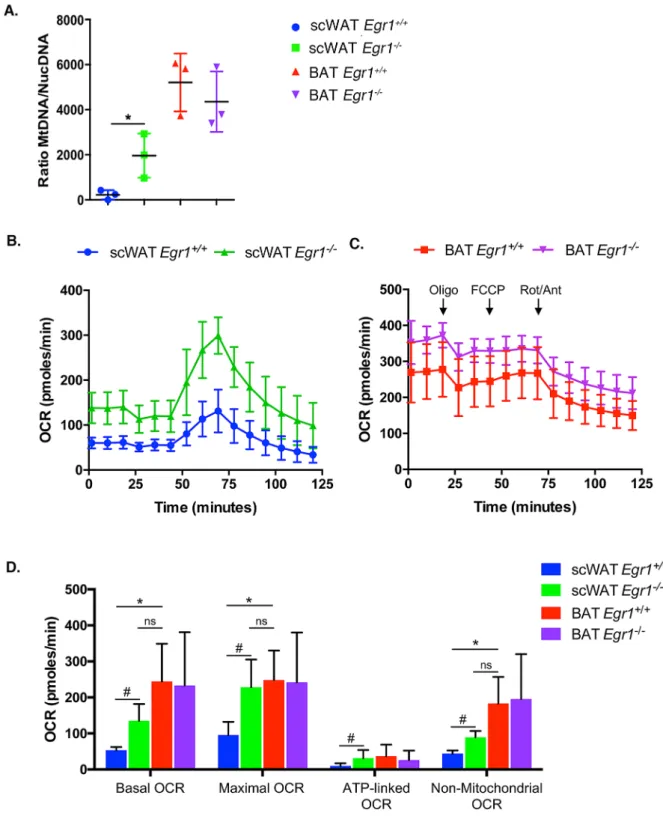
We then investigated whether the brown transcriptomic signature observed in mutant Egr1−/− SC-WAT was correlated with metabolic modifications. While control Egr1+/+ SC-WAT ischar-acterized by a low mitochondrial mass, marked by a low mitochondrial/nuclear DNA ratio, we observed an increased mitochondrial mass in mutant SC-WAT (Fig. 3A), with a ratio being much similar to that of BAT. Such increase is specific to this tissue and was not observed in any other tested fat tissues (Supplementary Fig. 3).
To examine whether this increased mitochondrial mass has functional metabolic consequences, we assessed oxygen consumption rate (OCR) of BAT, SC-WAT and GAT freshly dissected from control and mutant mice. Using Seahorse XFe24 analyzer, we showed that while Egr1 loss-of-function does not affect GAT (Supplemen-tary Fig. 3B, C) or BAT OCR (Fig. 3B, C, D), it leads to an increase of all markers of oxidative capacity, including basal and maximal OCR, ATP-linked OCR and non-mitochondrial OCR. Importantly, all rates quantified in mutant Egr1−/− SC-WAT were close to that obtained with BAT, demonstrating a metabolic shift of Egr1−/−
SC-WAT towards a BAT-like oxidative metabolism. As expected, this increase of oxidative capacity does not lead to altered ROS production, as indicated by similar carbonylation protein levels (Supplementary Fig. 3D), thus demonstrating that the browning process observed in Egr1 mutant occurs in physiological conditions.
Our previous study has revealed a spontaneous browning of the SC-WAT in Egr1 mutant, with Ucp1 expres-sion being up-regulated in absence of external stimulation20. We now show that this browning also exerts at
physiological level with consequences on metabolic and bio-energetic activity of SC-WAT. Our results reveal a shift of Egr1-/- SC-WAT towards a BAT-like oxidative metabolism and are correlated with previous studies
estab-lishing a link between increased Egr1 expression and obesity22,23. They suggest a central role of Egr1 in regulation
of SC-WAT homeostasis in the adult.
Egr1 is necessary to promote white and to repress beige adipocyte differentiation of mouse
adipose stem cells.
To further analyze the role of Egr1 in spontaneous browning of SC-WAT in mutants, we tested whether Egr1 loss-of-function can alter the differentiation of SC-WAT-derived mouse adipose stem Figure 1. Egr1 loss-of-function does not affect fat pad percentage of body weight. (A) Whole body, (B) Brown adipose tissue (BAT), (C) Inguinal sub-cutaneous adipose tissue (SC-WAT), gonadal adipose tissue (GAT), mesenteric adipose tissue (MAT) and perirenal adipose tissue (PAT) of 8-month-old Egr1+/+ and Egr1−/− femalemice were weighted. Fat pad weights were represented as a percentage of body weight. Experiments were performed with n = 4 for each genotype. Error bars represent the mean + /− standard deviations. The p values were obtained using the Student t test, with *p < 0.05.
Figure 2. Egr1 loss-of-function increases Ucp1 expression in SC-WAT. (A) SC-WAT of 8-month-old Egr1+/+
and Egr1-/− mice were used for RNA purification. RNA samples were analysed by RT-qPCR for Egr1, Cebpb, Pparg, Ucp1, Lep and Dcun1d3 expression. Experiments were performed with n = 8 animals for each genotype.
Transcripts are shown relative to the level of Rp18S transcripts, with control Egr1+/+ being normalized to 1. The
relative mRNA levels were calculated using the 2−∆∆Ct method. The p values were obtained using the
Mann-Withney test, with *p < 0.05, **p < 0.01, ***p < 0.001. (B) SC-WAT from wild-type mice was longitudinally cryosectioned. 8 µm sections were hybridized with the DIG-labeled sense and antisense probes for Dcun1d3. Scale bars: 100 µm.
Figure 3. Egr1 loss-of-function induces a metabolic shift in white adipose tissue, leading to a BAT-like oxidative metabolism. (A) WAT and BAT of 8-month-old control Egr1+/+ and mutant Egr1−/− female mice were dissected
and used for DNA purification. Mitochondrial (Cyt B) and nuclear (Ndufv1) genes were quantified by qPCR and histogram represents their ratio. Error bars represent the means + standard deviations with n = 3 animals for each genotype, *p < 0.05. (B, C) Mitochondrial respiration measured by oxygen consumption rate (OCR) in basal conditions and after sequential addition of Oligomycin, FCCP, and a mix of Rotenone/Antimycin were simultaneously recorded on SC-WAT (B) and BAT (C) tissues, freshly dissected from 8-month-old control
Egr1+/+ and mutant Egr1−/− female mice. (D) Histogram represents the basal OCR (determined as the difference
between OCR before oligomycin and OCR after rotenone/antimycin A), maximal OCR (difference between OCR after FCCP and OCR after rotenone/antimycin A), ATP-linked OCR (difference between OCR before and after oligomycin), and the non-mitochondrial OCR (OCR after rotenone and antimycin A treatment) calculated from data obtained in A. Error bars represent the means + standard deviations with n = 3 animals for each genotype, *p < 0.05.
cells (mASC) into white and beige adipocytes. mASC were isolated from inguinal SC-WAT of control Egr1+/+
and mutant Egr1−/− mice and subjected to white (Fig. 4A, B) or beige (Fig. 4C, D) adipogenic differentiation.
At the end of white adipogenic stimulation, 60% of control Egr1+/+ cells have acquired a white adipocyte
phenotype, marked by the presence of large lipid droplets in the cytoplasm (Fig. 4A). In contrast, only 20% of mutant mASC-Egr1−/− cells exhibited lipid droplets (Fig. 4A) suggesting that Egr1 is necessary for white
adipo-cyte differentiation. To confirm this hypothesis, we quantified the expression of adipoadipo-cyte markers in control and mutant cells at different days after differentiation. As expected, Egr1 is highly expressed during the entire white adipocyte differentiation of control mASC-Egr1+/+ cells, while not detected in mutant mASC-Egr1−/− cells
(Fig. 4B). Cebpb and Pparg encode transcription factors belonging to the core genetic program that trigger adipogenesis26. In both control mASC-Egr1+/+ and mutant mASC-Egr1−/−, Cebpb expression first decreases after
4 days of white differentiation and returns to basal level at the end of the process. Pparg expression continuously increases until day 8, and returns to basal level at the end of white differentiation. These results indicate that Egr1 is not necessary to activate Cebpb and Pparg expression during white adipocyte differentiation. Since Egr1 has been described as a direct regulator of Cebpb expression by chromatin immunoprecipitation assays20, our
obser-vations suggest that absence of Egr1 could be compensated in mASC-Egr1-/- cells to activate Cebpb expression, or
that Egr1 is recruited to Cebpb promoter only as a transcriptional repressor of beige adipocyte differentiation20.
The beige adipocyte marker Ucp1 was not expressed either in control or mutant cells. During white adipocyte dif-ferentiation, Lep, a late marker of white adipocyte differentiation27,28, was significantly down-regulated in mutant
mASC-Egr1-/- cells compared to controls, which is consistent with the reduced white adipocyte differentiation
observed in Egr1−/− cells (Fig. 4A). Resistin (Retn) is an adipocyte-specific hormone secreted by WAT 3. In control
and mutant cells, Retn expression was absent at day 0, increased during white differentiation reaching a peak at day 4, and subsequently decreased during late differentiation (Fig. 4B). A similar Retn expression profile has been previously described during white adipocyte differentiation of 3T3-L1 preadipocytes29. This result indicates
that Egr1 may not regulate Retn expression or that the absence of Egr1 was compensated. Dcun1d3 displays a similar expression profile to Retn during white differentiation of control mASC-Egr1+/+ cells. In contrast to what
we previously observed in vivo with the Egr1−/− mutant (Fig. 2A), Egr1 loss-of-function did not affect Dcun1d3
expression during mASC white adipocyte differentiation (Fig. 4B). This result can be explained by the difference between in vivo analysis of a mixed tissue, and study of an in vitro homogenous cell population strictly directed towards white differentiation.
These observations demonstrate that while mutant mASC-Egr1−/− cells express some markers at a similar
level than in control cells (Cebpb, Pparg, Retn and Dcun1d3, Fig. 4B), they present significant morphological (Fig. 4A) and transcriptomic (Fig. 4B, Lep) alterations in late markers of normal white adipocyte differentiation. This suggests that Egr1 has a positive role on white adipocyte differentiation.
Following beige adipogenic stimulation, control mASC-Egr1+/+ cells displayed a low level (17%) of
differ-entiation into beige adipocytes marked by the appearance of numerous small lipid droplets in their cytoplasm (Fig. 4C). In contrast, Egr1 deletion led to a robust differentiation of 78% of mutant mASC-Egr1−/− cells into beige
adipocytes (Fig. 4C). This result shows that beige adipocyte differentiation in wild type mASC is a less efficient process compared to white differentiation (Fig. 4A, C). More importantly, this observation reveals that Egr1 acts as a critical repressor of beige adipocyte differentiation. In wild type mASC, Egr1 expression increases during the first time-points of beige adipocyte differentiation and decreases at the end of the process (Fig. 4C). In contrast to white adipocyte differentiation, Cebpb expression increases during wild type mASC beige adipocyte differ-entiation whereas Pparg expression remains constant from day 4 (Fig. 4D). Interestingly, Egr1 loss-of-function significantly increases Cebpb and Pparg expression, suggesting that Egr1 is necessary to repress Cebpb and Pparg expression during beige adipocyte differentiation. As expected, Ucp1 expression is significantly upregulated in mutant mACS-Egr1−/− compared to control cells (Fig. 4D), consistently with the browning phenotype of Egr1−/− mice (Figs. 2 and 3)20. Lep is not expressed during beige adipocyte differentiation of both control and
Figure 4. Egr1 is necessary to promote white adipocyte differentiation and prevent beige differentiation of mouse adipose stem/stromal cells. (A–F) Control mASC-Egr1+/+ and mutant mASC-Egr1-/- were subjected to
white (A,C,D) or beige (B,E,F) differentiation for 12 or 10 days, respectively. (A, C) Non-differentiated and white (A, right panel) or beige (C) adipocytes were stained with Oil Red O and Hematoxilin after white (A, left panel) or beige (C, left panel) differentiation and counted (A and C, right panels). For each genotype, results are expressed as a percentage of cells differentiated or not, counted from 7 pictures at Days 0 and 8 after full differentiation. Scale bars, 50 µm. Error bars show means + standard deviations, with *P < 0.05, **P < 0.01. The
p values were obtained using the Mann–Whitney test. (B, D) After 0, 4, 8 and 12 days of culture in white (B)
or beige (D) differentiation medium, cells were used for RNA purification. RNA samples were analysed by RT-qPCR analysis for Egr1, Dcun1d3, Ucp1, Lep and Retn expression in control mASC-Egr1+/+ and mutant
mASC-Egr1−/− cells. Transcripts are shown relative to the level of Rplp0 and 18S transcripts. The relative mRNA
levels were calculated using the 2−∆∆Ct method, with control being normalized to 1. For cells subjected to white
differentiation, experiments were performed with n ≥ 5 independent cultures for each genotype (n = 12 at Day0, n = 6 at Day4, n = 5 at Day8 and n = 10 at Day12 for control mASC-Egr1+/+ cells; n = 11 at Day0, n = 6 at Day4,
n = 6 at Day8 and n = 12 at Day12 for mutant mASC-Egr1−/− cells). For cells subjected to beige differentiation,
experiments were performed with n = 16 independent cultures for each timepoint and genotype. Error bars represent the mean + standard deviations. The p values were obtained using the Mann–Withney test. Asterisks * indicate the p values of gene expression levels in mASC-Egr1+/+ and mASC-Egr1−/− compared to the first day of
gene detection *P < 0.05, **P < 0.01, ***P < 0.001, ****P < 0.0001; # indicate the p values of gene expression levels in mASC-Egr1+/+ versus mASC-Egr1−/−, for each time point, #P < 0.05, ##P < 0.01, ###P < 0.001, ####P < 0.0001.
mutant mASC (Fig. 4D). Expression of Retn is detected during beige adipocyte differentiation (Fig. 4D), while at lower levels compared to white differentiation, which further suggests that Retn may be a generic marker of both white and beige adipocyte differentiation13. Similarly, mutant mASC-Egr1−/− cells which exhibit a robust
differentiation rate, visualized by accumulation of lipid droplets in the cytoplasm (78%, Fig. 4C), are characterized by higher Retn expression levels compared to wild type cells (Fig. 4D). This further confirms that Retn expression can be associated with beige adipocyte differentiation. Dcun1d3 expression is increased during beige adipocyte differentiation (Fig. 4D). In addition, Egr1 loss-of-function leads to a significant upregulation in Dcun1d3 expres-sion (Fig. 4D), suggesting that Egr1 represses Dcun1d3 expression. This is similar to our in vivo results (Fig. 2B). Altogether, our results indicate that Egr1 is necessary to promote white adipocyte differentiation and to repress beige adipocyte differentiation of mASC. Consistent with the cell differentiation phenotypes, Egr1 is necessary to activate Lep during white differentiation and to repress Ucp1 during beige adipocyte differentiation. Retn and
Dcun1d3 are expressed during both white and beige adipocyte differentiation of mASC, suggesting a generic role
of these factors during adipocyte differentiation (Fig. 7). Interestingly, Egr1 loss-of-function specifically affects the expression of the generic adipocyte differentiation markers Cebpb, Pparg, Retn and Dcun1d3 during beige adipocyte differentiation, which confirms the negative role of Egr1 on beige differentiation suggested by in vivo data (Figs. 2 and 3). The positive role of Egr1 on in vitro white adipocyte differentiation is consistent with our in vivo results (Figs. 2 and 3) and with studies correlating Egr1 overexpression with obesity22,23.
Egr1 is sufficient to promote white and to repress beige adipocyte differentiation of C3H10T1/2
mesenchymal stem cells.
To further characterize the role of Egr1 during adipocyte differentiation and confirm the results obtained with mASC, we used a second in vitro approach, taking advantage of the Tol2 genomic system to perform Egr1 gain-of-function experiments in C3H10T1/2 mesenchymal cells. The Tol2 sys-tem was used in combination with the viral T2A syssys-tem, which allowed stable and bi-cistronic expression of two proteins30 (Supplementary Fig. 4). Control C3H-Tom-Gfp cells co-expressed cytoplasmic Tomato and nuclearH2B-GFP fluorescent reporter proteins, whereas in C3H-Tom-Egr1 cells, the H2B-Gfp coding sequence was replaced with Egr1 coding sequence (Supplementary Fig. 4). C3H-Tom-Gfp and C3H-Tom-Egr1 cells exhibited cytoplasmic Tomato expression and nuclear H2B-Gfp or Egr1 expression, respectively (Figs. 5A and 6A).
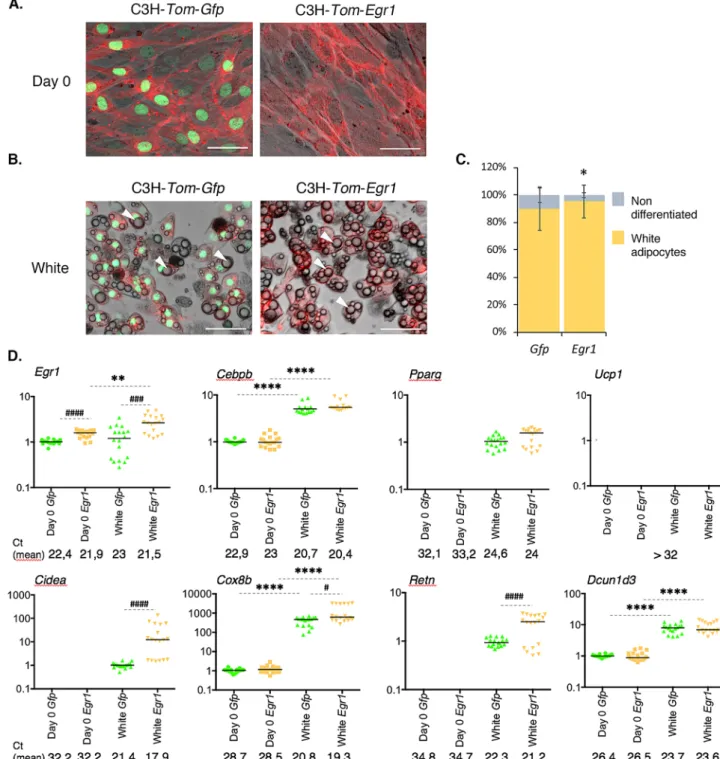
At the end of white adipogenic stimulation, 90% of C3H-Tom-Gfp and 95% of C3H-Tom-Egr1 cells differenti-ated into white adipocytes, marked by the appearance of large lipid droplets in the cytoplasm (Fig. 5B, C, white arrowheads). These observations indicate that Egr1 gain-of-function promotes C3H10T1/2 cell differentiation into white adipocytes and support previous findings showing increased Egr1 expression in WAT of obese mice and humans compared to lean individuals22,23. In contrast, while 97% of C3H-Tom-Gfp differentiated into beige
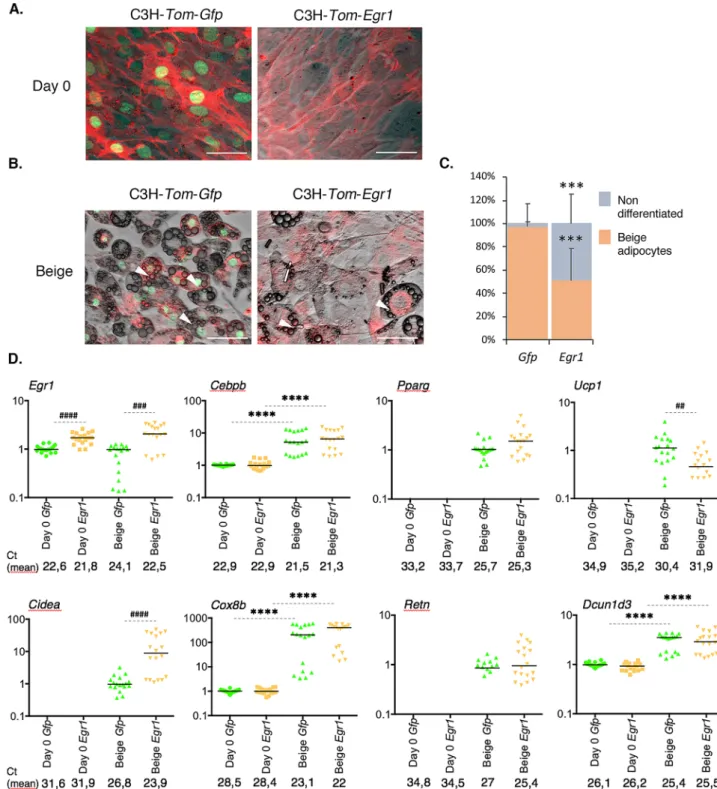
adipocytes, indicated by the presence of small lipid droplets (Fig. 6B, C, white arrowheads), only 50% of
C3H-Tom-Egr1 cells achieved beige differentiation. These results confirm that Egr1 gain-of-function in C3H10T1/2
mesenchymal stem cells reduces beige adipocyte differentiation20.
To further characterize the consequences of Egr1 gain of function during white and beige differentiation, we quantified the expression of Egr1 and several generic (Cebpb, Pparg, Retn, Dcun1d3) and beige (Ucp1, Cidea,
Cox8b) adipocyte markers in C3H-Tom-Gfp and C3H-Tom-Egr1 cells. As expected, C3H-Tom-Egr1 cells display
stable overexpression of Egr1 during white (Fig. 5D) and beige (Fig. 6D) adipocyte differentiation, compared to control C3H-Tom-Gfp cells. The generic adipogenic factors Cebpb and Pparg were up regulated during white (Fig. 5D) and beige (Fig. 6D) adipocyte differentiation in both control C3H-Tom Gfp and C3H-Tom-Egr1 cells.
Egr1 gain-of-function did not affect Cebpb and Pparg expression. These results indicate that while Egr1 is required
to repress Cebpb20 (Fig. 4D) and Pparg expression (Fig. 4D) during mASC differentiation, it is not sufficient to
affect their expression during adipocyte differentiation of C3H10T1/2 cells (Figs. 5D and 6D).
Ucp1 was not detected at the end of white differentiation (Fig. 5D). As expected, the expression of the beige markers Ucp1, Cidea and Cox8b was upregulated in control C3H-Tom-Gfp cells upon differentiation into beige adipocytes (Fig. 6D). A moderate decrease in Ucp1 expression was also observed in C3H-Tom-Egr1 cells when compared to control cells (Fig. 6D), in accordance with their impaired beige differentiation. Surprinsingly, an increase of both Cidea and Cox8b expression was also observed during white adipocyte differentiation (Fig. 5D). In addition, Egr1 gain of-function increases both Cidea and Cox8b expression during white (Fig. 5D) or beige (Fig. 6D) adipocyte differentiation. Egr1 therefore acts as an activator of Cidea and Cox8b expression during white and beige adipocyte differentiation of C3H10T1/2 and is able to repress Ucp1 expression only. One hypothesis could be that, in contrast to the in vivo context (Fig. 2) the co-factors allowing Egr1 to repress Cox8b and Cidea might not be expressed by C3H10T1/2 cells.
Both Retn and Dcun1d3 expression were upregulated in C3H-Tom-Gfp cells after white and beige differentia-tion (Figs. 5D and 6D), which strengthens the hypothesis of a generic role of these two genes during adipocyte differentiation. In addition, Dcun1d3 expression was not altered in C3H-Tom-Egr1 cells compared to controls (Figs. 5D and 6D), showing that Egr1 is not required to regulate Dcun1d3 expression during adipocyte differ-entiation. We could not detect any expression of the white adipocyte marker Lep either in C3H-Tom-Gfp or in C3H-Tom-Egr1 cells during white adipocyte differentiation. These results highlights the limitations of in vitro cell lines in the analysis of white adipocyte differentiation and confirms that primary mASC are the only in vitro system that allows Lep detection31.
Collectively, these results indicate that Egr1 is sufficient to promote white adipocyte differentiation of C3H10T1/2 cells and to impair beige differentiation, presumably by down-regulation of Ucp1 expression.
In summary, Egr1 deletion induces spontaneous WAT browning specifically in the inguinal subcutaneous depot. This process acts through Ucp1 upregulation and results in OCR increase at a level close to the BAT (Fig. 7). In vitro differentiation of mASC isolated from Egr1 mutant SC-WAT confirmed that Egr1 loss-of-function promotes beige adipocyte differentiation through Ucp1 upregulation, and repress white adipocyte
Figure 5. Egr1 is sufficient to promote white adipocyte differentiation in a multipotent cell line. (A–D) Control
C3H-Tom-Gfp and Egr1-overexpressing C3H-Tom-Egr1 cells were subjected to white differentiation. At day 0 (A) and at the end of the differentiation process (B), apotome images were obtained using brightfield, green (Gfp) and red (Tom) channels, merged, and a representative image is shown for each condition. White arrowheads indicate lipid droplets. Scale bars, 50 µm. (C) C3H-Tom-Gfp and C3H-Tom-Egr1 cells submitted to white adipogenic medium were counted from n = 7 pictures and expressed as a percentage of total cells differentiated or not for each condition or as total number of cells per arbitrary unit area. Error bars represent the means +/- standard deviations, and p values were obtained using the Mann–Whitney test comparing differentiated and non-differentiated Tom-Gfp and
C3H-Tom-Egr1 cells, *P < 0.05. (D) At Day 0 or at the end of white differentiation, cells were used for RNA purification. RNA
samples were analysed by RT-qPCR analysis for Egr1, Cebpb, Pparg, Ucp1, Cidea, Cox8b, Retn and Dcun1d3 expression in control C3H-Tom-Gfp and Egr1-overexpressing C3H-Tom-Egr1 cells. Transcripts are shown relative to the level of
18S transcripts. The relative mRNA levels were calculated using the 2−∆∆Ct method, with control being normalized to 1.
Experiments were performed with n = 18 independent cultures for C3H-Tom-Gfp and C3H-Tom-Egr1 cells. * indicate the p values of gene expression levels in C3H-Tom-Gfp or C3H-Tom-Egr1 at the first day of gene detection versus differentiation, with **P < 0.01, ****P < 0.0001; # indicate the p values of gene expression levels in C3H-Tom-Gfp versus C3H-Tom-Egr1 for each time point, with #P < 0.05, ###P < 0.001, ####P < 0.0001.
Figure 6. Egr1 is sufficient to reduce beige adipocyte differentiation in a multipotent cell line. (A–D) Control
C3H-Tom-Gfp and Egr1-overexpressing C3H-Tom-Egr1 cells were subjected to beige differentiation. At day 0 (A) and
at the end of the differentiation process (B), apotome images were obtained using brightfield, green (Gfp) and red (Tom) channels, merged, and a representative image is shown for each condition. White arrowheads indicate lipid droplets. Scale bars, 50 µm. (C) C3H-Tom-Gfp and C3H-Tom-Egr1 cells submitted to beige adipogenic medium were counted from n = 6 pictures and expressed as a percentage of total cells differentiated or not for each condition or as total number of cells per arbitrary unit area. Error bars represent the means + standard deviations, and p values were obtained using the Mann–Whitney test comparing differentiated and non-differentiated Gfp and
C3H-Tom-Egr1 cells, ***P < 0.001. (D) At Day 0 or at the end of beige differentiation, cells were used for RNA purification. RNA
samples were analysed by RT-qPCR analysis for Egr1, Cebpb, Pparg, Ucp1, Cidea, Cox8b, Retn and Dcun1d3 expression in control C3H-Tom-Gfp and Egr1-overexpressing C3H-Tom-Egr1 cells. Transcripts are shown relative to the level of
18S transcripts. The relative mRNA levels were calculated using the 2−∆∆Ct method, with control being normalized to 1.
Experiments were performed with n = 18 independent cultures for C3H-Tom-Gfp and C3H-Tom-Egr1 cells. * indicate the p values of gene expression levels in C3H-Tom-Gfp or C3H-Tom-Egr1 at the first day of gene detection versus differentiation, with ****P < 0.0001; # indicate the p values of gene expression levels in Gfp versus
differentiation. We confirmed these results using Egr1 gain-of-function experiments in C3H10T1/2 mesenchymal stem cells. Altogether, our study reveals that Egr1 is necessary and sufficient to promote full white adipocyte differentiation and sufficient to prevent beige adipocyte differentiation. These results are in accordance with the increased expression of Egr1 observed in obese mice and humans22,23 and establishes Egr1 as a putative
promis-ing target to counteract obesity.
Methods
Mouse line.
All experimental procedures using mice were conducted in accordance with the European guidelines (2010/63/UE) and were approved by the French National Ethic Committee for animal experimenta-tion No. 05 and are registered under the number 01789.02.Egr1 gene was inactivated in C57BL/6 J mice by insertion of the LacZ coding sequence within the Egr1 5′
untranslated region, in addition to a frameshift mutation upstream of the DNA-binding domain of Egr132. The
Figure 7. Schematic representation of the consequences of Egr1 loss or gain-of-function on adipose tissue metabolism and adipocyte differentiation. (A) Egr1 depletion leads to spontaneous and specific browning of inguinal subcutaneous white adipose tissue (WAT), visualized by increased Ucp1 expression and oxygen consumption rate (OCR). (B) Egr1 is necessary and sufficient to promote white adipocyte differentiation and reduce beige differentiation through the regulation of Egr1, Cebpb, Ucp1, Lep, Retn and Dcun1d3 expression.
line was maintained on a C57BL/6J genetic background (JANVIER, France). Animals were bred under controlled photo-period (lights on 08:00–20:00 h), chow diet and tap water ad libitum.
RNA extraction from fat pads.
Fresh inguinal subcutaneous (WAT), brown (BAT), gonadic (GAT), mes-enteric (MAT) and perirenal (PAT) fat pads were removed from 8-month-old euthanized Egr1+/+ and Egr1-/-female mice and homogenized using a mechanical disruption device (Lysing Matrix A, Fast Prep MP1, 4 × 30 s, 6 m s−1). Total RNA was isolated using the RNeasy mini kit (QIAGEN), with 15 min of DNase I (QIAGEN)
treatment as previously described20.
In situ hybridization to adipose tissue sections.
The mouse Dcun1d3 fragment was amplified by PCR (reverse 5′ggtcatcactagccatcctaac; forward 5′cagtattcagggagggactttg) from SC-WAT cDNA and cloned in the PGEM-T easy plasmid (PROMEGA). The antisense probe was synthesized using T7 polymerase after SalI diges-tion. The sense probe was obtained using Sp6 polymerase after SacII digesdiges-tion. Inguinal subcutaneous fat pads were isolated from 1-month-old female mice, fixed in 4% paraformaldehyde overnight and cryo-sectioned. 8 µm wax tissue sections were used for in situ hybridization as previously described33.Quantification of mitochondrial DNA.
WAT and BAT were dissected from 8-months-old controlEgr1+/+ and mutant Egr1-/- female mice and immediately frozen at −80 °C. DNA purification was performed
using the QIAmp DNA Minikit (QIAGEN). DNA concentration and purity were measured using a Nanodrop. Quantitative real time PCR was performed on a StepOnePlus PCR machine (APPLIED BIOSYSTEMS) using the FastStart Universal SYBR Green Master (ROCHE) with primers that amplify the mitochondrial CytB gene and the nuclear encoded NDUFV1 gene as endogenous reference, as described in34.
Metabolic and bio-energetic analysis.
Tissue bioenergetics were analyzed on a Seahorse extracellular flux analyzer (XFe24) according to the manufacturer’s instructions. 2 mg explants of WAT and BAT freshlydissected from 8-months-old control Egr1+/+ and mutant Egr1−/− female mice were immediately placed in a
Seahorse XFe24 islet plate in 500 µL of pre-heated minimal assay medium (SEAHORSE BIOSCIENCES, 37 °C,
pH 7.40) supplemented with glucose (2.25 g/L), sodium pyruvate (1 mM) and L-glutamine (2 mM). The tissue weight was based on initial assays that optimized the oxygen consumption rate (OCR). After one hour of equili-bration at 37 °C in a non-CO2 incubator, OCR was measured successively in control condition (basal rates) and
after successive injections of oligomycin (1 μM) that inhibits ATP synthase (ATP-linked OCR), FCCP (10 μM) that uncouples mitochondrial OXPHOS (maximal OCR) and mixed rotenone/antimycin (10 μM) that inhibit complexes I and III (non-mitochondrial OCR).
Detection and quantification of carbonylated proteins.
WAT and BAT were dissected from8-months-old control Egr1+/+ and mutant Egr1-/- female mice and immediately frozen at -80 °C. The day of
extraction, tissues were homogenized in lysis buffer (8 M urea, 2 M thiourea, 4% CHAPS and 10 mM DTT). After 30 min on ice, lysates were clarified by centrifugation at 20,000 g for 15 min at 4 °C. Protein concentrations of the supernatants were determined by the Bradford method. Labeling of protein carbonyl groups was obtained by overnight incubation of 20 µg protein extracts with CF555DI hydrazide (BIOTIUM, Fremont, CA, USA) at 4 °C under medium agitation. Labeled samples were then resolved by SDS-PAGE in an anykD pre-cast gel (BIORAD). After three washes using a solution 7% acetic acid and 10% ethanol, CF555DI hydrazide labeling was detected using a ChemiDoc MP Imagin System (BIORAD). Total protein staining was performed using Instant-Blue Protein Stain (EXPEDEON). Raw data were analyzed using the Fiji/ImageJ software. In both CF555DI and Coomassie’s analysis, the protein profiles were quantified by measuring the intensity of the lane for each sample. Data were normalized using the CF555DI/Coomassie ratio.
Isolation of murine adipose stem/stromal cells (mASC).
mASC were isolated as previously described35. Briefly, subcutaneous inguinal fat pads were excised from wild type or Egr1−/− female mice, mincedin prewarmed Krebs–ringer bicarbonate KRB (118 mM NaCl, 5 mM KCL, 2.5 mM CaCl2, 2 mM KH2PO4, 2 mM
MgSO4, 25 mM NaHCO3, 5 mM glucose, pH = 7.4) and digested in collagenase solution (0.1%). After
centrifuga-tion, the stromal vascular fraction (SVF) was rinsed in PBS, resuspended in prewarmed Stromal medium (Dul-becco’s Modified Eagle’s Medium (DMEM; GIBCO) supplemented with 10% FBS, 1% penicillin–streptomycin) and seeded on plastic flasks to allow mASC adhesion. Cells were cultured at 37 °C in humidified atmosphere with 5% CO2.
Plasmid cloning.
The Egr1 coding sequence was obtained by PCR amplification of the plasmid pCAß-Egr136using the following primers: Bstbl-Forward-CTA ATG TTC GAA ATG GCA GCG GCC AAGGC, mEgr1-Pmll-Reverse-ATC GTC ACG TGT ATT AGC AAA TTT CAAT, and cloned in the transposable
pT2AL-CMV-Tom-T2A-Gfp plasmid30. The H2B-Gfp coding sequence was removed from pT2AL-CMV-Tom-T2A-Gfp by BstbI and
PmlI digestion and replaced with Egr1 coding sequence.
Transfection of C3H10T1/2 cells and isolation of C3H-Tom‑Gfp and C3H-Tom‑Egr1 cells.
Mousemesenchymal stem cells C3H10T1/237 were seeded to 6-well plates at a density 20.000 cells/cm2 in stromal
medium (Dulbecco’s Modified Eagle’s Medium (DMEM; GIBCO) supplemented with 10% FBS, 1% penicil-lin–streptomycin). Cells were transfected at 80% confluence by lipofectamine P3000 (Invitrogen) with 1 µg of plasmid encoding the transposase (pT2TP) and 2 µg of Gfp, or
pT2AL-CMV-Tom-T2A-Egr1, in order to obtain stable C3H-Tom-Gfp and C3H-Tom-Egr1 cells that overexpress GFP and pT2AL-CMV-Tom-T2A-Egr1, respec-tively. Two days after transfection, C3H-Tom-Gfp and C3H-Tom-Egr1 cells were resuspended into Fluorescence Analysis Cell sorting (FACS) suspension medium (Sterile PBS 1X, 10% FBS, 1% P/S, 2 mM EDTA and DAPI) and purified on a FACS Aria 3 (BECTON DICKINSON, CA). Live cells were gated based on the morphology, doublets were excluded and cells were sorted based on their Tomato expression.
Cell cultures.
Mouse adipose stem/stromal cells mASC-Egr1+/+ and mASC-Egr1-/-, or mouse mesenchymalstem cells C3H-Tom-Gfp and C3H-Tom-Egr1 were plated on 6-well plates at a density of 7.500 cells/cm2 in
Dul-becco’s Modified Eagle’s Medium (DMEM, INVITROGEN) supplemented with 10% foetal bovine serum (FBS, Sigma), 1% penicillin–streptomycin (SIGMA), 1% Glutamine (SIGMA), 800 μg/ml G418 Geneticin (SIGMA) and incubated at 37 °C in humidified atmosphere with 5% CO2 as described in20. Cells were cultured in white
adipocyte differentiation medium (STEMPRO, THERMOFISHER) until differentiation which takes 7 to 12 days. The medium was changed every 3–4 days. Day 0 corresponds to the addition of white differentiation medium, at 100% confluence. mASC-Egr1+/+ and mASC-Egr1-/- subjected to white adipocyte differentiation medium were
stopped at Day 0, Day 4, Day 8 and Day 10 or 12 for gene expression analysis and stopped at Day 10 for Oil Red O staining (as described in previous study20. C3H-Tom-Gfp and C3H-Tom-Egr1 cells subjected to white
adipo-cyte differentiation medium were stopped at Day 0 and at the end of differentiation for gene expression analysis. Confluent cells were cultured in beige differentiation induction medium for 2 days and in beige maturation medium for 7 to 10 days according to published protocols20,38. Day 0 corresponds to the addition of beige
differ-entiation induction medium at confluence. The maturation medium was changed every 3–4 days. mASC-Egr1+/+
and mASC-Egr1-/- subjected to beige adipocyte differentiation medium were fixed for Oil Red O staining at Day
10 or lysed for gene expression analysis at Day 0, Day 4, Day 8 and Day 10.
C3H-Tom-Gfp and C3H-Tom-Egr1 cells subjected to beige adipocyte differentiation medium were stopped at Day 0 and at the end of differentiation for gene expression analysis.
Cell number measurements were performed using the free software Fiji39.
Reverse-transcription and quantitative real time PCR.
Total RNAs extracted from mouse fat pads, mASC-Egr1+/+ and mASC-Egr1-/-, or C3H-Tom-Gfp and C3H-Tom-Egr1 cells were Reverse Transcribed usingthe High Capacity Retro-transcription kit (Applied Biosystems). Quantitative PCR analyses were performed using SYBR Green PCR Master Mix (Applied Biosystems) and primers listed in Supplementary Table 1. The relative mRNA levels were calculated using the 2−∆∆Ct method40. The Cts were obtained from Ct normalized to
Rn18S levels in each sample. For mRNA level analysis in fat pads, 7 to 9 independent RNA samples of
8-month-old Egr1+/+ and Egr1-/- female mice were analysed in duplicate. For mRNA level analysis of mASC-Egr1+/+ and
mASC-Egr1-/- cultures, 5 to 12 independent RNA samples were analysed in duplicate for each time point. For
mRNA level analysis of C3H10T1/2-Tom-Gfp and C3H10T1/2-Tom-Egr1 cell cultures, 12 independent RNA samples were analysed in duplicate for each time point.
Statistical analyses.
Data was analysed using the non-parametric Mann-Withney test with Graphpad PRISM V6 or Student t test. Results are shown as means ± standard deviations. The p values are indicated either with the value or with * or #, as in20.Received: 4 June 2020; Accepted: 24 August 2020
References
1. Kershaw, E. E. & Flier, J. S. Adipose tissue as an endocrine organ. J. Clin. Endocrinol. Metab. 89, 2548–2556 (2004).
2. Coelho, M., Oliveira, T. & Fernandes, R. State of the art paper Biochemistry of adipose tissue : an endocrine organ. (2013) doi:10.5114/aoms.2013.33181.
3. Steppan, C. M. et al. The hormone resistin links obesity to diabetes. Nature 409, 307–312 (2001).
4. Kamohara, S., Burcelin, R., Halaas, J. L., Friedman, J. M. & Charron, M. J. Acute stimulation of glucose metabolism in mice by leptin treatment. Nature 389, 374–377 (1997).
5. Tartaglia, L. et al. Identification and expression cloning of a leptin receptor OB-R. Cell 83, 1263–1271 (1995). 6. Trayhurn, P. Leptin--a critical body weight signal and a ‘master’ hormone? Sci. STKE 2003, pe7 (2003).
7. Berry, D. C., Stenesen, D., Zeve, D. & Graff, J. M. The developmental origins of adipose tissue. Development 140, 3939–3949 (2013). 8. Sebo, Z. L., Jeffery, E., Holtrup, B. & Rodeheffer, M. S. A mesodermal fate map for adipose tissue. Development 145, dev166801
(2018).
9. Bartelt, A. & Heeren, J. Adipose tissue browning and metabolic health. Nat. Rev. Endocrinol. 10, 24–36 (2014).
10. Klaus, S., Casteilla, L., Bouillaud, F. & Ricquier, D. The uncoupling protein UCP : a membraneous mitochondrial ion carrier exclusively expressed in brown adipose tissue. Int. J. Biochem. 23, 1773883 (1991).
11. Seale, P. et al. Prdm16 determines the thermogenic program of subcutaneous white adipose tissue in mice. 121, 53–56 (2011). 12. De Jesus, L. A. et al. The type 2 iodothyronine deiodinase is essential for adaptive thermogenesis in brown adipose tissue. J. Clin.
Invest. 108, 1379–1385 (2001).
13. Lizcano, F. The beige adipocyte as a therapy for metabolic diseases. Int. J. Mol. Sci. 20, (2019).
14. Rosenwald, M., Perdikari, A., Rülicke, T. & Wolfrum, C. Bi-directional interconversion of brite and white adipocytes. Nat. Cell
Biol. 15, 659–667 (2013).
15. Garcia, R. A., Roemmich, J. N. & Claycombe, K. J. Evaluation of markers of beige adipocytes in white adipose tissue of the mouse. Nutr. Metab. (Lond) 13, 24 (2016).
16. Elabd, C. et al. Human multipotent adipose-derived stem cells differentiate into functional brown adipocytes. Stem Cells 27, 2753–2760 (2009).
17. Horwitz, E. M. et al. Clarification of the nomenclature for MSC: the international society for cellular therapy position statement.
Cytotherapy 7, 393–395 (2005).
18. Zuk, P. Adipose-derived stem cells in tissue regeneration: a review. Int. Sch. Res. Not. 2013, e713959 (2013). 19. Zuk, P. A. et al. Human adipose tissue is a source of multipotent stem cells. Mol. Biol. Cell 13, 4279–4295 (2002). 20. Milet, C. et al. Egr1 deficiency induces browning of inguinal subcutaneous white adipose tissue in mice. Sci. Rep. 7, (2017). 21. Havis, E. & Duprez, D. EGR1 transcription factor is a multifaceted regulator of matrix production in tendons and other connective
tissues. Int. J. Mol. Sci. 21, 1–25 (2020).
22. Yu, X. et al. Egr-1 decreases adipocyte insulin sensitivity by tilting PI3K/Akt and MAPK signal balance in mice. EMBO J. 30, 3754–3765 (2011).
23. Zhang, J. et al. Dietary obesity-induced Egr-1 in adipocytes facilitates energy storage via suppression of FOXC2. Sci. Rep. 3, 1476 (2013).
24. Shen, N. et al. An early response transcription factor, Egr-1, enhances insulin resistance in type 2 diabetes with chronic hyperin-sulinism. J. Biol. Chem. 286, 14508–14515 (2011).
25. Mohtar, O. et al. Egr1 mediates the effect of insulin on leptin transcription in adipocytes. J. Biol. Chem. 294, 5784–5789 (2019). 26. Peirce, V., Carobbio, S. & Vidal-Puig, A. The different shades of fat. Nature 510, 76–83 (2014).
27. Macdougald, O. A., Hwang, C. S., Fan, H. & Lane, M. D. Regulated expression of the obese gene product (leptin) in white adipose tissue and 3T3-L1 adipocytes. Proc. Natl. Acad. Sci. USA. 92, 9034–9037 (1995).
28. Palhinha, L. et al. Leptin induces proadipogenic and proinflammatory signaling in adipocytes. Front. Endocrinol. (Lausanne). 10, (2019).
29. Ikeda, Y., Tsuchiya, H., Hama, S., Kajimoto, K. & Kogure, K. Resistin affects lipid metabolism during adipocyte maturation of 3T3-L1 cells. FEBS J. 280, 5884–5895 (2013).
30. Bourgeois, A. et al. Stable and bicistronic expression of two genes in somite- and lateral plate-derived tissues to study chick limb development. BMC Dev. Biol. 15, 1–12 (2015).
31. Wrann, C. D. & Rosen, E. D. New insights into adipocyte-specific leptin gene expression. Adipocyte 1, 168–172 (2012). 32. Topilko, P. et al. Multiple pituitary and ovarian defects in Krox-24 (NGFI-A, Egr-1)-targeted mice. Mol. Endocrinol. 12, 107–122
(1998).
33. Bonnin, M. A. et al. Six1 is not involved in limb tendon development, but is expressed in limb connective tissue under Shh regula-tion. Mech. Dev. 122, 573–585 (2005).
34. L’Honoré, A. et al. The role of Pitx2 and Pitx3 in muscle 1 stem cells gives new insights into P38α MAP kinase and redox regulation of muscle regeneration. Elife https ://doi.org/10.7554/eLife .32991 (2018).
35. Yu, G. et al. Isolation of murine adipose-derived stem cells. In Adipose-Derived Stem Cells: Methods and Protocols (eds. Gimble, J. M. & Bunnell, B. A.) 29–36 (Humana Press, 2011). 10.1007/978-1-61737-960-4_3.
36. Lejard, V. et al. EGR1 and EGR2 involvement in vertebrate tendon differentiation. J. Biol. Chem. 286, (2011).
37. Reznikoff, C. a, Brankow, D. W. & Heidelberger, C. Establishment and characterization of a cloned line of C3H mouse embryo cells sensitive to postconfluence inhibition of division establishment and characterization of a cloned line of C3H mouse embryo cells sensitive to postconfluence inhibition of. 3231–3238 (1973).
38. Lone, J., Choi, J. H., Kim, S. W. & Yun, J. W. ScienceDirect Curcumin induces brown fat-like phenotype in 3T3-L1 and primary white adipocytes. J. Nutr. Biochem. 1–10 (2015) 10.1016/j.jnutbio.2015.09.006.
39. Schindelin, J. et al. Fiji: an open-source platform for biological-image analysis. Nat. Methods 9, 676–682 (2012).
40. Livak, K. J. & Schmittgen, T. D. Analysis of relative gene expression data using real-time quantitative PCR and the 2−ΔΔCT method.
Methods 25, 402–408 (2001).
Acknowledgements
We thank Marthe Moldes from Centre de Recherche Saint-Antoine, Paris, France and Jacqueline Bliley, from Carnegie Mellon University, Pittsburgh, USA for comments on the manuscript. We thank Hélène Fohrer-Ting, Centre d’Histologie, d’Imagerie et de Cytométrie, Centre de Recherche des Cordeliers, INSERM, Sorbonne Université, USPC, Université Paris Descartes, Université Paris Diderot, F-75006 Paris, France, for cell sorting. We thank Alwyn Dady from Medical Sciences Institute, University of Dundee, Scotland and Sophie Gournet from IBPS, Paris, France for illustrations.
Author contributions
M.B., B.M., I.C., R.G. and Y.K. contributed to acquisition, analysis and interpretation of data. D.D. contributed to analysis and interpretation of histology data. A.L. and E.H. contributed to conception, design, analysis and interpretation of data, drafting the article, funding.
funding
This work was supported by the Institut national de la santé et de la recherche Médicale (Inserm), Centre National de la Recherche Scientifique (CNRS), Sorbonne Université (UPMC), Sorbonne Universités Emergence (SU-16-R-EMR-33), Institut de Biologie Paris Seine-Action Initiative program 2017.
competing interests
The authors declare no competing interests.
Additional information
Supplementary information is available for this paper at https ://doi.org/10.1038/s4159 8-020-72698 -w. Correspondence and requests for materials should be addressed to E.H.
Reprints and permissions information is available at www.nature.com/reprints.
Publisher’s note Springer Nature remains neutral with regard to jurisdictional claims in published maps and institutional affiliations.
Open Access This article is licensed under a Creative Commons Attribution 4.0 International License, which permits use, sharing, adaptation, distribution and reproduction in any medium or format, as long as you give appropriate credit to the original author(s) and the source, provide a link to the Creative Commons licence, and indicate if changes were made. The images or other third party material in this article are included in the article’s Creative Commons licence, unless indicated otherwise in a credit line to the material. If material is not included in the article’s Creative Commons licence and your intended use is not permitted by statutory regulation or exceeds the permitted use, you will need to obtain permission directly from the copyright holder. To view a copy of this licence, visit http://creat iveco mmons .org/licen ses/by/4.0/.