HAL Id: hal-00296382
https://hal.archives-ouvertes.fr/hal-00296382
Submitted on 22 Nov 2007
HAL is a multi-disciplinary open access
archive for the deposit and dissemination of
sci-entific research documents, whether they are
pub-lished or not. The documents may come from
teaching and research institutions in France or
abroad, or from public or private research centers.
L’archive ouverte pluridisciplinaire HAL, est
destinée au dépôt et à la diffusion de documents
scientifiques de niveau recherche, publiés ou non,
émanant des établissements d’enseignement et de
recherche français ou étrangers, des laboratoires
publics ou privés.
C. Engler, D. Rose, B. Wehner, A. Wiedensohler, E. Brüggemann, T. Gnauk,
G. Spindler, T. Tuch, W. Birmili
To cite this version:
C. Engler, D. Rose, B. Wehner, A. Wiedensohler, E. Brüggemann, et al.. Size distributions of
non-volatile particle residuals (Dp
www.atmos-chem-phys.net/7/5785/2007/ © Author(s) 2007. This work is licensed under a Creative Commons License.
Chemistry
and Physics
Size distributions of non-volatile particle residuals (D
p
<800 nm) at a
rural site in Germany and relation to air mass origin
C. Engler1, D. Rose1, B. Wehner1, A. Wiedensohler1, E. Br ¨uggemann1, T. Gnauk1, G. Spindler1, T. Tuch1,2, and W. Birmili1
1Leibniz Institute for Tropospheric Research, Leipzig, Germany
2UFZ – Center or Environmental Research, Department of Human Exposure Research and Epidemiology, Leipzig, Germany
Received: 9 March 2006 – Published in Atmos. Chem. Phys. Discuss.: 27 June 2006 Revised: 6 June 2007 – Accepted: 27 August 2007 – Published: 22 November 2007
Abstract. Atmospheric aerosol particle size distributions at
a continental background site in Eastern Germany were ex-amined for a one-year period. Particles were classified us-ing a twin differential mobility particle sizer in a size range between 3 and 800 nm. As a novelty, every second mea-surement of this experiment involved the removal of volatile chemical compounds in a thermodenuder at 300◦C. This con-cept allowed to quantify the number size distribution of non-volatile particle cores – primarily associated with elemental carbon, and to compare this to the original non-conditioned size distribution. As a byproduct of the volatility analysis, new particles originating from nucleation inside the thermod-enuder can be observed, however, overwhelmingly at diame-ters below 6 nm. Within the measurement uncertainty, every particle down to particle sizes of 15 nm is concluded to con-tain a non-volatile core. The volume fraction of non-volatile particulate matter (non-conditioned diameter < 800 nm) var-ied between 10 and 30% and was largely consistent with the experimentally determined mass fraction of elemental car-bon. The average size of the non-volatile particle cores was estimated as a function of original non-conditioned size us-ing a summation method, which showed that larger parti-cles (>200 nm) contained more non-volatile compounds than smaller particles (<50 nm), thus indicating a significantly different chemical composition. Two alternative air mass classification schemes based on either, synoptic chart analy-sis (Berliner Wetterkarte) or back trajectories showed that the volume and number fraction of non-volatile cores depended less on air mass than the total particle number concentration. In all air masses, the non-volatile size distributions showed a more and a less volatile (“soot”) mode, the latter being lo-cated at about 50 nm. During unstable conditions and in mar-itime air masses, smaller values were observed compared to
Correspondence to: W. Birmili
(birmili@tropos.de)
stable or continental conditions. This reflects the significant emission of non-volatile material over the continent and, de-pending on atmospheric stratification, increased concentra-tions at ground level.
1 Introduction
Atmospheric aerosol particles have been recognized to play a key role in the balance of global climate, notably through their direct and indirect radiative effects (Haywood and Boucher, 2000). Anthropogenic aerosols shift the natural balance of radiation in the atmosphere, and rapidly chang-ing and spatially diverse patterns of anthropogenic emissions make future projections of aerosol-driven climate effects a true challenge (Ramanathan et al., 2001). The aerosol par-ticle size distribution is one of the key variables involved in the analysis of radiative aerosol effects, and consequently, numerous works have examined the spatio-temporal charac-teristics of particle size distributions under marine or arctic baseline conditions (e.g., Heintzenberg et al., 2004; Covert et al., 1996; Koponen et al., 2002), and in the continental atmospheres of Central Europe (Birmili et al., 2001), the Alps (Weingartner et al., 1999), Scandinavia (M¨akel¨a et al., 2000; Tunved et al., 2003), and Northern Italy (Rodr´ıguez et al., 2005) with respect to the distribution of anthropogenic sources.
Particular efforts have been directed towards studying the relevance of atmospheric carbonaceous aerosols (e.g., Kriv´acsy et al., 2001). Black carbon is a strong absorber of visible light, whose radiative effect in mixed-phase par-ticles and during cloud activation are uncertain to predict (Ackerman and Toon, 1981; Heintzenberg and Wendisch, 1996; Jacobson, 2001). Due to their insolubility, carbona-ceous aerosols, particularly elemental carbon, have also been
associated with respiratory effects in animals and humans (Oberd¨orster, 2001; Donaldson et al., 2001).
Apart from volcanic activities and natural forest fires, black carbon stems overwhelmingly from anthropogenic sources, such as industrial and domestic combustion, and ve-hicular traffic sources (Ogren and Charlson, 1983; Andreae and Merlet, 2001; Bond et al., 2004). Modelling the emis-sion, disperemis-sion, and removal of carbonaceous aerosol re-quires spatially resolved emission inventories, which are usu-ally difficult to obtain.
Atmospheric measurements using cost-efficient tech-niques are therefore desirable to obtain information on the distribution, sources, and processes determining the life-time of carbonaceous aerosol components. A standard method to determine atmospheric elemental carbon concentrations is filter collection followed by thermal treatment and detection of CO2 in a EC/OC analyzer (Turpin et al., 2000).
Photo-metric measurement techniques, such as the aethalometer, or the PSAP (Bond et al., 1999) have the advantage of higher time resolution, but are typically not designed to distinguish particles according to particle size.
An alternative method to investigate carbonaceous aerosols is volatility analysis. A basic experimental approach involves heating the sample aerosol, thereby causing volatile fractions of PM to evaporate, and subsequent removal of the evaporated material. Such devices have been known as “ther-modenuders” (Burtscher et al., 2001), which allow to dis-tinguish bulk portions of chemical species that are less or more volatile, respectively. Early applications of the ther-modenuder in atmospheric studies involved the separation of the volatile and non-volatile fractions of accumulation and Aitken mode aerosol (Clarke, 1991; Smith and O’Dowd, 1996).
During this work, we have applied a combination of a twin differential mobility particle sizer (TDMPS) and a thermode-nuder (TD) to examine the change in particle size distribution due to the removal of volatile species. Tropospheric aerosol samples were thus analyzed for a period of 12 months, and distinguished according to air masses. We also discuss the potential of our experimental methods to provide a surrogate measurement of the number concentration of primary anthro-pogenic particles.
2 Experimental
Atmospheric measurements of conditioned and non-volatile particle size distributions were carried out over a pe-riod of 12 months between 1 July 2003 and 30 June 2004 at the atmospheric research station Melpitz in Eastern Ger-many (87 m a.s.l.; 51◦32′N; 12◦54′E). The station is sur-rounded by flat grass lands, agricultural pastures and wood-lands within several tens of kilometers, and neither obsta-cles nor larger sources of pollution lie within the immediate vicinity of the station. The comparison of previous aerosol
measurements at Melpitz with other European sites shows that Melpitz observations are within the concentration range of the more anthropogenically influenced background sites (van Dingenen et al., 2004; Putaud et al., 2004).
Particle number size distributions upstream and down-stream a thermodenuder were measured using a flow-regulated twin differential mobility particle sizer (TDMPS) (Birmili et al., 1999). This instrument consists of two differential mobility particle analyzers (Vienna type), con-nected to a condensation particle counter (model 3010, TSI, St. Paul, Minnesota, U.S.), and an ultrafine condensation par-ticle counter (model 3025, TSI), respectively, which together encompass a total particle size range between 3 to 800 nm. Sheath air was supplied at a humidity below 5%. The aerosol inlet was equipped with an Andersen PM10head.
For the volatilization of sample aerosol, a thermodenuder (TD) following the design of Wehner et al. (2002) was used. Briefly, this TD consists of a heating section to remove the volatile material at a temperature of 300◦C, and a cooling section where the evaporated gas-phase compounds are ab-sorbed by active carbon in order to minimize re-condensation on the particles.
A measurement cycle of the TD/TDMPS combination consisted of a size distribution scan upstream the TD, fol-lowed by a scan downstream the TD. A scan duration of 10 min allowed for a time resolution of 20 min for both the non-conditioned and thermally conditioned distributions. On condition that the aerosol population fluctuates only moder-ately with time, the measurements of non-conditioned and non-volatile size distributions can be compared against each other, as will be shown later in Sect. 3.3.
An aerosol conditioning device like the thermodenuder causes particle losses during transport, notably due to Brow-nian diffusion or thermophoresis. To account for these ef-fects, the measured size distributions were corrected for size-resolved transmission factors that were determined in the lab-oratory using silver test particles for a range of particle sizes (3–50 nm).
Apart from these loss mechanisms, a thermodenuder may also produce new particles through homogeneous nucleation. Such nucleation inside the thermodenuder may occur if the desorbed vapour phase is cooled down to rapidly before their complete adsorption by the tube wall. The relevance of this homogeneous nucleation process for our experiment will be discussed in detail below.
3 Methodology
Since this work relies on the relatively unexplored technique of particle volatilization in a thermodenuder, several aspects of non-volatile particulate matter, such as external particle mixture are now established.
Fig. 1. Size distribution before (line) and after (grey area and bold
line) thermal conditioning in the V-TDMA. The arrow shows the initial particle diameter (e.g., 30, 50, 80 or 150 nm).
3.1 State of mixture of non-volatile particulate matter When measuring non-volatile size distributions, the ques-tion arises whether this non-volatile material originates from an entirely separate particle type (external mixture), or from chemically mixed particles (internal mixture). Tan-dem differential mobility analyzer (V-TDMA) measurements at Melpitz showed that non-volatile particulate matter in an aged continental aerosol occurred as two types of particles, either as entirely non-volatile particles, or as the non-volatile particle cores of chemically mixed particles (Philippin et al., 2004; Rose et al., 2006). Figure 1 illustrates such decom-position of a monodisperse particle population into a “non-volatile”, and a “partially volatile” mode in the V-TDMA-system.
To establish a better understanding of the size distribu-tions of non-volatile residues, V-TDMA data from Rose et al. (2006) were revisited and combined with concurrent TDMPS measurements from this work. While the TD-TDMPS measured complete size distributions, the V-TDMA provided information on external particle mixture for a range of monodisperse particle sizes. In the V-TDMA, particles were heated to 300◦C like in the TD-TDMPS.
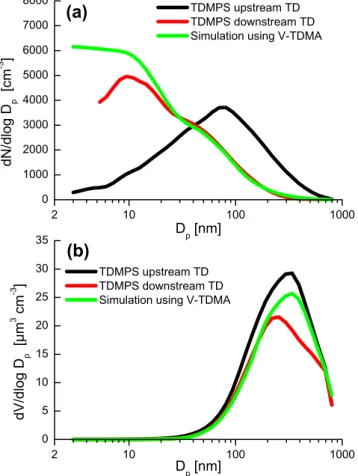
The combination of TD-TDMPS and V-TDMA data in-volved a simulation of the non-volatile size distributions from both the non-conditioned TDMPS size distribution (3– 800 nm), and V-TDMA decomposition information for the monodisperse particle sizes 30, 50, 80, and 150 nm. V-TDMA decomposition spectra were first interpolated over the entire TDMPS size, and then used to map all size bins of the non-conditioned TDMPS distribution onto a resulting size distribution corresponding to the state downstream of the thermodenuder. 2 10 100 1000 0 5 10 15 20 25 30 35
(b)
d V/ d lo g D p [µ m 3 cm -3 ] D p [nm] TDMPS upstream TD TDMPS downstream TD Simulation using V-TDMA2 10 100 1000 0 1000 2000 3000 4000 5000 6000 7000 8000
(a)
d N /d lo g D p [cm -3 ] Dp [nm] TDMPS upstream TD TDMPS downstream TD Simulation using V-TDMAFig. 2. Particle size distributions measured by the TDMPS up-stream and downup-stream the thermodenuder: (a) number, (b) vol-ume. Green lines represent the distribution simulated from TDMPS (upstream) and V-TDMA external mixture information at sizes of 30, 50, 80, and 150 nm. The data refer to a 6 h measurement period between 06:00 and 18:00 h on 24 August 2003.
A comparison of the simulated non-volatile size distribu-tion and the experimentally determined TDMPS distribudistribu-tion downstream the thermodenuder is shown in Fig. 2. A very good agreement between both methods can be seen for the particle number concentration in the diameter (Dp) range
>20 nm, and for particle volume in the range Dp<200 nm.
This indicates that V-TDMA and TD-TDMPS data are con-sistent, and exhaustive in describing the volatilization pro-cess of the measured size distributions in the range 20– 200 nm. Divergences between simulation and measurement outside this size range are ascribed to the non-availability of V-TDMA information.
The knowledge of external particle mixture allows to de-termine which non-volatile particles measured in the TD-TDMPS derive from entirely non-volatile particles, and which from originally larger, internally mixed particles. Fig-ure 3 shows how the simulated non-volatile number distri-bution can be decomposed into these two particle types. In-terestingly, the non-volatile particles measured above a size
20 100 1000 10 100 1000 6000 Dp [nm] d N /d lo g D p [cm -3 ] TDMPS upstream TD Simulation of non-volatile distributions: Total Entirely non-volatile Non-volatile residues from mixed particles
Fig. 3. Decomposing simulated non-volatile particle number
dis-tributions into externally mixed non-volatile particles (“primary soot”), and the non-volatile cores of internally mixed particles. The curves refer to the same data set as those in Fig. 2.
of approximately 140 nm belong overwhelmingly to the type of entirely non-volatile particles, whereas below 140 nm, they are predominantly the non-volatile residues of origi-nally larger particles. Also note that the distribution of en-tirely non-volatile particles has its maximum concentration at about 100 nm, which is similar to the emission profile of diesel soot (Harris and Maricq, 2001).
By associating entirely non-volatile particles with primary soot particles (Philippin et al., 2004; Rose et al., 2006) and partially volatile particles with those that have undergone at-mospheric processing, we summarize our results in the shape of the following paradigm for atmospheric non-volatile par-ticle distributions:
1. Non-volatile particles larger than a certain size (∼140 nm) belong mostly to the type of entirely non-volatile particles, which are associated with primary soot particles from combustion sources.
2. Non-volatile particles smaller than a certain size (∼140 nm) are mostly residues of originally larger, and chemically mixed particles; these particles have under-gone physical and chemical transformation in the atmo-sphere, such as coagulation and the heterogeneous ad-dition of ionic and organic secondary aerosol.
3. Although the distribution of entirely non-volatile par-ticles has its maximum concentration at about 100 nm, these particles are still outnumbered at that size by a fac-tor of approximately 2.5 by the residues of chemically mixed particles.
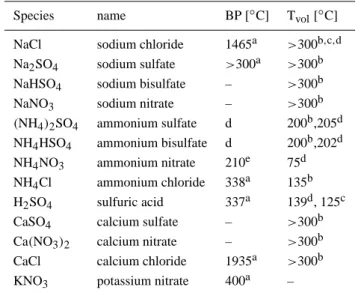
Table 1. Boiling points (BP) and volatilization temperatures Tvol
of various compounds in pure form.
Species name BP [◦C] Tvol[◦C]
NaCl sodium chloride 1465a >300b,c,d
Na2SO4 sodium sulfate >300a >300b
NaHSO4 sodium bisulfate – >300b
NaNO3 sodium nitrate – >300b
(NH4)2SO4 ammonium sulfate d 200b,205d
NH4HSO4 ammonium bisulfate d 200b,202d
NH4NO3 ammonium nitrate 210e 75d
NH4Cl ammonium chloride 338a 135b
H2SO4 sulfuric acid 337a 139d, 125c
CaSO4 calcium sulfate – >300b
Ca(NO3)2 calcium nitrate – >300b
CaCl calcium chloride 1935a >300b
KNO3 potassium nitrate 400a –
aLide (1996) bPinnick et al. (1987) cSchmid et al. (2002)
dJohnson et al. (2004) eWeast and Astle (1980)
d: decomposes before boiling
This paradigm is presumed to be valid for observations at a rural background site in an anthropogenically influenced troposphere, such as over Central Europe.
3.2 Relation between non-volatile particle volume and chemical particle composition
We now discuss the classes of chemical compounds that may be associated with the measured non-volatile size distribu-tions. Rose et al. (2006) proposed primary sources of soot, such as diesel engine emissions as responsible for the type of entirely non-volatile particles over a range of atmospheric conditions.
Secondary particulate mass in the European rural tropo-sphere, in contrast, is dominated by sulfate, nitrate, and sec-ondary organic compounds (Putaud et al., 2004). From a compilation of known boiling points and experimentally de-termined volatilization temperatures in Table 1, it can be seen that the salts of ammonium are completely volatile at 300◦C, whereas the salts of Na, K and Ca are non-volatile.
For organic compounds, the situation is more compli-cated since the myriad of individual organic species is dif-ficult to measure, and knowledge on the volatility properties of atmospherically relevant species remains scattered. An agreed convention to separate “organic” and “elemental” car-bon has been the thermal treatment of filter-based samples at 340◦C over the duration of two hours (Cachier et al., 1989; Kuhlbusch et al., 1998). While it may be safe to assume that airborne elemental carbon will be preserved during passage
through our thermodenuder at 300◦C, it is not evident which
fractions of organic carbon will eventually be removed dur-ing the transit time of several seconds.
To scrutinize the connection between the non-volatile par-ticulate fraction and classes of chemical compounds, im-pactor samples that were collected over 24 h each at Melpitz in July and August 2003 were analyzed with regard to chem-ical particle composition, with sampling being concurrent to the TD-TDMPS measurements. The impactor stage used for a comparison with the TD-TDMPS encompasses the accu-mulation mode with aerodynamic particle sizes between 140 and 420 nm. Ion-chromatography served to determine the mass concentrations of Cl−, NO−3, SO2−4 , Ca2+, K+, Mg2+, Na+, and NH+4, whereas a thermographic carbon analysis was applied to determine the mass concentrations of organic and elemental carbon, respectively. Briefly, organic carbon (OC) was volatilized at 650◦C under pure nitrogen, and sub-sequently oxidized catalytically at 850◦C. Elemental carbon was defined as the remaining matter detected from complete combustion at 650◦C under pure oxygen. More details of the analytical techniques can be found elsewhere (Plewka et al., 2004).
In a first calculation, the mass fractions of the salts of am-monium on the one hand, and Na, K, Ca, and Mg on the other hand were determined by distributing the pool of anions to-wards the cations according to their ion charge. Then, the chemical mass fractions were converted into volumetric mass fractions using bulk assumptions on the density of the differ-ent classes of compounds. Finally, the total non-volatile mass fraction was calculated by considering elemental carbon, and the salts of Na, K, Ca, and Mg non-volatile, and compared to the non-volatile volume fraction determined from the TD-TDMPS.
For eight samples, the non-volatile volume fraction cal-culated from the TD-TDMPS measurements was between 0.04 and 0.12, whereas the volume fraction of non-volatile chemical compounds amounted to values between 0.03 and 0.2. Although being far from a precision closure experiment, these results suggest that the non-volatile fraction detected by the TD-TDMPS is accounted for by EC and the non-volatile inorganic salts of Na, K, Ca, and Mg. In the continental accu-mulation mode aerosol analyzed, EC and the mentioned in-organic salts were found to occur in a ratio of approximately 1:5 in non-volatile PM.
3.3 Summation method and nucleation inside the TD In some of our former work, we developed a method to in-terpret dual size distribution data with regard to the changes occurring in a distribution after being conditioned, more pre-cisely, humidified (Birmili et al., 2004). This method is used here to relate non-conditioned and conditioned (non-volatile) particle size distributions. Briefly, the approach of the summation method is to associate segments of equal par-ticle number concentration under both, the conditioned and
non-conditioned particle size distributions. Next, the ratio of the mean particle size of two corresponding particle number segments is calculated. This diameter ratio is interpreted as a particle “growth factor” in the case of humidification, or a particle “shrinking factor” in the case of particulate matter loss due to volatilization. The output discussed in this work are continuous size-dependent functions of particle shrink-ing factor that relate the residual size of non-volatile particle cores to the particles’ original non-conditioned size.
It must be stated that the output of the summation method can only be interpreted usefully on condition that the total number of aerosol particles is conserved during the volatil-ity analysis. (Otherwise, particle number segments in both distributions cannot be associated in an unambiguous way.) This prerequisite has therefore been carefully examined on the basis of the one-year experimental data.
Figure 4 shows the ratio of total particle number measured with and without the thermodenuder, i.e. downstream and up-stream the device, respectively. For the calculation of this number concentration ratio it is suggestive to use different lower cut-off sizes for the size distributions with and without the thermodenuder, because the particles undergo a certain volume as well as diameter loss during volatilization. For the calculations in Fig. 4 we assumed that ambient particles in the size range concerned (<25 nm) collapse on 40% of their original diameter. This assumption is taken from re-sults derived later (Figs. 10f and 11f) and considered reli-able, since the TD-TDMPS and V-TDMA shrinkage factors agreed for the short-term campaign measurements described in Rose et al. (2006).
Figure 4 also shows that for the cut-off combination 8.0 nm (without TD) and 3.2 nm (with TD), individual four-hour averages may reach values up to 40, i.e. the thermod-enuder produces new particles at concentrations many times above the initial particle number. After increasing the lower cut-offs to 13 nm/5.2 nm and 25 nm/10 nm, the peak values of the concentration ratio disappear, and the remaining val-ues are centered around the value of unity.
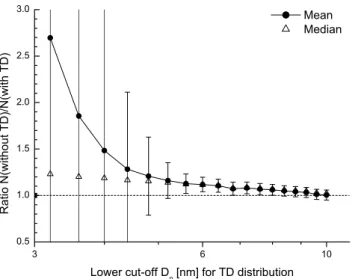
The effect of the lower size cut-off is explored in more detail in Fig. 5, which shows the number ratio of particle concentration with and without the TD as a function of that cut-off. At the lowest size cut-off combination (with TD: 8.0 nm/without TD: 3.2 nm), the average ratio is well above 1.0, since the particles that nucleate inside the TD are in-cluded. Also, the scattering of the values is significant, as indicated by the bars of plus/minus one standard deviation. Above the size cut-off combination (14 nm/5.6 nm), the scat-tering of the values reaches moderate values of the standard deviation below 0.10. With increasing size cut-off, the num-ber concentration ratio slowly decreases further until the fi-nal ratio 1.00±0.05 is reached at the size cut-off combination (25 nm/10 nm). In conclusion, choosing higher size cut-offs will minimize the effects of new particle production in the thermodenuder.
0 50 100 150 200 250 300 350 0.3 1 10 100 R a ti o N (w it h T D )/ N (w it h o u t T D )
No. of Days after 2003-07-01
lower threshold without TD / with TD
8.0 nm / 3.2 nm 13 nm / 5.2 nm 25 nm / 10 nm
Fig. 4. Ratio between the total particle number concentrations measured with and without the thermodenuder, based on the indicated lower
cut-off sizes and an averaging period of four hours. Shown is every fifth value of the entire measurement campaign.
3 6 10 0.5 1.0 1.5 2.0 2.5 3.0 R a ti o N (w it h o u t T D )/ N (w it h T D )
Lower cut-off Dp [nm] for TD distribution Mean Median
Fig. 5. The effect of the lower size cut on the ratio between the
parti-cle number measured upstream and downstream the thermodenuder (TD). Note that the lower cut-off sizes for the distributions with and without the TD were kept at a ratio of 0.40 in order to account for the average diameter shrinking factor of particles <30 nm.
The results in the Figs. 4 and 5 specify the two main ther-modenuder effects for small particles: First, the nucleation process inside the thermodenuder is of a fluctuating nature, and restricted to particles in the TD size distribution that are predominantly smaller than 6 nm. As the particles are rather small we assume that they result from homogeneous nucle-ation in the cooling section of the thermodenuder. Under cer-tain circumstances, volatilized particle material is apparently not transferred quickly enough onto the walls of the cooling section, so that the generated vapors nucleate and form new particles.
Second, there is a slight excess of particles after the
thermodenuder, which is of statistical significance below the size cut-off combination (20 nm/8.0 nm), and amounts to a median ratio of 1.23 at the size cut-off combination (8.0 nm/3.2 nm) (Fig. 5). As shown later in Fig. 12 this weakly size-dependent behaviour is similar for most sub-sets of the one-year data. Our conclusion is that choosing a rel-atively high size cut-off combination of (20 nm/8.0 nm) will avoid the adverse effects of the particle number balance in the thermodenuder, while selecting a lower size cut-off combi-nation (14 nm/5.6 nm) will still limit the errors in the particle number balance by 10%.
Unfortunately, our attempts to pinpoint the nucleation in-side the TD to an instrumental, meteorological, or aerosol parameter failed. The variables examined include TDMPS flow parameters, ambient temperature, relative humidity, to-tal particulate mass, and even the daily mass concentration of organic carbon. Neither of these parameters correlated sig-nificantly with the homogeneous nucleation inside the TD, so that we currently do not know which are its governing factors during the analysis of environmental aerosol.
It is, however, evident that the impact of the newly formed particles inside the TD on shrinking factor calculations can be minimized by ignoring the size distribution below a cer-tain cut-off.
3.4 Air mass classification
Synoptic scale air masses are a useful concept to clas-sify aerosol populations that are shaped by regional aerosol emissions, or during long-range transport. We classified aerosol populations at Melpitz using the daily weather chart “Berliner Wetterkarte” (Geb, 1981; Institut f¨ur Meteorologie, 2004), an analysis which takes into account back trajectories and the thermal properties of air masses. The Berliner Wet-terkarte analysis distinguishes different regions of climatic origin (A – arctic, P – subpolar, S – subtropic, T – tropic)
and air mass character (m – maritime, x – mixed type, c – continental).
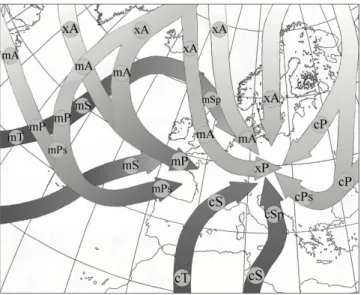
Figure 6 illustrates a selection of typical back trajectories arriving in Central Europe as well as transformations because of energetic conversions, like the warming of arctic (A) air into subpolar (P) and further into heated subpolar (Ps), or changes in character. The Berliner Wetterkarte classification addresses continental influences in that a conversion from the maritime (m) to the mixed (x) type usually occurs after a res-idence time of 24 h over the continent, and further conversion into the continental (c) type after 3–5 days.
For our analysis, the synoptic maps of the 850 hPa-level were analyzed and the air masses over the sampling site were determined. In addition, the exact times of frontal passages were identified using time series of locally measured mete-orological data (temperature, humidity, rainfall) at Melpitz, which led to a distinction between subsequent air masses as fine as possible. Particle size distributions were subsequently averaged over the data sets corresponding to each air mass type.
3.5 Cluster analysis
Back trajectories have been recognized as a valuable tool to investigate the origin of air pollutants (Stohl, 1998). Conse-quently, back trajectory cluster analysis was applied in this work as an alternative method for an air mass classification of particle size distributions. Some major advantages of the cluster method are that it can be automated, and provides a higher degree of objectiveness than the synoptic classifica-tion described above.
We applied a k-means cluster algorithm, which was devel-oped closely following the approach first reported by Dorling et al. (1992), and divided the entire dataset into a predeter-mined number of trajectory clusters. The groundwork of the cluster analysis were back trajectories calculated using the HYSPLIT4 (HYbrid Single-Particle Lagrangian Integrated Trajectory) model (Draxler and Hess, 2004).
In addition, vertical profiles of pseudopotential tempera-ture calculated from regular radiosonde ascents at the Sta-tion Oppin, 50 km distant to Melpitz were used. Profiles of pseudopotential temperature have been incorporated in the variables to be clustered because vertical temperature profiles characterize the degree of vertical atmospheric stratification, which is of elementary importance to any surface measure-ment of atmospheric constituents. The following Euclidian distances were computed to express the spatial separation be-tween two back trajectories i and j :
Lij = 1 K X k v u u t 3 X l=1 al(xli−xlj)2. (1)
Here, K is the number of trajectory points. K=144 was cho-sen to reprecho-sent hourly back trajectory positions over 6 days.
Fig. 6. Trajectories of air masses on their way to central Europe
as well as transformations because of changes in heat content and character. After Geb (1981), supplement of Institut f¨ur Meteorolo-gie (2004). Reprodced from Birmili et al. (2001) by permission of the American Geophysical Union [Copyright 2001].
l is the dimension of the vector to be clustered, which
in-cludes the three variables of geographical latitude and lon-gitude (both in Cartesian coordinates), and pseudopotential temperature. alare the weights required to create three
vari-ables of equitable magnitude; a1, a2, and a3 were chosen
as 1.25 degree−1, 0.8 degree−1, and 10 K−1. Notably, the choice of a3required prior test runs because temperature is a
variable entirely dissimilar from geographical position. In practice, the cluster algorithm was run for a range of cluster numbers between 3 and 14. Selecting a small number of clusters will generate larger, more representative sub-sets of data. On the contrary, using a higher number of clusters will resolve more features of different aerosol types. The decision, how many clusters to use for the final discussion of the size distribution data reflected a compromise between simplicity of display (low n) and a more visible separation of the data clusters, and yielded the two options of n=7 (with
a3=10) and n=11 (with a3=1).
4 Results
4.1 Berliner Wetterkarte air mass classification
First, the results obtained from a segregation of the 12-month size distribution data set into the various air mass types after the Berliner Wetterkarte are discussed. The frequency of oc-currence of the air mass types can be seen in Table 2. A gen-eral result is that pronounced continental air (“c”) was only sampled on about 15 % of the time.
Table 2. Frequency of occurrence (FO) of the different air mass
types at Melpitz between July 2003 and June 2004.
maritime (m) mixed type (x) continental (c)
name FO [%] name FO [%] name FO [%]
mA 5.1 xA 1.9 cA 0.0
mP 26.8 xP 7.8 cP 2.9
mPs 7.5 xPs 14.0 cPs 5.4
mSp 4.4 xSp 8.5 cSp 2.4
mS 5.0 xS 4.5 cS 3.8
total 48.8 total 36.7 total 14.5
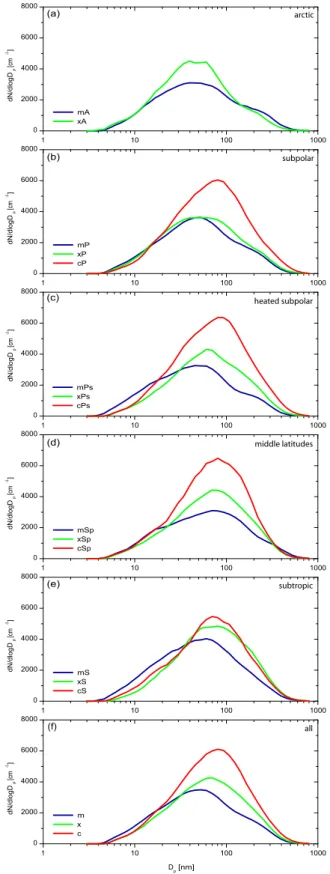
Figure 7 shows the the typical (median) values of the non-conditioned particle size distributions in each of the air masses. Table 3 contains quantitative multimodal lognor-mal size distribution parameters (number concentration, ge-ometric standard deviation and mean gege-ometric diameter for each of the three lognormal modes) for the size distributions shown in Fig. 7. It can be noted that the overall differences in size distributions between the maritime (“m”) and the mixed (“x”) type air masses were relatively minor. A possible ex-planation is the location of the Melpitz sampling site in east-ern Germany, i.e., surrounded by populated areas with an-thropogenic aerosol sources. Clean maritime air, e.g., is re-quired to cover a distance of at least 400 km over land before arriving at Melpitz, leaving enough time for the uptake of an-thropogenic emissions. Maritime type air masses have, per definition, spent less than 24 h over land, but the continen-tal influence is already visible in an increased tocontinen-tal particle concentration.
In subpolar air masses, however, the difference between the maritime and mixed type on the one hand, and continental air on the other hand is significant (Fig. 7b). In maritime air, Aitken and accumulation mode were separated by a concen-tration minimum at most times. This minimum (sometimes also referred to as “Hoppel” minimum) is thought to result from the activation of Aitken particles in non-precipitating clouds. In mixed-type and continental air masses, only one broad particle mode is usually observed with a concentration maximum between about 70 to 90 nm.
Figure 7f aggregates the air masses into only character cat-egories, and again points out the different modal features of the size distributions in the air mass types “m”, “x”, and “c”. Another relevant observation is the gradual increase in accu-mulation mode concentration from maritime (3500 cm−3) to
continental (6200 cm−3) air masses.
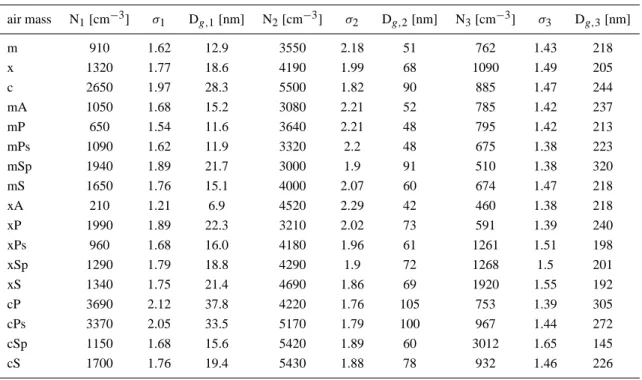
In contrast to the previous text, Fig. 8 concentrates on the non-volatile particle size distributions, i.e., those measured downstream the thermodenuder. Table 4 shows on the mul-timodal lognormal size distribution parameters for the size
1 10 100 1000 0 2000 4000 6000 8000 1 10 100 1000 0 2000 4000 6000 8000 1 10 100 1000 0 2000 4000 6000 8000 1 10 100 1000 0 2000 4000 6000 8000 1 10 100 1000 0 2000 4000 6000 8000 1 10 100 1000 0 2000 4000 6000 8000 (a) Dg ol d/ Nd p mc[ 3-] mA xA (b) Dg ol d/ Nd p mc[ 3-] mP xP cP (c) Dg ol d/ Nd p mc[ 3-] mPs xPs cPs (d) Dg ol d/ Nd p mc[ 3-] mSp xSp cSp (e) Dg ol d/ Nd p mc[ 3-] mS xS cS (f) Dg ol d/ Nd p mc[ 3-] Dp [nm] m x c all subtropic middlelatitudes heatedsubpolar subpolar arctic
Fig. 7. Non-conditioned particle size distributions at Melpitz
(me-dian values) for different air mass character and origin following the Berliner Wetterkarte air mass classification.
Table 3. Lognormal parameters of the non-conditioned median number size distributions, separated after different air mass types: Number
concentration (N), geometric standard deviation (σ ) and geometric mean diameter (Dg,) for the three modes (nucleation (1), Aitken (2) and
accumulation (3) mode). The lognormal modes were fitted using a Levenberg Marquardt least squares fitting routine, which was also used to fit size distributions during previous work (Birmili et al., 2001).
air mass N1[cm−3] σ1 Dg,1[nm] N2[cm−3] σ2 Dg,2[nm] N3[cm−3] σ3 Dg,3[nm] m 910 1.62 12.9 3550 2.18 51 762 1.43 218 x 1320 1.77 18.6 4190 1.99 68 1090 1.49 205 c 2650 1.97 28.3 5500 1.82 90 885 1.47 244 mA 1050 1.68 15.2 3080 2.21 52 785 1.42 237 mP 650 1.54 11.6 3640 2.21 48 795 1.42 213 mPs 1090 1.62 11.9 3320 2.2 48 675 1.38 223 mSp 1940 1.89 21.7 3000 1.9 91 510 1.38 320 mS 1650 1.76 15.1 4000 2.07 60 674 1.47 218 xA 210 1.21 6.9 4520 2.29 42 460 1.38 218 xP 1990 1.89 22.3 3210 2.02 73 591 1.39 240 xPs 960 1.68 16.0 4180 1.96 61 1261 1.51 198 xSp 1290 1.79 18.8 4290 1.9 72 1268 1.5 201 xS 1340 1.75 21.4 4690 1.86 69 1920 1.55 192 cP 3690 2.12 37.8 4220 1.76 105 753 1.39 305 cPs 3370 2.05 33.5 5170 1.79 100 967 1.44 272 cSp 1150 1.68 15.6 5420 1.89 60 3012 1.65 145 cS 1700 1.76 19.4 5430 1.88 78 932 1.46 226
distributions shown in Fig. 8. Generally, the non-volatile size distributions show overall variations between different air masses of a magnitude similar to the unconditioned size distributions. Likewise, the highest total concentrations were observed in pronounced continental air masses.
The non-volatile size distributions are marked by one com-mon feature: the original, nearly com-monomodal distributions (Fig. 7) tended to evolve into bimodal distributions after ther-mal conditioning (Fig. 8). This bimodal shape is caused by the split-up of the non-conditioned distribution maximum be-tween 50 and 100 nm in the thermodenuder: Entirely non-volatile particles will remain at approximately the same size, whereas partially volatile particles will appear in the second non-volatile mode, around 10–20 nm (Fig. 8).
Entirely non-volatile particles were found to be scarce in the size range <30 nm (cf. Sect. 3.1). Therefore, the particle mode “B” in Fig. 8 (<30 nm) consists overwhelmingly of the non-volatile residues of originally larger particles, whereas the particle mode “A” (>30 nm) is composed of both entirely non-volatile particles and non-volatile residues of larger par-ticles. It is therefore mode “A”, which is sensitive towards variations in the concentration of entirely non-volatile par-ticles, and it is this mode which we associate with primary emissions from combustion, such as soot, in a rural aerosol.
The typical modal diameters of mode “A” are between 70 and 90 nm, and show a minor dependency of the air mass
type only (Fig. 8). The latter observation confirms that the anthropogenic source contributions (associated with the non-volatile PM contribution) are similar in all wind directions from the Melpitz observation site. However, the concentra-tion of mode “A” appears to be the most sensitive with re-gard to different air mass types. The highest concentration in mode “A” occurred in air masses “cPs”, which represent aged and dry continental air masses originating from Eastern Europe (cf. Fig. 6).
Mode “B”, the non-volatile particle mode < 30 nm was, in contrast, less influenced by different air mass types. This suggests that these non-volatile cores of originally larger non-conditioned particles are more homogeneously emitted, or generated in the wider area around the Melpitz site. The chemical composition of the non-volatile residues of these particles is unknown; while their evaporated material con-tained the inorganic substances with evaporation tempera-tures below 300◦C (cf. Table 1), little is known about the
thermal behavior of organic atmospheric particulate species. Wehner et al. (2005) previously analyzed particle forma-tion events at Melpitz and found that particles <30 nm that were newly formed from gaseous species always had a non-volatile core at 300◦C. A hypothesis raised in Wehner et al. (2005) was that organic aerosol species might polymer-ize within the particle phase, thus generating non-volatile particle material. Support to this hypothesis was recently
Table 4. Lognormal parameters of the the non-volatile median number size distributions, separated after different air mass types: Number
concentration (N), geometric standard deviation (σ ) and geometric mean diameter (Dg,) for the three modes (nucleation (1), Aitken (2) and
accumulation (3) mode). The lognormal modes were fitted using a Levenberg Marquardt least squares fitting routine, which was also used to fit size distributions during previous work (Birmili et al., 2001).
air mass N1[cm−3] σ1 Dg,1[nm] N2[cm−3] σ2 Dg,2[nm] N3[cm−3] σ3 Dg,3[nm] m 3500 1.67 7.5 2660 2.27 33 8 1.25 550 x 3510 1.79 7.4 3500 2.19 37 9 1.24 547 c 5400 1.74 9.5 4350 2.17 47 16 0.96 645 mA 3250 1.67 7.6 2320 2.31 34 11 0.77 490 mP 3360 1.66 7.4 2730 2.31 31 8 0.80 558 mPs 3360 1.67 7.6 2430 2.28 30 5 0.78 527 mSp 3250 1.69 7.6 2880 2.21 43 7 0.86 594 mS 4310 1.67 7.4 2980 2.24 37 6 0.83 581 xA 4020 1.79 8.6 2480 2.47 29 5 0.83 548 xP 2790 1.6 7.1 3100 2.51 30 4 0.99 563 xPs 2880 1.64 6.6 3730 2.39 30 4 0.99 563 xSp 2820 1.68 6.3 3970 2.31 32 4 0.99 563 xS 4000 1.68 9 3970 2.21 38 4 0.99 563 cP 4200 1.58 10 4660 2.32 41 4 0.99 563 cPs 4200 1.58 8 5690 2.33 39 4 0.99 563 cSp 5460 1.51 10 5030 2.35 35 4 0.99 563 cS 5460 2.28 11 2490 2.07 57 4 0.99 563
obtained by laboratory experiments using atmospherically relevant organic species (Kalberer et al., 2004).
Figure 9 shows the diameter shrinking factors (SF) due to particle volatilization at 300◦C. The shrinking factors SF rep-resent an average ratio between particle diameters after and before conditioning in the thermodenuder. The larger the SF, the more non-volatile material was contained in the aerosol under investigation. In contrast to the size distributions, SF is an intensive variable that depends on the chemical com-position of the particles, not on their absolute concentration. Since the summation method described in Sect. 3.3 does not resolve external mixture, each value of SF corresponds to the average over the more and less volatile subfractions of particles at a given non-conditioned size. As also described in Sect. 3.3, the nucleation of new particles inside the ther-modenuder affects the number of particles downstream the thermodenuder. In order to ensure shrinking factors that can be interpreted with confidence, the display of shrinking fac-tors was generally limited to diameters above 25 nm in the following.
The principal observation for rural Melpitz aerosol was that accumulation mode particles contained more non-volatile material (SF=0.55 at 400 nm) than Aitken and nu-cleation mode particles (SF=0.37 at 30 nm). The two ex-amples correspond to non-volatile volumetric fractions of 17 and 5%, respectively. This trend is systematic through all
observations, and is interpreted as increasing fractions of el-emental carbon, as well as crustal material with increasing particle size.
The air mass-related differences demonstrate an increased amount of non-volatile material especially in continental (“c”) air. The feature is best seen for particles >100 nm in the air mass type “cPs” in Fig. 9c, and reflects an enrichment of the chemical compounds associated with non-volatile PM, such as elemental carbon (see Sect. 3.2). Below 70 nm, only minor differences in SF were found for different air mass types; this implies that nucleation mode and young Aitken particles – which are typically only a few days old, tend to follow a more uniform spatial distribution regarding chemi-cal composition than accumulation mode particles.
It is interesting to note that in maritime air masses, the functions of SF are not monotonous with particle size, but of-ten have a minor maximum around 100 nm and a minor min-imum at diameters above (Fig. 9). This points towards a size-segregated chemical composition, with a maximum amount of volatile material in particles of the size range 150–200 nm. The relative fraction of volatile material, such as ammonium sulfate and nitrate is expected to be especially large in par-ticles that were activated the first time in a non-precipitating cloud (Hoppel et al., 1994; Birmili et al., 1999), and it is exactly the corresponding particle size range where we see the minor minimum in SF. In conclusion, our size segregated
1 10 100 1000 0 2000 4000 6000 8000 1 10 100 1000 0 2000 4000 6000 8000 1 10 100 1000 0 2000 4000 6000 8000 1 10 100 1000 0 2000 4000 6000 8000 1 10 100 1000 0 2000 4000 6000 8000 1 10 100 1000 0 2000 4000 6000 8000 (a) Dg old/ Nd p mc[ 3-] mA xA (b) Dg old/ Nd p mc[ 3-] mP xP cP (c) Dg old/ Nd p mc[ 3-] mPs xPs cPs (d) Dg old/ Nd p mc[ 3-] mSp xSp cSp (e) Dg old/ Nd p mc[ 3-] mS xS cS (f) Dg old/ Nd p mc[ 3-] Dp [nm] m x c
mode B mode A all subtropic middlelatitudes heatedsubpolar subpolar arcticFig. 8. Particle size distributions downstream the thermodenuder at
Melpitz (median values) for different air mass character and origin following the Berliner Wetterkarte air mass classification.
10 100 0.3 0.4 0.5 0.6 10 100 0.3 0.4 0.5 0.6 10 100 0.3 0.4 0.5 0.6 10 100 0.3 0.4 0.5 0.6 10 100 0.3 0.4 0.5 0.6 10 100 0.3 0.4 0.5 0.6 mA xA (a) F S mP xP cP (b) F S mPs xPs cPs (c) F S mSp xSp cSp (d) F S mS xS cS (e) F S m x c (f) F S Dp [nm] all subtropic middlelatitudes heatedsubpolar subpolar arctic
Fig. 9. Diameter shrinking factors (SF) as a function of
non-conditioned particle diameter after volatilization at 300◦C. The
-40 -20 0 20 40 40 50 60 70 80 0 5 10 15 20 25 0 500 1000 1500 2000 2500 3000 1 10 100 1000 0 1000 2000 3000 4000 5000 6000 7000 1 10 100 1000 0 1000 2000 3000 4000 5000 6000 7000 10 100 0.30 0.35 0.40 0.45 0.50 0.55 0.60 0.65 1 2 3 4 5 6 7 0 20 40 60 80 100 120 140
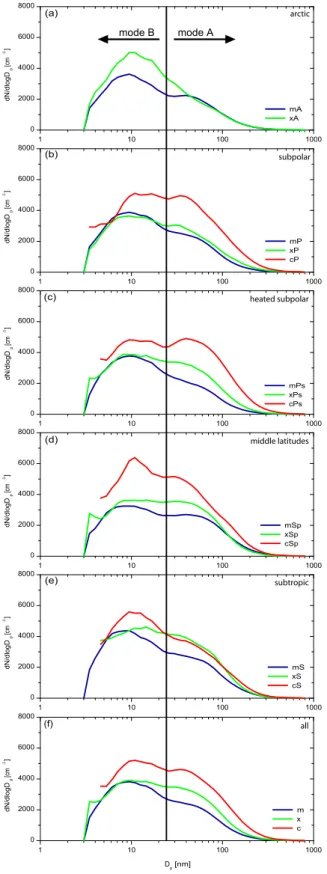
Fig. 10. Back trajectory cluster analysis for 7 air mass types: (a) back trajectories, (b) vertical profiles of virtual potential temperature, (c) number of trajectories in the respective cluster, each corresponding to a time period of 12 h, (d) particle size distributions, (e) non-volatile
size distributions, (f) diameter shrinking factors SF.
SF data are consistent with the picture of secondary aerosol formation in non-precipitating clouds, a process that is more likely to occur in the humid air masses belonging to the char-acters “m” and “x” than to “c”.
The state of external mixture of rural aerosol particles at Melpitz has been shown to be roughly bimodal in Sect. 3.1. Moreover, a relatively fixed diameter ratio could be seen be-tween the sub-populations of non-volatile and more volatile particles after thermo-conditioning. We made use of this knowledge to retrieve the relative number fraction of these two populations in 150 nm particles from the 12-month dual size distribution data. The corresponding calculation showed that on annual average ca. 17 % of the 150 nm particles were entirely non-volatile, i.e., associated with externally mixed soot in air masses “c”, and 6.5 % in air masses “m”.
4.2 Back trajectory cluster analysis
As an alternative to the Berliner Wetterkarte air mass ana-lysis, a cluster analysis based on back trajectories and tem-perature profiles was performed for the entire dataset. In this section, the corresponding results are presented for the cluster numbers n=7, and n=11 and compared to the former analysis. Figure 10 and Table 5 give an overview over the particle size distribution, back trajectories, trace gas
concen-tration, and meteorological parameters that are representative for each of the clusters of the analysis n=7. Quantitative log-normal size distribution parameters are given in Table 6.
Generally, the largest differences between different trajec-tory clusters could be seen in the accumulation mode range (Dp>70 nm) of non-conditioned particles (Fig. 10d). The
highest concentrations occurred in cluster No. 5, which cor-responds largely to the air mass type “cPs” reported before in the Berliner Wetterkarte analysis. The lowest concentra-tion occurred in cluster No. 2, which corresponds to a fast moving, maritime air mass. In cluster No. 2, the average size distribution is evidently bimodal, showing the accumu-lation mode (Dp∼200 nm) as a shoulder to the Aitken mode
(Dp∼40 nm). The diameter shrinking factor for cluster No. 2
shows a minimum between 150 and 200 nm, which indicates a high fraction of volatile compounds in the accumulation mode (see Fig. 10d), probably caused by liquid phase forma-tion in non-precipitating clouds (cf. discussion above).
An important factor determining the observed accumu-lation mode concentrations is vertical atmospheric stabil-ity: Fig. 10b displays the average vertical profiles of vir-tual potential temperature for each cluster, obtained from ra-diosonde ascents. The atmosphere was vertically most stable in cluster No. 4 and most unstable in cluster No. 1. The three
Table 5. Back trajectory cluster analysis for 7 air mass types: General air mass properties, frequency of nucleation events, mean trace gas
concentrations [µg/m3], temperature (T) [◦C] and wind speed (WS) [m s−1].
Cluster # Origin Stratification Trajectories Nucleation days NO O3 SO2 NOx T WS
1 North Sea very unstable 100 41 1.2 84.5 3.5 8.0 18.0 3.0
2 Atlantic unstable 126 14 1.3 54.2 2.6 9.3 10.5 3.8
3 Western Europe stable 85 1 3.3 26.4 3.7 22.4 7.5 1.7
4 North Sea, Germany very stable 29 1 5.0 18.5 5.5 24.6 3.4 1.7
5 Eastern Europe stable 35 6 1.9 35.6 6.0 16.6 4.2 1.8
6 Baltic states unstable 61 7 1.9 50.7 3.7 13.0 6.4 1.8
7 North Sea neutral 132 6 2.0 37.9 2.9 15.2 9.2 1.5
Table 6. Modal parameters from fitting the non-conditioned and non-volatile median number size distributions according to the cluster
analysis for 7 air mass types: Number concentration (N), geometric standard deviation (σ ) and geometric mean diameter (Dg,) for the three
modes (nucleation (1), Aitken (2) and accumulation (3) mode). The lognormal modes were fitted using a Levenberg Marquardt least squares fitting routine, which was also used to fit size distributions during previous work (Birmili et al., 2001).
cluster N1[cm−3] σ1 Dg,1[nm] N2[cm−3] σ2 Dg,2[nm] N3[cm−3] σ3 Dg,3[nm] non-conditioned 1 4100 1.95 15.7 3330 1.98 59 1300 1.57 180 2 2460 1.88 14.3 3255 1.72 46 1395 1.67 154 3 2200 2.01 24.5 4595 1.86 85 875 1.52 246 4 2390 2.0 25.3 4350 1.86 90 970 1.49 269 5 2740 1.94 22.4 5935 1.86 82 1305 1.49 258 6 2500 2.3 26.1 2820 1.92 74 1440 1.54 221 7 1680 1.94 21.2 4360 1.89 73 1005 1.55 229 non-volatile 1 6000 1.96 7.0 2690 2.1 43 - - -2 4300 1.96 8.0 1950 2.28 39 - - -3 4600 1.8 10.4 3600 2.18 49 - - -4 3800 1.9 10.4 3700 2.22 55 - - -5 4300 2.0 10.5 4310 2.18 55 - - -6 4300 1.9 9.3 2950 2.18 50 - - -7 4600 1.85 10.5 3250 2.17 46 - -
-clusters with the highest atmospheric stability (4, 3, 5) were also associated with the highest accumulation mode concen-trations. Conversely, the clusters with the highest instabil-ity (1, 2, 6) were associated with the lowest accumulation mode concentrations. A key result in this context is also the increased fraction of non-volatile chemical compounds (SF=0.50) under stable atmospheric conditions (Fig. 10f). The explanation for both increased particle numbers and SF is that under inhibited vertical mixing, anthropogenic emis-sions from the ground remain trapped in a shallow ground layer, and cannot be removed vertically. These findings em-phasize that stable atmospheric stratification is the most im-portant meteorological condition to cause high aerosol con-centrations in the ground layer, even in rural areas.
Differences between different air masses can also be seen for nucleation mode particles (Dp<30 nm): The highest
number concentrations (median values) were related to clus-ter No. 1 (Fig. 10d). The periods of clusclus-ter No. 1 were ac-companied by the the highest frequency of new particle for-mation events (Table 5). Cluster No. 1 is representative for very unstable air, originating from the North Sea, and low levels of pollutants like NOx(Table 5). In this weather, the
sky is usually clear which leads to the likely photochemical production of aerosol precursors. The meteorological situ-ation corresponding to cluster No. 1 appears to be the most favorable for atmospheric new particle formation in Melpitz, and emphasizes the great degree of meteorological control on new particle formation events. Interestingly, these find-ings appear to have an equivalent in the Finnish boreal forest,
-40 -20 0 20 40 40 50 60 70 80 0 5 10 15 20 25 0 500 1000 1500 2000 2500 3000 1 10 100 1000 0 1000 2000 3000 4000 5000 6000 7000 1 10 100 1000 0 1000 2000 3000 4000 5000 6000 7000 10 100 0.30 0.35 0.40 0.45 0.50 0.55 0.60 0.65 1 2 3 4 5 6 7 8 9 10 11 0 20 40 60 80 100
Fig. 11. Back trajectory cluster analysis for 11 air mass types: (a) back trajectories, (b) vertical profiles of virtual potential temperature, (c) number of trajectories in the respective cluster, each corresponding to a time period of 12 h, (d) particle size distributions, (e) non-volatile
size distributions, (f) diameter shrinking factors SF.
where new particle formation was also observed most fre-quently with the outbreak of cold air masses (Nilsson et al., 2001).
It can be seen in Fig. 10e that the newly formed parti-cles, which have non-conditioned sizes Dp<30 nm, tend to
have non-volatile cores smaller than 10 nm. As already men-tioned, it is a current subject of speculation what the compo-sition of these non-volatile remnants of newly formed parti-cles is. Both sulfuric acid and sulfates are volatile at 300◦C, so more research will be needed to explain particularly the role of organics during the growth of particles to final sizes between 20 and 50 nm.
An overview of the cluster analysis using n=11 clusters is now given in Fig. 11, Table 7 and Table 8. These results are added because the representation using 11 trajectory clusters explained some features of the dataset more effectively. One advantage is the increased distinction between the resulting 11 mean trajectories (Fig. 11a) compared to the analysis for
n=7.
A defined mode of less volatile particles (Dp∼50 nm) was
not found in maritime but in mixed type air masses (No. 4, 8, 9 and 11) and was even more distinct in continental air (No. 5, 6 and 7). In this size range, cluster No. 10 (which is similar to the “xPs” type in the former section) showed the
highest concentrations in both the non-conditioned and the non-volatile size distribution, but no clear splitting up into two modes was observed.
Similarly to Sect. 3.3, eventual differences in the balance of total particle number upstream and downstream the ther-modenuder were examined, this time as a function of the aerosols belonging to the different trajectory clusters. The results are shown in Fig. 12 and indicate a relatively sim-ilar behaviour of the different environmental aerosol types. The common feature is that the aforementioned nucleation of new particles inside the thermodenuder affects the particle concentration downstream the thermodenuder mainly below 6 nm. Figure 12 demonstrates that the basic assumptions for the calculation of shrinking factors are generally valid, espe-cially when shrinking factors only above particle diameters of 20 nm are discussed.
Values of the diameter shrinking factor between 0.35 and 0.52 were observed in maritime, unstable air masses (No. 1, 2 and 3), while stable layered, continental air masses (No. 5, 6, 8) showed higher values between 0.40 and 0.57. One single exception was found in cluster No. 7, which is representing a continental air mass of medium stability. In this cluster, minimum values of the diameter shrinking factor (0.3 to 0.5) but high values of the SO2-concentration were found. This
Table 7. Back trajectory cluster analysis for 11 air mass types: General air mass properties, frequency of nucleation events, mean trace gas
concentrations [µg/m3], temperature (T) [◦C] and wind speed (WS) [m s−1].
Cluster # Origin Stratification Trajectories Nucleation days NO O3 SO2 NOx T WS
1 North Sea unstable 55 7 1.7 49.8 2.3 11.5 9.2 2.9
2 Atlantic unstable 43 4 1.3 53.2 2.4 8.5 8.9 4.0
3 Atlantic, Western Europe unstable 77 9 1.2 54.0 3.1 10.3 12.1 3.8
4 Western Europe neutral 67 – 2.6 29.7 3.8 20.1 7.7 2.1
5 Germany very stable 23 1 4.5 14.6 6.2 25.4 3.3 1.5
6 Germany neutral 58 3 3.7 31.4 4.2 21.1 9.3 1.3
7 Eastern Europe neutral 29 3 2.1 42.4 6.1 15.9 6.1 1.8
8 Baltic states neutral 21 6 1.6 50.1 4.8 11.0 2.4 2.3
9 Baltic Sea very unstable 59 16 1.7 66.5 3.1 10.9 11.9 1.8
10 Scandinavia neutral 34 2 2.7 32.1 2.9 17.4 7.0 0.9
11 North Sea, Germany very unstable 102 25 1.3 66.4 3.0 10.8 14.6 2.4
Table 8. Modal parameters from fitting the non-conditioned and non-volatile median number size distributions according to the cluster
analysis for 11 air mass types: Number concentration (N), geometric standard deviation (σ ) and geometric mean diameter (Dg,) for the three
modes (nucleation (1), Aitken (2) and accumulation (3) mode). The lognormal modes were fitted using a Levenberg Marquardt least squares fitting routine, which was also used to fit size distributions during previous work (Birmili et al., 2001).
cluster N1[cm−3] σ1 Dg,1[nm] N2[cm−3] σ2 Dg,2[nm] N3[cm−3] σ3 Dg,3[nm] non-conditioned 1 1000 1.51 8.7 5130 2.03 35 1295 1.62 165 2 960 1.45 8.5 3720 2.38 38 645 1.47 194 3 1720 1.71 10.6 3670 2.14 44 930 1.64 184 4 2150 2.07 25.4 3890 1.85 84 1020 1.54 229 5 2230 1.88 22.16 4510 1.88 92 835 1.47 291 6 1410 1.89 21.69 5190 1.88 83 1025 1.5 256 7 1780 1.83 20.40 5410 1.95 74 1870 1.52 241 8 4010 2.22 23.74 2880 1.70 77 1420 1.56 212 9 3440 2.13 19.75 3810 1.89 75 1065 1.54 218 10 2370 2.41 24.17 5340 1.97 68 730 1.58 220 11 3040 1.88 18.04 3410 1.85 74 1165 1.55 209 non-volatile 1 4430 1.6 7.46 3200 2.72 20 4 0.99 563 2 3320 1.66 6.78 2690 2.52 24 9 1.24 560 3 3320 1.66 9 2580 2.2 34 87 1.90 160 4 3320 1.66 9 3910 2.13 44 87 1.90 160 5 3520 1.66 8 3790 2.26 44 435 1.74 150 6 3520 1.66 11 4070 2.2 48 – – – 7 3620 1.76 12.5 4220 2.08 64 – – – 8 3900 1.76 7 3690 2.42 38 – – – 9 5600 1.76 7.7 3600 2.3 37 – – – 10 5600 1.86 10 4000 2.42 35 – – – 11 4000 1.96 7 2920 2.16 43 – – –
4 6 10 0.9 1.0 1.1 1.2 1.3 1.4 R a ti o N (w it h o u t T D )/ N (w it h T D )
Lower cut-off Dp [nm] for TD distribution 1 2 3 4 5 6 7 8 9 10 11
Fig. 12. The effect of the lower size cut on the ratio between the
particle numbers measured upstream and downstream the TD as a function of the 11 trajectory clusters presented Fig. 11.
is why the aerosol particles of this cluster (especially for
Dp<100 nm) are assumed to consist of a high sulfate
frac-tion, which is volatile at 300◦C.
The most general result is that continental aerosol emis-sions and stable atmospheric stratification are the main ftors leading to high particle number concentrations in the ac-cumulation mode and high fractions of non-volatile chemical compounds in the entire size range.
5 Summary and conclusions
In this work, a new type of atmospheric data, a combined set of non-conditioned and non-volatile particle number size dis-tributions was explored with regard to the influence of syn-optic scale air masses. Initial measurements by a Volatility-TDMA demonstrated that aerosol particles with diameters less than 200 nm consist, in the rural Melpitz area, of at least two externally mixed volatility modes. The non-volatile par-ticle mode was associated with an external mixture of mainly soot, whereas the more volatile mode is interpreted to repre-sent all internally mixed particles containing inorganic ions, organic compounds, and a non-volatile residuum. Simu-lations and measurements of the size distributions of non-volatile particle cores using V-TDMA and TD-TDMPS data agreed well within the size range 20–200 nm, thereby encom-passing most of the occurring total particle number.
A byproduct of the volatility analysis were found to be new particles originating from nucleation inside the thermod-enuder. These occurred overwhelmingly at diameters below 6 nm, and need to be examined carefully when comparing particle size distributions upstream and downstream of the thermodenuder. The application of lower cut-off sizes at 5.6 nm, 8.0 nm, and 10 nm to the thermodenuder size
dis-tributions resulted in particle number ratios of 1.12±0.10, 1.06± 0.06, and 1.00±0.05, respectively, between the num-ber concentrations downstream and upstream of the thermod-enuder.
By applying the summation method to the particle number size distributions upstream and downstream the thermode-nuder, diameter shrinking factors were calculated, which rep-resent the numerical diameter fraction of non-volatile mate-rial in an aerosol population. The typical values ranged be-tween 0.37 and 0.55 for particles bebe-tween 30 and 400 nm. The general increase of the diameter shrinking factor with increasing particle size is interpreted as a change of chemical particle composition with particle size, i.e., a relative enrich-ment of non-volatile compounds such as eleenrich-mental carbon and the salts of alkali and earth alkali metals in larger parti-cles.
A classification of the size distributions after synoptic scale air masses (“Berliner Wetterkarte”) and back trajectory cluster analysis showed that both the non-conditioned as well as the non-volatile particle size distributions at Melpitz var-ied significantly with air mass origin and character. Two dis-tinct physical modes (i.e., Aitken and accumulation mode) were found in maritime air masses only, whereas continen-tal aerosols showed overwhelmingly a single particle mode around 100 nm. The total number concentrations were higher by a typical factor of about two in continental air compared to maritime air (on average 5900 cm−3and 3700 cm−3, re-spectively).
The particle size range Dp>50 nm showed its highest
con-centration in air masses of continental character. These east-ern and continental European air masses involve long resi-dence times (>4 days) of tropospheric air over densely pop-ulated land. Besides anthropogenic emissions, the reduced atmospheric humidity and, consequently, reduced wet depo-sition is an explanation for these accumulative effects. No-tably, the highest diameter fraction of non-volatile particle material >50 nm correlated very consistently with the situa-tions of highest atmospheric stability, and therefore confirm the accumulation of primary emissions in these air masses as a dominating effect controlling particle number concen-tration.
Using a combination of long-term TD-TDMPS size distri-butions and representative short-term V-TDMA information, we further estimated the number fraction of non-volatile (i.e., “soot”) particles of the total number concentration of 150 nm particles. These calculations yielded an average soot particle number fraction of 17% in continental, and 6.5% in maritime air masses over the 12-month observation period.
It is a noticeable result, that the highest particle concentra-tions in the size range <50 nm occurred mainly in air masses from the North Sea, and Scandinavia, all accompanied by relatively low levels of anthropogenic trace gases but also by unstable atmospheric stratification. The origin of these air masses does not correlate with the centers of anthropogenic pollution, so most of these particles are thought to be formed
by secondary pathways. The noticeable correlation between secondary particles and unstable air indicates that the sec-ondary particle formation process is controlled to a consider-able degree by meteorological processes, rather than by peak values of potential gas phase precursors.
Acknowledgements. Parts of this work were funded by the FAT
(F¨ordervereinigung Automobiltechnik). We further
acknowl-edge funding through the German Federal Environment Agency (Umweltbundesamt, Dessau) grant UFOPLAN 203 432 57/05. Back trajectories were calculated on the NOAA ARL READY Website using the HYSPLIT (HYbrid Single-Particle Lagrangian
Integrated Trajectory) Model (Reference: R. R. Draxler and
G. D. Rolph, 2003, NOAA Air Resources Laboratory, Silver Spring, MD, USA).
Edited by: U. Baltensperger
References
Ackerman, T. P. and Toon, O. B.: Absorption of visible radiation in atmosphere containing mixtures of absorbing and nonabsorbing particles, Appl. Opt., 20, 3661–3668, 1981.
Andreae, M. O. and Merlet, P.: Emission of trace gases and aerosols from biomass burning, Global Biogeochem. Cycles, 15, 955– 966, 2001.
Birmili, W., Stratmann, F., and Wiedensohler, A.: Design of a DMA-based size spectrometer for a large particle size range and stable operation, J. Aerosol Sci., 30, 549–553, 1999.
Birmili, W., Wiedensohler, A., Heintzenberg, J., and Lehmann, K.: Atmospheric particle number size distribution in central Europe: Statitical relations to air masses and meteorology, J. Geophys. Res., 106, 32 005–32 018, 2001.
Birmili, W., Nowak, A., Schwirn, K., Lehmann, K., Massling, A., and Wiedensohler, A.: A new method to accurately relate dry and humidified number size distributions of atmospheric aerosols, J. Aerosol Sci., Abstracts of EAC, Budapest 2004, I, 15–16, 2004. Bond, T. C., Anderson, T. L., and Campbell, D.: Calibration and intercomparison of filter-based measurements of visible light ab-sorption by aerosols, Aerosol Sci. Technol., 30, 582–600, 1999. Bond, T. C., Streets, D. G., Yarber, K. F., Nelson, S. M., Woo,
J.-H., and Klimont, Z.: A technology-based global inventory of black and organic carbon emissions from combustion, J. Geo-phys. Res., 109, D14203, doi:10.1029/2003JD003697, 2004. Burtscher, H., Baltensperger, U., Bukowiecki, N., Cohn, P., H¨uglin,
C., Mohr, M., Nyeki, S., Schmatloch, V., Streit, N., and Wein-gartner, E.: Separation of volatile and non-volatile aerosol frac-tions by thermodesorption: instrumental development and appli-cations, J. Aerosol Sci., 32, 427–442, 2001.
Cachier, H., Bremond, M.-P., and Buat-M´enard, T.: Determination of atmospheric soot carbon with a simple thermal method, Tellus, 41B, 379–390, 1989.
Clarke, A. D.: A thermooptic technique for in-situ analysis of size-resolved aerosol physicochemistry, Atmospheric Environment, 25A, 635–644, 1989.
Covert, D. S., Wiedensohler, A., Aalto, P., Heintzenberg, J., Mc-Murry, P. H., and Leck, C.: Aerosol number size distributions
from 3 to 500 nm diameter in the arctic marine boundary layer during summer and autumn, Tellus, 48B, 197–212, 1996. Donaldson, K., Stone, V., Clouter, A., Renwick, L., and MacNee,
W.: Ultrafine particles, J. Occup. Environ. Medicine, 58, 194– 199, 2001.
Dorling, S. R., Davies, T. D., and Pierce, C. E.: Cluster analysis: a technique for estimating the synoptic meteorological controls on air and precipitation chemistry - method and applications, At-mos. Environ., 26A, 2575–2581, 1992.
Draxler, R. R. and Hess, G. D.: Description of the HYSPLIT4 mod-eling system, NOAA Technical Memorandum, ERL, ARL–224, 2004.
Geb, M.: Klimatologische Grundlagen der Luftmassenbestimmung, (in German), Beilage zur Berliner Wetterkarte 50/81, Institut f¨ur Meteorologie, Freie Universit¨at Berlin, 1981.
Harris, S. J. and Maricq, M. M.: Signature size distributions for diesel and gasoline engine exhaust particulate matter, J. Aerosol Sci., 32, 749–764, 2001.
Haywood, J. and Boucher, O.: Estimates of the direct and indirect radiative forcing due to tropospheric aerosols: A review, Rev. Geophys., 38, 513–543, 2000.
Heintzenberg, J. and Wendisch, M.: On the sensitivity of cloud albedo to the partitioning of particulate absorbers in cloudy air, Contr. Atmos. Phys., 69, 491–499, 1996.
Heintzenberg, J., Birmili, W., Wiedensohler, A., Nowak, A., and Tuch, T.: Structure, variability and persistence of the submicrom-eter marine aerosol, Tellus, 56B, 357–367, 2004.
Hoppel, W. A., Frick, G. M., Fitzgerald, J. W., and Larson, R. E.: Marine boundary layer measurements of new particle formation and the effects nonprecipitating clouds have on aerosol size dis-tribution, J. Geophys. Res., 99, 14 443–14 459, 1994.
Institut f¨ur Meteorologie: Berliner Wetterkarte, Freie Universit¨at Berlin, Germany, 2004.
Jacobson, M. Z.: Strong radiative heating due to the mixing state of black carbon in atmospheric aerosols, Nature, 409, 695–697, 2001.
Johnson, G. R., Ristovski, Z., and Morawska, L.: Method for mea-suring the hygroscopic behaviour of lower volatility fractions in an internally mixed aerosol, J. Aerosol Sci., 35, 443–455, 2004. Kalberer, M., Paulsen, D., Sax, M., Steinbacher, M., Dommen, J.,
Prevot, A. S. H., Fisseha, R., Weingartner, E., Franevich, V., Zenobi, R., and Baltensperger, U.: Identification of polymers as major components of atmospheric organic aerosols, Science, 303, 1659–1662, 2004.
Koponen, I., Virkkula, A., Hillamo, R., Kerminen, V.-M., and Kul-mala, M.: Number size distribution and concentrations of ma-rine aerosols: Observations during a cruise between the English Channel and the coast of Antarctica, J. Geophys. Res., 107, 4753, doi:10.1029/2002JD002533, 2002.
Kriv´acsy, Z., Hoffer, A., S´arv´ari, Z., Temesi, D., Baltensperger, U., Nyeki, S., Weingartner, E., Kleefeld, S., and Jennings, S. G.: Role of organic and black carbon in the chemical composition of atmospheric aerosol at European background sites, Atmos. Env-iron., 35, 6231–6244, 2001.
Kuhlbusch, T. A. J., Hertlein, A.-M., and Sch¨utz, L. W.: Sources, determination, monitoring, and transport of carbona-ceous aerosols in Mainz, Germany, Atmos. Environ., 32, 1097– 1110, 1998.

![Table 5. Back trajectory cluster analysis for 7 air mass types: General air mass properties, frequency of nucleation events, mean trace gas concentrations [µg/m 3 ], temperature (T) [ ◦ C] and wind speed (WS) [m s −1 ].](https://thumb-eu.123doks.com/thumbv2/123doknet/14629776.547955/14.892.93.803.149.297/trajectory-analysis-general-properties-frequency-nucleation-concentrations-temperature.webp)
