HAL Id: hal-01524156
https://hal.archives-ouvertes.fr/hal-01524156
Submitted on 17 May 2017HAL is a multi-disciplinary open access archive for the deposit and dissemination of sci-entific research documents, whether they are pub-lished or not. The documents may come from teaching and research institutions in France or abroad, or from public or private research centers.
L’archive ouverte pluridisciplinaire HAL, est destinée au dépôt et à la diffusion de documents scientifiques de niveau recherche, publiés ou non, émanant des établissements d’enseignement et de recherche français ou étrangers, des laboratoires publics ou privés.
Ligand-Induced Conformational Changes with Cation
Ejection upon Binding to Human Telomeric DNA
G-Quadruplexes
Adrien Marchand, Anton Granzhan, Keisuke Iida, Yamato Tsushima, Yue Ma,
Kazuo Nagasawa, Marie-Paule Teulade-Fichou, Valérie Gabelica
To cite this version:
Adrien Marchand, Anton Granzhan, Keisuke Iida, Yamato Tsushima, Yue Ma, et al.. Ligand-Induced Conformational Changes with Cation Ejection upon Binding to Human Telomeric DNA G-Quadruplexes. Journal of the American Chemical Society, American Chemical Society, 2015, 137 (2), pp.750-756. �10.1021/ja5099403�. �hal-01524156�
This document is the Accepted Manuscript version of a Published Work that appeared in final form in the Journal of the American Chemical Society, copyright © American Chemical Society after peer review and technical editing by the publisher. To access the final edited and published work see
http://dx.doi.org/10.1021/ja5099403
Ligand-induced conformational changes with cation ejection
upon binding to human telomeric DNA G-quadruplexes
Adrien Marchand,1,2 Anton Granzhan,3 Keisuke Iida,4 Yamato Tsushima,4 Yue Ma,4 Kazuo Naga‐ sawa,4 Marie‐Paule Teulade‐Fichou3 and Valérie Gabelica1,2,*
1 Univ. Bordeaux, IECB, ARNA Laboratory, 33600 Pessac, France. 2 Inserm, U869, ARNA Labora‐ tory, 33000 Bordeaux, France. 3 Institut Curie, Section Recherche, CNRS UMR176, Centre Univer‐ sitaire Paris XI, Bat. 110, 91405 Orsay, France. 4 Tokyo University of Agriculture & Technology. 2‐ 24‐16 Naka‐cho. 84‐8588 Koganei‐shi, Tokyo, Japan. KEYWORDS. DNA structures – Ligand – G‐quadruplexes – Mass spectrometry – Molecular recog‐ nition.
ABSTRACT: The rational design of ligands targeting hu‐
man telomeric DNA G‐q uadruplexes is a complex problem due to the structural polymorphism that these sequences can adopt in physiological conditions. Moreover, the ability of ligands to switch conformational equilibria between dif‐ ferent G‐quadruplex structures is often overlooked in docking approaches. Here, we demonstrate that three of the most potent G‐quadruplex ligands (360A, Phen‐DC3
and pyridostatin) induce conformational changes of telomeric DNA G‐quadruplexes to an antipar‐ allel structure (as determined by circular dichroism) containing only one specifically coordinated K+ (as determined by electrospray mass spectrometry), and hence presumably only two consecu‐ tive G‐quartets. Control ligands TrisQ, known to bind preferentially to hybrid than to antiparallel structures, and L2H2‐6M(2)OTD, known not to disrupt the hybrid‐1 structure, did not show such K+ removal. Instead, binding of the cyclic oxazole L2H2‐6M(2)OTD was accompanied by the up‐ take of one additional K+. Also contrasting with telomeric G‐quadruplexes, the parallel‐stranded Pu24‐myc G‐quadruplex, to which Phen‐DC3 is known to bind by end‐stacking, did not undergo cation removal upon ligand binding. Our study therefore evidences that very affine ligands can induce conformational switching of the human telomeric G‐quadruplexes to an antiparallel struc‐ ture, and that this conformational change is accompanied by removal of one inter‐quartet cation.
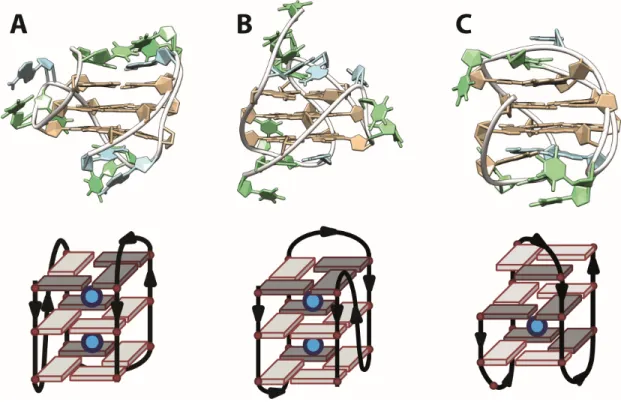
INTRODUCTION There is now strong evidence that guanine‐rich sequences can form G‐quadruplex (G4) struc‐ tures in human cells,1 including in the regions of telomeres that comprise a 3’‐overhang consisting of d(TTAGGG)n repeats. Ligands targeting telomeric G‐quadruplexes are developed as anticancer therapeutics, and some were shown to perturb telomere structure.2–5 Current screening assays usu‐ ally probe the ligand ability to bind to pre‐folded G‐quadruplexes with both high affinity and high selectivity as compared to double stranded DNA. The rational design of telomeric G4 ligands is however further complicated by the polymorphism that these sequences adopt in vitro6 and the ensuing uncertainties about which structures are rel‐ evant in vivo.7–10 For example, four‐repeat sequences containing the central core d(GGG(TTAGGG)3) have been shown to be able to form three different G‐quadruplex structures in 100 mM K+: Hybrid‐1 formed by sequences 24TTG11 (dTTGGG(TTAGGG)3A, Fig. 1A) or 23TAG (dTAGGG(TTAGGG)3), Hybrid‐2 formed by 26TTA12 (d(TTAGGG)4TT, Fig. 1B) and the two‐quartet Hybrid‐3 structure13 formed by 22GT (dGGG(TTAGGG)3T, Fig. 1C). FIGURE 1. Top, structures of human telomeric G‐quadruplexes obtained by NMR in 70 mM K+ and 20 mM K2HPO4/KH2PO4. Bottom, their respective schematic view with expected cation binding sites in‐between successive G‐quartets. A, Hybrid‐1 formed by 24TTG ‐ PDB ID: 2GKU.11 B, Hybrid‐ 2 formed by 26TTA ‐ PDB ID: 2JPZ.12 C, Hybrid‐3 formed by 22GT ‐ PDB ID: 2KF8.13 For full se‐ quences, see main text.
Some ligands were previously reported to bind better to the Na+‐structure or to the K+‐structure, as deduced from thermal denaturation and fluorescence displacement assays,14 but these studies did not discuss possible ligand‐induced changes in G‐quadruplex conformation. Other groups doc‐ umented ligand‐induced formation of particular G‐quadruplex structures,15–18 but with few excep‐ tions19 most of these studies were carried out in the absence of salt, so the relevance to physiologi‐ cally relevant conditions remains unclear.
We studied here the interaction of ligands Phen‐DC3,20 360A,21,22 pyridostatin23 (abbreviated PDS), TrisQ24, L2H2‐6M(2)OTD25 (abbreviated L2H2) and TMPyP4 (ligand structures in Chart 1, molar extinction coefficients in Supporting Information S1) with the different human telomeric sequences 26TTA, 24TTG, 23TAG and 22GT. Some of these ligands were previously shown to be very potent G4 binders and therefore have been used as G4 probes in a variety of biological systems and in cell‐based assays. For example, both 360A and PDS promote G4 specific DNA damage and induce growth arrest in human cancer cells.26,27 In addition functional derivatives of both com‐ pounds have been used for G4 imaging,26 pull down assays,28 in vitro selection of G4 DNA29 and more recently to photo‐cross‐link G‐quadruplexes.30 Finally, transcriptomic studies showed that both Phen‐DC3 and 360A affect the expression of genes with G4 motif in their transcription start site.31 More specifically, Phen‐DC3 has been used to trigger quadruplex‐dependent genetic insta‐ bility in yeast32,33 and subsequently was shown to inhibit the unwinding activity of FANCJ hel‐ icase.34
Despite their wide use, the exact binding mode of these ligands to telomeric G‐quadruplex is not known. Indeed, only a few structures of the human telomeric sequence in presence of ligands have been released. Except for L2H2 for which NMR revealed binding to the 24TTG sequence without changing the hybrid‐1 G‐quadruplex topology,25 all reported structures of the human telomeric DNA interacting with ligands are parallel G‐quadruplexes obtained by x‐ray crystallography.35–41 Unfortunately, crystallization is known to bias the structural population by selecting the parallel topology.42 There is therefore a strong need for in‐solution assays able to quickly assess ligand binding affin‐ ity and binding mode in polymorphic G‐quadruplexes such as the human telomeric sequence. Here we used native electrospray mass spectrometry (ESI‐MS) to assay ligand ability to bind to G‐quad‐ ruplexes. Thanks to the mass separation, single cation binding can be distinguished in the free and bound quadruplexes. Our experiments revealed ligand‐induced cation ejection upon binding, thereby providing novel insight into the ligand binding mode.
Chart 1. Ligand structures
RESULTS AND DISCUSSIONS
Ligand and cation binding, simultaneously probed by ESI‐MS, reveals K+ ejection upon
binding of 360A, Phen‐DC3 or PDS to telomeric DNA G‐quadruplexes.
We recently reported a sample preparation method in 100 mM trimethylammonium acetate (TMAA) and up to 1 mM KCl, which allows recording ESI‐MS spectra in conditions where the so‐ lution fold is very similar as in 100 mM K+, as indicated by CD spectroscopy,43 although the fraction folded at room temperature is somewhat lesser in 100 mM TMAA and 1 mM KCl than in 100 mM K+ (see melting experiments in supporting Figure S2 and separate discussion of 22GT below). In TMAA/KCl conditions, ESI‐MS allows the direct simultaneous measurement of ligand and cation binding stoichiometries from KCl solutions. On the contrary to the commonly used ammonium acetate conditions,44 the determination of potassium ion binding stoichiometry by ESI‐MS from TMAA/KCl preparations is robust and independent of instrument choice or tune.43
Figure 2 shows the ESI‐MS spectra of 5 µM 24TTG in 100 mM TMAA and 1 mM KCl without ligand (Figure 2A), a reference single‐strand 24nonG4 (dTGGGATGCGACAGAGAGGACGGGA) without ligand (Figure 2B), and 5 µM 24TTG incubated for three days at room temperature in the
presence of 5 µM ligand (Figures 2C‐H) (1 day to 1 month, or annealing did not make any differ‐ ence). Figure 2 shows the mass spectral region corresponding to free G4 and the 1:1 complex in the 5‐ charge state. Full‐scale spectra in SI (Figure S3) illustrate that the 2:1 complex abundance is very minor. Ligand relative affinities are estimated from the relative intensities of the peaks without and with ligands. The relative abundance of 1:1 complex relative to free G4 ranked: Phen‐DC3 ~ TrisQ ~ 360A > PDS ~ L2H2 > TMPyP4. Similar ranking was obtained with 26TTA, 23TAG and 22GT (Figure S4, S5 and S6, respectively). Tests with a reference hairpin duplex (ds26) allowed us to assess ligand binding selectivity (Figure S7). TMPyP4 binds very strongly to the hairpin duplex, in line with its known total lack of selectivity. TrisQ binds to the duplex, but less well as to the G‐quadruplexes. The other four ligands do not bind to the hairpin and are confirmed as very selective G‐quadruplex binders. FIGURE 2. Electrospray mass spectra (all in in 100 mM TMAA + 1 mM KCl) of (A) 5 µM 24TTG alone, (B) 24nonG4 alone, (C‐H) 5 µM 24TTG incubated 3 days with 5 µM of each ligand: (C) 360A, (D) TrisQ, (E) Phen‐DC3, (F) L2H2, (G) PDS and (H) TMPyP4.
Labels in Figure 2 also show the major specific K+ binding stoichiometries in each complex. Without ligand, 24TTG specifically binds two K+ ions (Figure 2A), in line with its known three‐ quartet NMR structure (Figure 1A), and with the known inter‐quartet octahedral K+ coordination mode. The additional K+ binding (third and fourth adduct) detected on the right hand side of the peak shows the same distribution as for 24nonG4 (first and second adduct) and are therefore non‐
specifically bound adducts. In order to distinguish and quantify quadruplex‐specific K+ adducts, we used the following method described by Klassen’s group.45 Briefly, a control molecule, as similar as possible to the analyzed molecule but lacking the specific K+ binding sites, is used as a reference. The intensity ratios of the K+‐bound versus unbound reference are taken as the signature of the nonspecific adducts distribution. This intensity distribution is then used to subtract nonspecific adducts contribution for other analytes. Using non‐G4 forming sequences (as confirmed by CD, see Figure S8) with same guanine content and length as each quadruplex, we reconstructed the specific K+ distributions for each complex in the form of bar graphs (see supporting text and Figure S9 for detailed method and Figure S10 for results), which reflect what is annotated in the raw mass spectra of Figure 2.
Strikingly, the K+ binding stoichiometry is affected by ligand binding, in a ligand‐dependent manner, and the same behavior is observed for all four variants of the human telomeric sequence (24TTG, 23TAG, 26TTA and 22GT; see Figure S10). For 360A, Phen‐DC3 and PDS, a single K+ ion is bound to the 1:1 complex, while two are bound to the free G4. In contrast, TrisQ only very partially displaced one cation. Because K+ is supposedly coordinated in‐between consecutive G‐quartets, a 1:1:1 (DNA:ligand:K+) stoichiometry suggests that the ligand‐bound structure contains only two consecutive G‐quartets. It is particularly interesting that the 24TTG sequence, one of the most monomorphic variants of the human telomeric sequence in KCl, as shown by NMR,11 is capable of such ligand‐induced rear‐ rangement. In order to prove that the observed stoichiometries are indeed the ones present in solution and are not due to some kind of mass spectrometry artifact, we repeated the experiment with L2H2, which was previously shown by NMR to bind to 24TTG without changing its topology.25 The two inter‐quartet K+ binding sites should therefore be preserved. Moreover, cyclic oxazoles might even capture one extra K+ ion by coordination, in the same way as telomestatin.46,47 This is exactly what we observe in our mass spectra: the 1:1 DNA:ligand complex was detected with either two or three K+ ions bound (Figure 2F).
As a second control we used the Pu24 c‐myc sequence (dTGAG3TG4AG3TG4AAG2). Indeed, the recently published structure of Pu24 interacting with Phen‐DC3 revealed that this ligand did not disrupt the parallel‐stranded three‐quartet structure.48 When analyzed by ESI‐MS in the TMAA/KCl preparation (Figure S11), the Pu24 sequence retains the expected two K+ ions, both without ligand and with all ligands including Phen‐DC3. Coordination of a third K+ ion with L2H2 is observed as well. The CD spectra were not affected upon ligand binding to Pu24 (Figure S12). These controls highlight that cation removal upon binding of 360A, Phen‐DC3 and PDS is a bind‐ ing mode that is peculiar to the human telomeric G‐quadruplexes.
Circular dichroism spectroscopy indicates that the G‐quartets in the 1‐K+ form have alter‐ nated stacking. In order to obtain information about conformational changes occurring upon ligand binding and cation ejection, we performed CD experiments on the same solutions. The CD spectra give infor‐ mation on the stacking mode of consecutive guanines. Type‐I spectra (positive peak at 265 nm, negative peak at 240 nm) indicate guanine stacking all in the same orientation (e.g., anti‐anti), type‐II spectra (positive peaks at 265 and 295 nm, negative peak at 240 nm) indicate guanine stack‐ ing partly in the same, and partly in alternating orientation (e.g., anti‐syn or syn‐anti), and type‐ III spectra (positive peaks at 295 and 240 nm, negative peak at 260 nm) indicate guanine stacking in exclusively alternating orientations.49 If mixtures are present, the CD spectrum will be the weighted average spectrum of all conformers present in solution and may resemble Type‐II spectra. Figure 3A illustrates the CD spectral changes observed when adding ligands to 24TTG (hybrid‐1 structure with CD spectrum of Type II). In the case of Phen‐DC3, 360A and PDS, the CD spectra are shifting to Type‐III, indicating exclusively alternated stacking. In the corresponding ESI‐MS spectra, almost all 24TTG is bound to 360A or Phen‐DC3 in a 1:1:1 (DNA:ligand:K+) stoichiometry. The 1‐K+ and presumably 2‐quartet, ligand‐bound structure has therefore the alternate G‐quartet stacking typically encountered in antiparallel folds. For PDS, ESI‐MS tells us that some free 24TTG remains, explaining the lesser shift of the CD spectrum compared to 360A and Phen‐DC3, but the ligand‐bound structure has the same characterisctics. In the cases of TrisQ and L2H2, the CD spec‐ tra of 24TTG are almost unaffected. The same results are obtained for 26TTA, 23TAG and 22GT (supporting Figures S13, S14 an S15, respectively). Figure 3B shows the CD spectra recorded in 100 mM KCl. In 100 mM TMAA + 1 mM KCl condi‐ tions, the CD spectrum of 24TTG alone is the same as in 100 mM KCl.43 The ligand ability to induce a shift to the Type‐III spectrum is still observed, although to a lesser extent than in TMAA/KCl, probably due to the higher stability of the hybrid‐1 structure in high KCl concentration. Phen‐DC3 is clearly the most prone to change the G‐quadruplex structure upon binding, even in 100 mM KCl.
Discussion: some of the most affine and selective G‐quadruplex ligands display a new binding mode with ligand‐induced cation ejection.
The ligand‐bound G‐quadruplex structure containing only two quartets (as deduced from the number of K+ ions coordinated) displays alternated stacking (as deduced from CD). Conversely, the ligands that do not displace cations do not lead to such antiparallel‐type CD spectra. There are mainly three hypotheses on what this ligand‐bound G‐quadruplex structure could be (Figure 4): (1) a structure with ligand intercalation (the ligand would take the place of one K+), (2) a hybrid‐1
or hybrid‐2 type structure with the quartet in homo‐stacking disrupted, or (3) a hybrid‐3 type structure with 2 quartets and with the triplet stacking hampered by ligand end‐stacking.
FIGURE 3. Circular dichroism spectra of 5 µM 24TTG in (A) 100 mM TMAA + 1 mM KCl and in (B) 20 mM KH2PO4/K2HPO4 + 70 mM KCl. CD spectra were recorded after 3 days without ligand (black) and in the presence of Phen‐DC3 (yellow), 360A (red), PDS (green), L2H2 (orange) and TrisQ (blue). FIGURE 4. Ligand binding modes compatible with our data: (A) an intercalated ligand on a hybrid‐ 2 G‐quadruplex, (B) a ligand disrupting a quartet of a hybrid‐2 G4 and (C) a ligand taking the place of the triplet of guanines in a hybrid‐3 G4.
To our knowledge, only one study to date has reported ligand intercalation in G‐quadruplexes, with TMPyP4 intercalation in long parallel G‐wires.50 However, intercalation in the G‐wires only occurred in absence of salt. Here, true intercalation (Fig. 4A) would probably involve a strong structural rearrangement with first a G‐quartet opening and K+ displacement before closing again the G‐quartet by sandwiching the ligand. G‐quartet opening and K+ displacement are of course unfavorable thermodynamically, but in turn, four guanines will gain conformational degrees of freedom, and that a solvated K+ will be released from the complex, so the penalty might be com‐ pensated by the free energy gained upon ligand binding. However, it seems difficult to assume that re‐closing of the G‐quartet on the other side of the ligand would be thermodynamically favorable, because the small enthalpically favorable contribution due to extra stacking would be compensated entropically by reducing the degrees of freedom. The binding mode of Figure 4B is therefore more likely than that of Figure 4A. The second hypothesis, namely the disruption of G‐quartets (Figure 4B), was proposed previously for an anthrathiophenedione on telomeric G4,19 for TMPyP4 on an RNA G4,51 and for a triarylpyri‐ dine ligand on c‐kit1 and c‐kit2.52 However in all reports these ligands were promoting total un‐ folding of the G‐quadruplexes. In our case the melting temperature of the G‐quadruplexes with the ligands are higher than without ligand (see supporting information Figures S16 and S17), mean‐ ing that the ligand‐bound 2‐quartet structure is more thermally stable than the starting structure. Also the broad melting transitions of 360A and Phen‐DC3 complexes are typical of multi‐step de‐ naturation that may indicate conformational rearrangements.53 However, the thermal denatura‐ tion transition is narrower and at lower temperature for PDS, indicating that ligand binding mode and thermal stability are not necessarily linked: these are two different tenets of ligand binding that must both be characterized. For example, the relative abundance of 1:1 complex relative to free G4 at RT (see Figures S3—S6) correlates well with the Tm only for the three ligand sharing the newly described binding mode: Phen‐DC3 > 360A > PDS. Ligand L2H2, although having a different binding mode without disturbing the structure and with an additional potassium ion, also fit in this trend, with an affinity in the same range as that of PDS. Ligand TrisQ, with its propensity to induce more parallel structures either at RT (with 26TTA, see Fig. S17) or at higher temperature (with 24TTG, see Fig. S16), does however follow different rules. In general, studies of the ligand binding mode and ligand‐induced conformational changes should also consider the temperature dependence of these phenomena. The last hypothesis is the ligand‐induced conformational selection of a hybrid‐3 structure such as that formed predominantly by 22GT. This structure contains only 2 quartets at 100 mM K+, plus a triplet of guanines stacked on one terminal quartet.13 Notably, this 2‐quartet structure is as ther‐ mally stable as the other 3‐quartet structures,13 (Figure S2) and therefore extra stabilization by a
ligand sounds reasonable. To further explore the correlation between the potassium binding stoi‐ chiometry and the hybrid‐3 structure, we titrated 22GT by KCl, from 0 to 1 mM using ESI‐MS and CD, and up to 100 mM using CD (Figure S18). In pure TMAA and no KCl, the DNA remains un‐ folded.43 Interestingly, at 200 µM KCl concentration, the main stoichiometry observed is 1 K+ per DNA strand and the corresponding CD spectrum is purely antiparallel, just like in the presence of ligands 360A, Phen‐DC3 and PDS. We therefore assign the first K+ binding event to the binding site between the two full G‐quartets of hybrid‐3. At 1 mM KCl concentration, a second potassium ion binding site is detected, which we attribute to the filling of a second binding site between the G‐triplet and one G‐quartet. In the same solution, the CD spectra show that the hump at 270 nm, attributed to the stacking of the triplet,49 is increasing accordingly. Ligand binding to the hybrid‐3 by end‐stacking on the top quartet would disrupt triplet stacking, and this binding mode is there‐ fore compatible with all our observations. CONCLUSIONS In summary, we evidenced here that ligands can induce conformational changes in human telo‐ meric G‐quadruplexes at physiological ionic strength and in KCl. Three ligands (Phen‐DC3, 360A and PDS), among the most potent described to date, were found to favor G4 structures with only one K+, hence two consecutive G‐quartets, and hetero‐stacking between these G‐quartets. This ligand‐induced K+ ejection could be due to a quartet disruption of hybrid structures or to the con‐ formational selection of the hybrid‐3 structure. Interestingly, only the three most flexible54 of the ligands tested here, all based on the dicarbox‐ amide scaffold (Phen‐DC3, 360A and PDC), are capable of ejecting K+ cation upon binding, while stabilizing the antiparallel 2‐quartet G‐quadruplex structure. It would be interesting in the future to explore the enthalpy and entropy contributions to ligand binding in those particular cases, and to partition the intrinsic folding thermodynamic parameters from the polyelectrolyte and water capture/release contributions. Although high‐resolution atomistic methods would be required to determine the exact binding mode, our work opens new ideas on possible G‐quadruplex ligand binding modes. It also highlights that thanks to ESI‐MS monitoring of cation binding, hints on the ligand binding mode can be obtained with small amounts of sample and even in the presence of polymorphic structures. The technique is amenable to higher‐throughput screening of ligands. Our results also have important implications for the design of ligands targeting polymorphic G‐ quadruplexes such as the human telomeric sequence. The availability of high resolution structures makes it tempting to develop drug design programs based on the lock‐and‐key model. In contrast, we show here that several ligands with high G‐quadruplex affinity and specificity induce structural changes in telomeric G‐quadruplexes, and that induced fit or conformational selection must there‐ fore be taken into account for the drug design.
EXPERIMENTAL SECTION
Materials. Oligonucleotides were purchased lyophilized and RP‐cartridge purified from Euro‐
gentec (Seraing, Belgium) and used without further purification. We used the following nomen‐ clature for the DNA sequences: 26TTA = d((TTAGGG)4TT); 24TTG = d(TT(GGGTTA)3GGGA); 23TAG = d(TA(GGGTTA)3GGG); 22GT = d((GGGTTA)3GGGT); Pu24 c‐myc = d(TGAGGGTGGGGAGGGTGGGGAAGG), 24nonG4 = d(TGGGATGCGACAGAGAGGACGGGA), 22nonG4 = d(GGGATGCGACAGAGAGGACGGG), 23nonG4 = d(TGGGATGCGACAGAGAGGACGGG), 26nonG4 = d(TTGGGATGCGACAGAGAGGACGGGAT), and ds26 = d(CA2TCG2ATCGA2T2CGATC2GAT2G). Analyzed solutions contained 5 µM DNA di‐ luted from 200‐µM stock solution. Water was nuclease‐free from Ambion (Applied Biosystems, Lennik, Belgium). The concentrations of the initial stocks solutions were measured by UV absorb‐ ance at 260 nm on a Uvikon XS. Molar absorption coefficients were obtained on the IDT website and corrected using Cavaluzzi‐Borer correction.55 100 mM trimethylammonium acetate (TMAA, Ultra for HPLC, Fluka analytical) was used to fix the ionic strength and the solutions were doped with up to 1 mM KCl (>99.999%, Sigma) as described previously.43 Ligands were either synthesized as described elsewhere (360A iodide salt, Phen‐DC3 methylsulfonate salt,20 TrisQ bromide salt,24 L2H2 trifluoroacetate salt56), or purchased from Sigma‐Aldrich (PDS trifluoroacetate salt and TMPyP4 p‐toluenesulfonate salt). When documented the molar absorption coefficients were used to measure concentration using the UV absorbance. When not known the powders were weighted and the coefficient was determined (Supporting Figure S1 summarizes all molar extinction coeffi‐ cients). 1:1 DNA:ligand molar ratios were used to acquire the ESI‐MS and the CD data. TMAA and KCl were first added to the water solution then the proper DNA solution volume is added. Ligands were added one hour after, to ensure starting from pre‐formed G‐quadruplex. Solutions were stored at room temperature in the dark before analysis. Annealing experiments were also per‐ formed on freshly prepared solutions, with 95 °C heating for 5 min then leaving the sample for 4 hours at room temperature before further analysis (results didn’t change any further when checked after one month left at RT, indicating that equilibrium was reached). Electrospray mass spectrometry. Native ESI‐MS spectra were obtained using a LCT Premier mass spectrometer (Waters, Manchester, UK). The source voltage is set to 2200 V. The desolvation temperature is 60 °C and the gas temperature is 40 °C. The source pressure is increased to 45 mbar (measured by a Center Two probe, Oerlikon Leybold Vacuum, Cologne, Germany). The sample cone voltage is 200 V. At this voltage TMA adducts on the mass spectra are totally avoided but the K+ stoichiometry is not affected. The syringe injection rate is 200 µL/h. Shown MS spectra are the sum of 3 min accumulations (1 scan per 1.1 sec). Savitzky‐Golay smoothing has been performed
with a smooth window of 5 points. Baselines were also subtracted using curves with a polynomial order of 40. Circular dichroism. CD experiments were run on a Jasco J‐815 spectrophotometer using a quartz cell of 2 mm path length. Shown spectra are the sum of 3 accumulations at 20 °C with a scan speed of 50 nm/min and an integration time of 0.5 s. Data were normalized to molar circular‐dichroic absorption ∆ε based on DNA concentration: ∆ε=θ/(32980×c×l), with θ the CD ellipticity in milide‐ grees, c is the DNA concentration in M (5 µM) and l is the cell length (2 mm). Baselines were subtracted using either 100 mM TMAA in water solution or 20 mM H2KPO4/K2HPO4 + 70 mM KCl depending on the experimental conditions. A second linear baseline was removed from the raw data using the mean value obtained for each experiment between 320–350 nm as no peak was ob‐ served in this area. A smoothing was then performed used LOWESS (locally weighted scatterplot smoothing) method. Reported CD spectra display raw data points and the smoothed curve. Melting monitored by CD. Melting experiments were performed on the same Jasco J‐815 spec‐ trophotometer. The temperature ramp was set to 0.4 °C/min from 4 to 90 °C. One spectrum per minute was acquired at 100 nm/min scan speed with 2 accumulations. The temperature ramp is stopped during each recording. A linear baseline was subtracted from the spectra using the mean value for each experiment between 320–350 nm. Melting monitored by UV absorbance. Melting experiments on the G‐quadruplexes without
ligands were also performed on a SAFAS UV mc² spectrophotometer (Montecarlo, Monaco) equipped with a Peltier temperature controller. The temperature ramp was 0.2 °C/min from 4 to 90 °C. The absorbance was monitored at 295 nm. ASSOCIATED CONTENT Supporting Information. Supplementary mass spectra, CD spectra, and CD‐melting data as de‐ scribed in the text are available free of charge from www.pubs.acs.org. AUTHOR INFORMATION Corresponding Author * Dr. Valérie Gabelica, U869 ARNA, IECB, 2 rue Robert Escarpit, F‐33607 Pessac, France; va‐ [email protected]. ACKNOWLEDGMENT This work was supported by the Inserm (ATIP‐Avenir Grant no. R12086GS to V.G.), the Conseil Régional Aquitaine (Grant no. 20121304005 to V.G.), and the EU (FP7‐PEOPLE‐2012‐CIG‐333611 to V.G.). AM benefited from an Inserm/CRA PhD fellowship.
REFERENCES (1) Biffi, G.; Tannahill, D.; McCafferty, J.; Balasubramanian, S. Nat. Chem. 2013, 5, 182. (2) Neidle, S. FEBS J. 2010, 277, 1118. (3) Rodriguez, R.; Müller, S.; Yeoman, J. A.; Trentesaux, C.; Riou, J.‐F.; Balasubramanian, S. J. Am. Chem. Soc. 2008, 130, 15758. (4) Gomez, D.; Wenner, T.; Brassart, B.; Douarre, C.; O’Donohue, M.‐F.; El Khoury, V.; Shin‐Ya, K.; Morjani, H.; Trentesaux, C.; Riou, J.‐F. J. Biol. Chem. 2006, 281, 38721. (5) Phatak, P.; Cookson, J. C.; Dai, F.; Smith, V.; Gartenhaus, R. B.; Stevens, M. F. G.; Burger, a M. Br. J. Cancer 2007, 96, 1223. (6) Tua, A.; Phan, A. T. FEBS J. 2010, 277, 1107. (7) Miller, M. C.; Buscaglia, R.; Chaires, J. B.; Lane, A. N.; Trent, J. O. J. Am. Chem. Soc. 2010, 132, 17105. (8) Hänsel, R.; Löhr, F.; Foldynová‐Trantírková, S.; Bamberg, E.; Trantírek, L.; Dötsch, V. Nucleic Acids Res. 2011, 39, 5768. (9) Kan, Z.‐Y.; Yao, Y.; Wang, P.; Li, X.‐H.; Hao, Y.‐H.; Tan, Z. Angew. Chem. Int. Ed. Engl. 2006, 45, 1629. (10) Chaires, J. B. FEBS J. 2010, 277, 1098. (11) Luu, K. N.; Phan, A. T.; Kuryavyi, V.; Lacroix, L.; Patel, D. J. J. Am. Chem. Soc. 2006, 128, 9963. (12) Dai, J.; Carver, M.; Punchihewa, C.; Jones, R. a; Yang, D. Nucleic Acids Res. 2007, 35, 4927. (13) Lim, K. W.; Amrane, S.; Bouaziz, S.; Xu, W.; Mu, Y.; Patel, D. J.; Luu, K. N.; Phan, A. T. J. Am. Chem. Soc. 2009, 131, 4301. (14) Chen, M.; Song, G.; Wang, C.; Hu, D.; Ren, J.; Qu, X. Biophys. J. 2009, 97, 2014. (15) Nakatani, K.; Hagihara, S.; Sando, S.; Sakamoto, S.; Yamaguchi, K.; Maesawa, C.; Saito, I. J. Am. Chem. Soc. 2003, 125, 662. (16) Rahman, K. M.; Reszka, A. P.; Gunaratnam, M.; Haider, S. M.; Howard, P. W.; Fox, K. R.; Neidle, S.; Thurston, D. E. Chem. Commun. (Camb). 2009, 4097. (17) Xu, L.; Xu, Z.; Shang, Y.; Feng, S.; Zhou, X. Bioorg. Med. Chem. Lett. 2012, 22, 2988. (18) Shi, S.; Geng, X.; Zhao, J.; Yao, T.; Wang, C.; Yang, D.; Zheng, L.; Ji, L. Biochimie 2010, 92, 370.
(19) Kaluzhny, D.; Ilyinsky, N.; Shchekotikhin, A.; Sinkevich, Y.; Tsvetkov, P. O.; Tsvetkov, V.; Veselovsky, A.; Livshits, M.; Borisova, O.; Shtil, A.; Shchyolkina, A. PLoS One 2011, 6, e27151.
(20) De Cian, A.; Delemos, E.; Mergny, J.‐L.; Teulade‐Fichou, M.‐P.; Monchaud, D. J. Am. Chem. Soc. 2007, 129, 1856.
(22) Granotier, C.; Pennarun, G.; Riou, L.; Hoffschir, F.; Gauthier, L. R.; De Cian, A.; Gomez, D.; Mandine, E.; Riou, J.‐F.; Mergny, J.‐L.; Mailliet, P.; Dutrillaux, B.; Boussin, F. D. Nucleic Acids Res. 2005, 33, 4182. (23) Koirala, D.; Dhakal, S.; Ashbridge, B.; Sannohe, Y.; Rodriguez, R.; Sugiyama, H.; Balasubra‐ manian, S.; Mao, H. Nat. Chem. 2011, 3, 782. (24) Bertrand, H.; Granzhan, A.; Monchaud, D.; Saettel, N.; Guillot, R.; Clifford, S.; Guédin, A.; Mergny, J.‐L.; Teulade‐Fichou, M.‐P. Chemistry 2011, 17, 4529. (25) Chung, W. J.; Heddi, B.; Tera, M.; Iida, K.; Nagasawa, K.; Phan, A. T. J. Am. Chem. Soc. 2013, 135, 13495. (26) Rodriguez, R.; Miller, K. M.; Forment, J. V; Bradshaw, C. R.; Nikan, M.; Britton, S.; Oelschlae‐ gel, T.; Xhemalce, B.; Balasubramanian, S.; Jackson, S. P. Nat. Chem. Biol. 2012, 8, 301. (27) Pennarun, G.; Granotier, C.; Hoffschir, F.; Mandine, E.; Biard, D.; Gauthier, L. R.; Boussin, F. D. Nucleic Acids Res. 2008, 36, 1741. (28) Lam, E. Y. N.; Beraldi, D.; Tannahill, D.; Balasubramanian, S. Nat. Commun. 2013, 4, 1796. (29) Renaud de la Faverie, A.; Hamon, F.; Di Primo, C.; Largy, E.; Dausse, E.; Delaurière, L.; Lan‐ dras‐Guetta, C.; Toulmé, J.‐J.; Teulade‐Fichou, M.‐P.; Mergny, J.‐L. Biochimie 2011, 93, 1357. (30) Verga, D.; Hamon, F.; Poyer, F.; Bombard, S.; Teulade‐Fichou, M.‐P. Angew. Chem. Int. Ed. Engl. 2014, 53, 994. (31) Halder, R.; Riou, J.‐F.; Teulade‐Fichou, M.‐P.; Frickey, T.; Hartig, J. S. BMC Res. Notes 2012, 5, 138.
(32) Piazza, A.; Boulé, J.‐B.; Lopes, J.; Mingo, K.; Largy, E.; Teulade‐Fichou, M.‐P.; Nicolas, A. Nucleic Acids Res. 2010, 38, 4337. (33) Lopes, J.; Piazza, A.; Bermejo, R.; Kriegsman, B.; Colosio, A.; Teulade‐Fichou, M.‐P.; Foiani, M.; Nicolas, A. EMBO J. 2011, 30, 4033. (34) Bharti, S. K.; Sommers, J. a; George, F.; Kuper, J.; Hamon, F.; Shin‐ya, K.; Teulade‐Fichou, M.‐P.; Kisker, C.; Brosh, R. M. J. Biol. Chem. 2013, 288, 28217. (35) Parkinson, G. N.; Ghosh, R.; Neidle, S. Biochemistry 2007, 46, 2390. (36) Bazzicalupi, C.; Ferraroni, M.; Bilia, A. R.; Scheggi, F.; Gratteri, P. Nucleic Acids Res. 2013, 41, 632. (37) Campbell, N. H.; Karim, N. H. A.; Parkinson, G. N.; Gunaratnam, M.; Petrucci, V.; Todd, A. K.; Vilar, R.; Neidle, S. J. Med. Chem. 2012, 55, 209. (38) Micco, M.; Collie, G. W.; Dale, A. G.; Ohnmacht, S. a; Pazitna, I.; Gunaratnam, M.; Reszka, A. P.; Neidle, S. J. Med. Chem. 2013, 56, 2959. (39) Collie, G. W.; Promontorio, R.; Hampel, S. M.; Micco, M.; Neidle, S.; Parkinson, G. N. J. Am. Chem. Soc. 2012, 134, 2723.
(40) Campbell, N. H.; Parkinson, G. N.; Reszka, A. P.; Neidle, S. J. Am. Chem. Soc. 2008, 130, 6722. (41) Parkinson, G. N.; Cuenca, F.; Neidle, S. J. Mol. Biol. 2008, 381, 1145. (42) Li, J.; Correia, J. J.; Wang, L.; Trent, J. O.; Chaires, J. B. Nucleic Acids Res. 2005, 33, 4649. (43) Marchand, A.; Gabelica, V. J. Am. Soc. Mass Spectrom. 2014, 25, 1146. (44) Balthasart, F.; Plavec, J.; Gabelica, V. J. Am. Soc. Mass Spectrom. 2013, 24, 1. (45) Sun, J.; Kitova, E. N.; Wang, W.; Klassen, J. S. Anal. Chem. 2006, 78, 3010. (46) Rosu, F.; Gabelica, V.; Smargiasso, N.; Mazzucchelli, G.; Shin‐Ya, K.; De Pauw, E. J. Nucleic Acids 2010, 2010, 1. (47) Linder, J.; Garner, T. P.; Williams, H. E. L.; Searle, M. S.; Moody, C. J. J. Am. Chem. Soc. 2011, 133, 1044. (48) Chung, W. J.; Heddi, B.; Hamon, F.; Teulade‐Fichou, M.‐P.; Phan, A. T. Angew. Chem. Int. Ed. Engl. 2013, 1. (49) Karsisiotis, A. I.; Hessari, N. M.; Novellino, E.; Spada, G. P.; Randazzo, A.; Webba da Silva, M. Angew. Chem. Int. Ed. Engl. 2011, 50, 10645. (50) Lubitz, I.; Borovok, N.; Kotlyar, A. Biochemistry 2007, 46, 12925. (51) Morris, M. J.; Wingate, K. L.; Silwal, J.; Leeper, T. C.; Basu, S. Nucleic Acids Res. 2012, 40, 4137. (52) Waller, Z. A. E.; Sewitz, S. A.; Hsu, S.‐T. D.; Balasubramanian, S. J. Am. Chem. Soc. 2009, 131, 12628. (53) Buscaglia, R.; Gray, R. D.; Chaires, J. B. Biopolymers 2013, 99, 1006. (54) Monchaud, D.; Yang, P.; Lacroix, L.; Teulade‐Fichou, M.‐P.; Mergny, J.‐L. Angew. Chem. Int. Ed. Engl. 2008, 47, 4858. (55) Cavaluzzi, M. J.; Borer, P. N. Nucleic Acids Res. 2004, 32, e13. (56) Tera, M.; Ishizuka, H.; Takagi, M.; Suganuma, M.; Shin‐ya, K.; Nagasawa, K. Angew. Chem. Int. Ed. Engl. 2008, 47, 5557.