#
3D micro-computed tomography of
trabecular and cortical bone
architecture with application to a rat
model of immobilisation osteoporosis
A. Laib I O. Barou 2 L. V i c o 2 M . H . L a f a g e - P r o u s t 2 C. A l e x a n d r e 2 P. R / i g s e g g e r 1
1Institute for Biomedical Engineering, University of Z/]rich and Swiss Federal Institute of Technology (ETH), Zfirich, Switzerland
2Laboratory of Bone Biology and Biochemistry, Saint-Etienne University, Saint-Etienne, France Abstract--Bone mass and microarchitecture are the main determinants of bone strength. Three-dimensional micro-computed t o m o g r a p h y has the potential to examine complete bones of small laboratory animals with very high resolution in a non-invasive way. In the presented work, the p r o x i m a l part of the tibiae of h i n d l i m b unloaded and control rats were measured with 3D MicroCT, and the secondary spongiosa of the scanned region was evaluated using direct evaluation techniques that do not require m o d e l assumptions. For determination of the complete bone status, the cortex of the tibiae was evaluated and characterised b y its thickness. It is shown that with the proposed anatomically conforming volume of interest (VOI), up to an eight-fold volume increase can be evaluated compared to cubic or spherical VOls. A pronounced trabecular bone loss o f - 5 0 % is seen after 23 days of tail suspension. With the n e w evaluation techniques, it is shown that most of this bone loss is caused b y the thinning of trabeculae, and to a lesser extent b y a decrease in their number. What changes m o s t radically is the structure type: the remaining bone is more rod-like than the control group's bone. Cortical bone decreases less than trabecular bone, with o n l y - 18 % after 23 days.
K e y w o r d s - - C o m p u t e d t o m o g r a p h y (CT), Micro CT, Bone microarchitecture, Rat tibia, Osteoporosis, M o r p h o l o g y
Med. Biol. Eng. Comput., 2000, 38, 326-332
J
1. I n t r o d u c t i o n
MASS AND architecture are the prime factors influencing the mechanical properties of bone (KtEEREKOPER et al., 1985; MAJUMDAR et al., 1996; PARFITT, 1992; ROGSEGGER, 1996a, VAN RIETBERGEN et aL, 1998). There are currently medications available that increase bone mass in osteoporotic patients, but bone strength is not increased and fracture risk is not lowered as much as expected by the gain in bone density (RIGGS et al.,
1990). This suggests that the complex microarchitecmre has an important influence on the mechanical competence of bone. in a study with cancellous bone samples from various sites of the human skeleton it was found (ULRICH et al., 1999) that 52 % to 67% of the elastic modulus is explained by bone density. including structural indices such as trabecular number, separa- tion and degree of anisotropy, the predictive power is increased to 80-92 %. These findings are typical for samples of cancel- lous bone (GOULET et aL, 1994; TURNER et aL, 1988).
Correspondence should be addressed to Dr A. Laib e-mail: [email protected]
First received 31 August 1999 and in final form 13 January 2000 © IFMBE:2000
However, the distribution of cancellous bone is heterogeneous and the question arises as to what extent an evaluated bone sample represents the general trend in the skeleton of the subject, or - more modestly - in a specific bone of a subject. The problem is well known from 2D histomorphometry, where several fields of view are analysed to ease this problem (BIRKENHAGER-FRENKEL et al., 1988; SNYDER et al., 1993).
Using three-dimensional imaging techniques such as micro- computed tomography, synchrotron CT, micro-magnetic reso- nance imaging, and serial sectioning (BONSE et al., 1994; FELDKAMP, et al., 1989; H I P P e t aL, 1996; KINNEY and NICHOLS, 1992; ODGAARD, 1997; ROGSEGGER et al., 1996b), complete information on the microarchitecture has become available. For these measuring techniques the selection of a representative volume of interest (VOI) is a non-trivial task. it is especially crucial in time-serial examinations where the outcome of a study might well be influenced by the ability to follow a well-defined VOI.
In this work we describe the examination of the proximal part of the rat tibia. The rat is the most widely used animal model of osteoporosis, with ovariectomised rats generally accepted for screening different therapeutic agents and for studying basic effects of bone modelling and remodelling (MOSEKILDE, 1995). The technique proposed in this work
can also be applied to other animal models such as the mouse (for tibia, femur and vertebrae), or to bone biopsies from larger animals such as sheep or dogs. In this study a model of partial immobilisation of the rat, which unloads the hindlimbs, was used. A three-dimensional conforming volume of interest including the complete secondary spongiosa of the scanned region is used, and structural indices are evaluated with the help of model-independent direct 3D techniques. This is in contrast to traditional procedures where a cubic or spherical VOi (KAPADIA et al., 1998; KINNEY et al., 1998) is used and model-based structural indices are calculated.
Cortical bone was evaluated to give a comprehensive evaluation of the complete bone. To characterise the cortex we analysed its average thickness. Cortical density and moment of inertia are other parameters available from CT images, but are not considered in this work since the main emphasis is on structural information.
To document the behaviour of the proposed evaluation technique it was applied to a controlled experiment to study immobilisation-induced osteoporosis in the tail-suspended rat model.
2 Materials and m e t h o d s
2.1 M i c r o C T m e a s u r e m e n t s
The proximal part of the intact tibiae of rats were measured with a desk-top MicroCT (RO~SE~ER et al., 1996b], commer- cially available as pCT20*, it operates with a fan beam originating from a 10 pm focal-spot X-ray tube. The photons are detected in a 1024 linear diode array, and the projection data are computer-reconstructed into a 1024×1024 or 512×512 matrix. 3D information is obtained by stacking successively measured slices on top of each other. No sample preparation is required, and since MicroCT examinations are non-destructive the bones remain available for other examina- tion techniques afterwards. The chosen voxel size was 24 pm in all three spatial dimensions. For each sample, 240 slices were measured, covering a total of 5.76mm of the diaphysis and metaphysis. A 3D visualisation of a complete measurement is shown in Fig. 1.
2.2 A n i m a l s
Eighteen 14-week-old male Wistar rats were acclimatised for one week with standard conditions of temperature (23'=-4 - I=C) and light-controlled environment (12 h light-dark cycles). They were fed with standard rodent chow and water ad libitum. Then they were randomly divided into two groups, tail-suspended (S) and control (C). Rats were suspended without anesthesia according to a standard procedure previously described by MOREY (1979) using specially designed cages allowing the animals to walk on their forelimbs. The suspension angle was 30 '=, so that approximately 50 % of the body weight is loaded onto the forelimbs. Three animals of each group were sacrificed at days 7, 13 and 23 with anaesthesic overdose (Nesdonal 0.1 mgkg-1). Tibiae were immediately excised and fixed in ice-cold, phosphate-buffered formalin (pH 7.4) and then placed in 70 % alcohol. The procedure for the care, experimental protocol and killing of the study animals was in accordance with the European Commtmity standards on the care and use of laboratory animals (Ministbre de l'Agriculture, France, author- ization no. 04827).
*Scanco Medical Bassersdorf, Switzerland
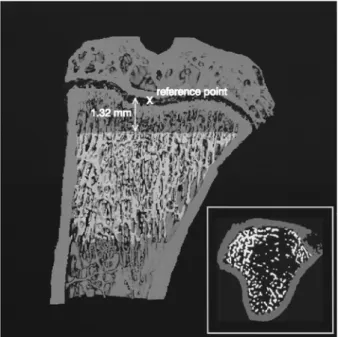
Fig. 1 Cut through the 3D image o f a MicroCT measurement o f a control rat. The conforming VOI is highlighted. The reference point at the end o f the epiplLvsis is shown as a cross, fi'om which the conforming region starts at a fixed distance o f 1.32mm. The inset shows a transaxial cut through the bone with the VOI highlighted
2.3 D e t e r m i n a t i o n o f trabecular VOI
An outer bone contour was produced automatically slice-by- slice, following a rough contour that had been drawn by hand in the starting slice. Contour finding is based on a steepest gradient determination of the gray-scale levels of background (alcohol in this case) versus tibia cortex, with side conditions of maximum curvature and connectedness of isolated, single parts to ensure robustness against pixel noise (MONCH, 1991).
To analyse the trabecular part of the tibiae, the compact part of the bone was masked in the following way: with a three- dimensional box-shaped low-pass filter (support of 13 voxels in each spatial direction) applied to the original gray-scale CT images, an artificial partial volume effect was created, which blurred out the individual trabectflae, but left the dense compact shell intact. The cortex mask was then extracted with a simple thresholding operation with a fixed threshold of 15.0 % of the maximal gray-scale value, isolated speckles remaining on the inside of the cortex mask were removed with a slicewise component labelling and extraction of the main component, i.e. the cortex. To determine the region of interest in the axial direction, a reference point was found visually (Fig. 1) and then the region of interest in our fixed distance of 55 slices ( = 1.32mm) with a length of 4.32mm ( = 180 slices) was chosen automatically. The distance of 1.32mm was chosen such that no primary spongiosa was included in the trabecular VOI in any of the samples.
2.4 Segmentation and 3 D m o r p h o m e t r i c evahtation o f trabecular VOI
The gray-value images were segmented using a low-pass filter to remove noise and a fixed threshold to extract the mineralised bone phase (Gaussian filter with s = 0.7 voxels and threshold 10.5 % of maximal gray-scale value).
Bone volume BV and bone surface BS were calculated using a tetrahedron meshing technique generated with the Marching Cubes method (LORENSEN and CLINE, 1987). Total volume TV was calculated from the volume of the conforming VOI. Mean
trabecular number, mean trabecular thickness, and mean trabecular separation were calculated using newly developed direct techniques based on the distance transformation (HILDEBRAND and RC,)GSEGGER, 1997a, HILDEBRAND et aL,
1999) of the binary object, and were denoted Tb.N*, Tb.Th* and Tb. Sp*, respectively (asterisks are used to distinguish them from the indices Tb.N, Tb.Th, Tb.Sp calculated according to PARFITT et al., (1983). Even though the discrete representation of the structure with 24 gm voxels is relatively coarse in comparison to the thickness of trabeculae, the very large number of voxels over which the mean values of thickness and separation are calculated (in this study of the order of 3 000 000 voxels per sample) still assures reliable values for these indices. In a previous study (PEYRIN et al., 1998) measurements of bone samples from human vertebrae made with our MicroCT were compared with those made using a 6.6 gm Synchrotron CT. The correlations between the two procedures were above 0.93 for BV/TV, Tb.N*, Tb.Sp* and Tb.Th*.
An estimation of the plate-rod characteristic of the structure is achieved using the Structure Model Index, SMI (HILDEBRAND and ROESEGGAR, 1997b, HILDEBRAND et al.,
1997c]. it is calculated by a differential analysis of a triangu- lated surface of a structure and is defined as
d B S B V . - -
SMI = 6- dr
B S 2
where d B S / d r is the surface area derivative with respect to a linear measure r, corresponding to the half-thickness or the radius assumed constant over the entire structure. This deriva- tive is estimated by a simulated thickening of the structure by translating the triangulated surface a small extent in its normal direction and dividing the associated change of surface area with the length of the extent. For an ideal plate and rod structure the SMI value is 0 and 3, respectively. For a structure with both plates and rods of equal thickness the value is between 0 and 3, depending on the volume ratio between rods and plates.
The geometrical degree of anisotropy, DA, is usually defined as the ratio between the maximum and the minimum radius of the m e a n intercept length (MIL) ellipsoid (HARRIGAN and MANN, 1984; WHITEHOUSE, 1974). For our irregular volumes, however, we did not use test lines through the volume, but calculated a direction distribution of the projected triangulated surfaces by calculating the scalar product of the area weighted normal vector of each surface triangle with the discretised directions of the direction distribution. This distri- bution corresponds to the inverse of the usually computed intercept length distribution. The 'quasi MIL' ellipsoid is then calculated by fitting the inverse directional projected surface distribution to an ellipsoid using a least squares fit. The advantage of not using test lines is the avoidance of sampling problems inherent in the MIL method, proven in SIMMONS and HIPP (1997) to lead to variations of as much as 52 % in the MIL indices.
The artificial surfaces of the 'cut' trabeculae created by the boundaries of the VOI were suppressed in the calculation of all the surface-related indices such as BS, SMI and DA, so that the inherent anisotropy of the conforming VOI induces no bias into the results.
Connectivity density, (Conn.D.) was calculated using the Euler method of ODGAAaD and GUNDEaSEN (1993). The axial borders (flat top and bottom) were treated with the boundary correction as described in ODGAAaD and GUNDEaSEN (1993) for unknown continuation of objects. To deal with the problem of the conforming transaxial boundary, we placed a one-voxel shell around the VOI again before calculating Conn.D.,
because we knew that originally all the trabeculae at the boundary were going into the cortex and were thus connected to each other.
2.5 D e t e r m i n a t i o n and thicA77ess evahtation o f cortical VOI
Although cancellous bone is the main target when docu- menting changes due to disease and treatment since its turnover is eight times faster than that of cortical bone, cortical bone plays an equally important role with regard to mechanical stability. In cases of severe osteoporosis with very weak cancellous bone, load transfer occurs primarily via the cortex. Since in our measurement the whole proximal end of the tibia is measured, it is possible to evaluate not only cancellous bone, but also cortical bone. To analyse the cortex, the original images were low-pass filtered with a Gaussian filter (s = 3.0), and subsequently a threshold was applied of 10.0 %. The axial position and extent was identical with the trabecular volume. The trabecular region was masked out and a 3D component labelling of the cortex was additionally performed to extract the main connected component only. Then the cortex was eval- uated using the direct distance transformation method to calculate its thickness, i.e. spheres were 'blown up' in the cortex and the mean of the diameter of these spheres was calculated.
3 Results
The success of the conformity of the trabecular VOI is shown in Figs 1 and 2. The complete trabecular part of the chosen axial extent is analysed, while none of the cortical shell intrudes. The VOI should be as large as possible to give representative results. Limits are given in the proximal direc- tion by the primary spongiosa, and in the distal direction by the fact that spongiosa 'peters out' and that no additional informa- tion is gained by the inclusion of an almost empty volume in both control and suspension rats. To decide which length of VOI might be meaningful we analysed two rats, a 7-day control rat and a 23-day suspended rat, at the beginning of the study, in Fig. 3 the relative difference of B V / T V of the two rats is plotted against the axial dimension of the conforming VOI. The curve shows large fluctuations at the beginning when very
Fig. 2 Same as Fig. 1 bttt for a 23-day sttspellded rat. The vohtme o f interest is highlighted, the inset shows a transaxial cut
- 5 4 % - 5 0 % rY- " - 4 6 % -42% - 3 8 % I I I 0 5 0 1 O0 1 5 0
axial dimension of VOI, slices Fig. 3
I I
2 0 0 2 5 0
Choice o f the axial exwnt o f the VOL The axial length o f the VOI is" then selected such that the relative amount o f analysed bone is" optimal with respect to the difference between control and suspended rats. Rat 1 is" a 7-day control rat, Rat 2 a 23- day suspended rat. The curve shows a maximum around 180 slices"
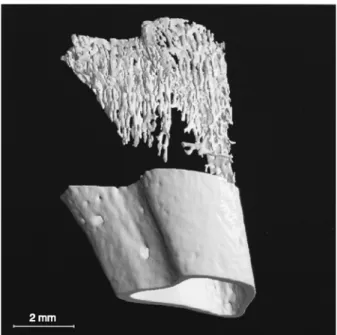
Fig. 4 'Exploded' view o f cancellous and cortical bone o f a 7-day control rat. Relative bone volume is" normal at 22 %, the structure model index is" 2.2 corresponding to a mixed plate- like rod-like structure, cortical thickness is" 0.280 mm
small V O i s are analysed, then a gradual rise (the control rat still has dense spongiosa up to the axial position while the suspended rat already has ' h o l e s ' ) and a flat m a x i m u m arotmd an axial length o f VOI o f 180 slices, before the curve falls again as control rat's spongiosa 'peters out'. The complete series o f rats was then evaluated using 180 slices. ' E x p l o d e d ' views o f the chosen trabecular and cortical VOI o f the 7-day control and 23-day suspended rat are shown in Figs 4 and 5, with the spongiosa artificially lifted out o f the cortex for illustration purposes.
in Table 1 the group averages with standard deviations (SD) are given for all the indices. The relative day-matched differ- ences are given in Table 2 (no p - v a l u e s given for such small group sizes o f only three).
Clearly visible is the progression o f t r a b e c u l a r bone loss with prolonged tail suspension: while the relative difference o f B V / T V is - 1 6 % in the 7-day suspended group as against the 7-day control group, it is already - 2 3 % lower after 13 days, and - 5 0 % lower after 23 days. B S / B V shows an increase o f + 1 4 % , then + 1 8 % and + 1 0 % after 23 days.
Cancellous bone structure is usually analysed using proce- dures originally developed for 2D histomorphometry, where
Fig. 5 Same as Fig. 4 f o r a 2 3 - d a y suspended rat. B V / T V is 9%, S M I 2.93 (cylindrical rods), C.Th 0.267mm
Table 1 Mean vahws and standard deviations (SD) o f the structural indices at day 7, 13 and 23, f o r tail suspended rats and control rats
Group
Structural index Day 7 Day 7 Day 13 Day 13 Day 23 Day 23
Control Suspended Control Suspended Control Suspended
Mean ± SD Mean ± SD Mean ± SD Mean ± SD Mean ± SD Mean ± SD
BV/TV [1] 0.19 ± 0.04 0.16 ± 0.04 0.22 ± 0.02 0.17 ± 0.02 0.18 ± 0.02 0.09 ± 0.01 BS/BV, mm 1 24.4± 1.7 27.7± 1.9 22.8±0.6 27.0± 1.7 24.8± 1.6 27.2±3.1 Tb.N*, mm 1 2.45±0.40 2.86±0.86 2.68±0.19 2.86±0.09 2.01±0.09 1.51±0.39 Tb.Th*, I.tm 8 3 ± 5 7 7 ± 3 8 8 ± 3 7 9 ± 4 8 1 ± 1 7 2 ± 6 Tb.Sp*, I.tmj 438 ± 77 383 ± 136 388 ± 28 352 ± 13 507 ± 31 725 ± 222 SMI [ 1 ] 2.22 ± 0.23 2.61 ± 0.16 2.08 ± 0.11 2.57 ± 0.25 2.25 ± 0.29 2.96 ± 0.08 DA [ 1 ] 1.96 ± 0.07 2.02 ± 0.16 1.96 ± 0.04 1.88 ± 0.03 1.99 ± 0.04 2.03 ± 0.18 Conn.D., mm 3 44.0±6.7 38.2± 11.5 43.6±3.2 39.0±0.8 42.2±6.7 19.0±2.1 C.Th, btm 3 1 9 ± 3 6 286± 16 3 5 5 ± 5 2 8 4 ± 5 4 3 3 5 ± 3 8 276± 19
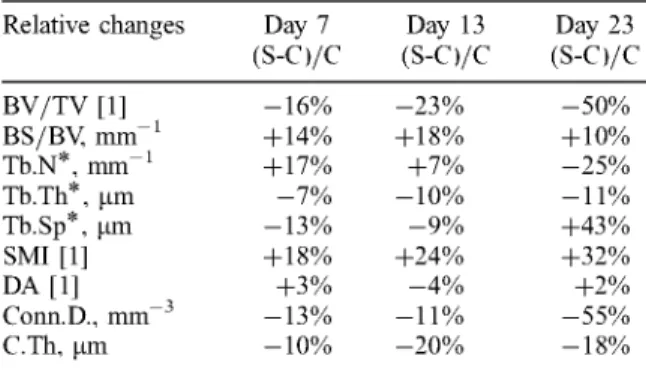
Table 2 Mean differences o f the structural indices after 7, 13 and 23 days o f suspended rats (S) and control tats" (C) relative to mean values o f conttvl gtvups.
Relative changes Day 7 Day 13 Day 23
( s - c ) / c ( s - c ) / c ( s - c ) / c BV/TV [1] -16% -23% -50% BS/BV, mm t +14% +18% +10% Tb.N*, m m t +17% +7% -25% Tb.Th*, #m - 7 % -10% -11% Tb.Sp*, #m -13% - 9 % +43% SMI [1] +18% +24% +32% DA [1] +3% - 4 % +2% Conn.D., mm 3 -13% -11% -55% C.Th, ixm -10% -20% -18%
BV/TV; bone volume to total volume. BS/BV; bone surface to bone volume.
Tb N*, Tb Th*, Tb.Sp*; trab. number, thickness, separation (direct method).
SMI; structure model index (0 plate, 3 rod). DA; degree of axfisotropy.
Conn.D; connectivity density.
C.Th; cortical thickness (direct method).
extensions to 3D require model assumptions. In addition to the direct evaluation techniques described in Section 2.4 we analysed our MicroCT examinations using standard classical procedures, assuming a plate model (PARFITT et al., 1983). The relative differences between tail suspended rats and control rats obtained with these model-dependent procedures are - 1 1 % , - 1 4 % and - 8 % for Tb.Th, and - 3 % , - 9 % and - 4 6 % for Tb.N for the 7-, 13-, and 23-day measurements. These results suggest that tail suspension causes thinning of trabeculae and a continuous decrease in their number, as also reported in the literature (LI et al., 1990; MAEDA et al., 1993). This inter- pretation is not supported by the direct 3D indices given in Table 2. The Structure Model index, SMI (Fig. 6), shows a change from 2.0 to 2.96 (3 being an ideal rod-like structure) with relative differences of + 18 %, +24 % and +32 % at day 7, 13 and 23. Hence a mixed plate-rod structure is transformed into a pure rod-like structure. Tb.N* increases first (day 7) due to fenestration of plates, the number of elements increases, then (day 13) the formation of rods from plates and the elimination of rods are more or less equal, then (day 23) Tb.N* decreases due to the elimination of rods. A refinement of this view is given by Conn.D., which remains relatively stable at first, but
3.00 2.80 2.60 =~ 2.40 O9 2.20 2.00 1.80 Fig. 6 ZX A A ZX •
•
t
I 7 13 23 daysIndividual SMIs. 0 for perfect plates', 3 for perfect rods. The trend towards rod-like trabeculae is" cleattv seen with pro- longed tail suspension. • control: /~ suspended
later on shows a sharp drop ( - 5 5 % after 23 days of tail suspension).
The cortex shows a decline o f - 10 %, - 2 0 % and - 1 8 % in its thickness after 7, 13 and 23 days. it seems that trabecular and cortical bone loss become uncoupled as the time of tail suspension increases, when the 50 % trabecular bone loss is compared to the 18 % cortical bone loss.
4 Discussion
In the work presented, rats with the hind limb unloaded were examined using MicroCT measurements. The proximal tibiae of male Wistar rats were imaged in three dimensions and a maximum trabecular volume of interest was chosen in the secondary spongiosa with conforming contours and mask-off of the cortex, which in turn was evaluated separately. The 3D CT images were processed with different morphometric evaluation techniques. Traditional methods, which assume a plate model for trabecular bone, and recently introduced direct methods, which assess bone independently of a model assump- tion, and a method which quantifies the structure type of the measured bone were applied. Artificially created boundaries were suppressed and accounted for in the evaluation steps. The cortex was assessed for its thickness with direct methods.
The trabecular VOI consisted of the complete secondary spongiosa of the proximal metaphysis of the tibia, which was determined with only two minor user interactions: the rough starting contour for automatic contour finding, and an indica- tion of the anatomical landmark to determine the axial position. With the proposed conforming methods, the axial dimension can be freely chosen, in contrast to cubic or spherical VOis where the axial dimension is coupled to the other two transverse dimensions. When compared to box-shaped VOis or spherical VOis that have to fit inside the trabecular region, a much larger volume is evaluated with our conforming method (roughly four to eight times larger, ~ 4 7 m m 3 conforming;
12mm 3 cubic or ~ 6 m m 3 spherical) and the considerable variability of results brought about by placing a VOI by hand is avoided.
The conforming VOI has an additional potential: it allows one to analyse regional differences. Using peeling operations it is possible to evaluate the core of the trabecular region where bigger changes might be expected; or, alternatively, changes in the ring-shaped region closest to the cortex might be of interest. This separation requires no additional user interactions since it is based on automatic contouring, and thus additional informa- tion about the homogeneity of bone is available 'free of charge'. (Data for different VOis not shown here, since the small group size prevents meaningful statistics and discussion of differential VOis.)
MicroCT is a very efficient tool to detect bone loss in immobilisation osteoporosis. However, the plate model assumption used in standard evaluation gives strong bias of the structural indices when the model assumption is increas- ingly violated by rodification of bone. This trend of conversion from plates to broad oval rods to cylindrical rods was quantified on this set of rat bones using the SMI. While the standard plate model assuming indices Tb.Th and Tb.N both show a gradual decline with prolonged hind limb unloading (which agrees with results from conventional 2D histomorpho- metry (LI et al., 1990), which also assumes a plate model for bone), this is not the case with the direct, model-assumption- free indices: bone loss is primarily caused by the thinning of trabeculae and not by a decrease in the number. Only after 23 days of unloading does Tb.N* drop. This is also reflected in the connectivity density, which shows, after 23 days, a pronounced decline of 55 %.
The n u m b e r o f rats per group was very small in our study and restricts extensive statistical analysis. Nevertheless, the additional information gained with new morphometric techni- ques is illustrated, it is worth noting that direct Tb.N* and Conn.D. are related to each other. However, there is an important difference: Tb.N* is a real metric index, namely the inverse o f the mean distance between the midlines of trabeculae, and is determined b y the diameter o f the largest sphere fitting inside them. Conn.D. relates to the n u m b e r of connections found in the VOI irrespective of their distance from each other, it is thus possible that, for example, the disappearance o f a horizontal rod has no effect on Tb.N* because the distance spheres are bounded b y vertical rods at that place, but Conn.D., on the other hand, is reduced.
The advance in three-dimensional imaging techniques allows study the organisation of trabecular and cortical archi- tecture in great detail. Novel methods give valuable n e w insight into the remodelling processes involved in osteoporosis. The considerable individual differences found within the groups underline the importance o f in vivo 3D MicroCT (KOHLBRENNER eta[., 1999), where each animal serves as its own control and changes in the microstructure can be followed directly in the same animal. The full potential of the proposed evaluation techniques will be realized when these n e w tools are available.
Acknowledgments--This work was supported in part by grmat 31-
45811.95 from the Swiss National Science Foundation and European Space Agency ESA (ESTEC grmat 12291 ).
References
BIRKENHA, GER-FRENKEL, D. H., COUPRON, P., HUPSCHER, E. A., CLERMONTS, E., COUTINHO, M. E, SCHMITZ, P. I. M., mad MEU- NIER, P. J. (1988): 'Age-related chmages in cmacellous bone struc- ture, a two-dimensional study in the transiliac iliac crest biopsy sites', Bone Min., 4, pp. 197-216
BONSE, U., BUSCH, E, GfJ2',!NEWIG, O., BECKMANN, E, PAHL, R., DELEING, G., HAHN, M., mad GRAEFF, W. (1994): '3D computed X- ray tomography of human cancellous bone at 8 Ixm spatial and 10 4 energy resolution,' Bone Min., 25, pp. 25-38
FEEDKAMR L. A., GOEDSTEIN, S. A., PARFITT, A. M., JESION, G., and KEEEREKOPER, M. (1989 ): 'The direct examination of three-dimen- sional bone axchitecmre in vitro by computed tomography', J. Bone
Min. Res., 4, pp. 3-11
GOUEET, R. W., GOEDSTEIN, S. A., CIAREEEI, M. J., KUHN, J. L., BROWN, M. B., mad FEEDKAMP, L.A. (1994): 'The relationship between the structural and orthogonal compressive properties of trabeculax bone', J. Biomech., 27, pp. 375-389
HARRIGAN, T. P., and MANN, R. W. (1984): 'Characterization of microstrucmral aaaisotropy in orthotropic materials using a second rank tensor', J Mater Sci., 19, pp. 761-767
HILDEBRAND, T., and RiJGSEGGER, R (1997a): 'A new method for the model independent assessment of thickness in three-dimensional images', J Microsc., 185, pp. 67-75
HILDEBRAND, T., and R1JGSEGGER, P. (1997b): 'Quantification of bone microaxchitecmre with the structure model index', Comput. Meth.
Biomech. Biomed. Eng., 1, pp. 15-23
HILDEBRAND, T., LAIB, A., ULRICH, D., KOHLBRENNER, A., and R1JGSEGGER, P. (1997c): 'Bone structure as revealed by microtomo- graphy', Proc. SPIE, 3149, pp. 34-43
HILDEBRAND, T., LAIB, A., MULLER, R., DEQUEKER, J., and R1JGSEG- GER, R (1999): 'Direct 3D morphometric maalysis of humma cancellous bone: microstrucmral data from spine, femur, iliac crest mad calcmaeus', J. Bone Miner Res., 14, 1167-1174 HIPP, J. A., JANSUJWICZ, A., SIMMONS, C. A., mad SNYDER, B. (1996):
'Trabecular bone morphology from micro-magnetic resonance ima- ging', J. Bone. Minel: Res., 11, pp. 286-297
KAPADIA, R. D., STROUR G. B., BADGER, A. M., KOLLER, B., LEVIN, J. M., COATNEY, R. W., DODDS, R. A., LIANG, X., LARK, M. W., and
GOWEN, M. (1998): 'Applications ofmicro-CT and MR microscopy to study pre-clinical models of osteoporosis mad osteoaxthritis',
Teclmol. Health Care, 6, pp. 361-372
KLEEREKOPER, M., VILLANUEVA, A. R., STANCIU, J., RAO, D. S., mad PARFITT, A. M. (1985): 'The role of three-dimensional trabeculax microstrucmre in the pathogenesis of vertebral compression frac- tures', Calcif Tissue Int., 37, pp. 594-597
KINNEY, J. H., and NICHOLS, M. C. (1992): 'X-ray tomographic microscopy (XTM) using synchrotron radiation', Annu. Rm:
Mater Sci., 22, pp. 121-152
KINNEY, J. H., RYABY, J. T., HAUPT, D. L., mad LANE, N. E. (1998): 'Three-dimensional in vivo morphometry of trabeculax bone in the OVX rat model of osteoporosis', Technol. Health Care, 6, pp. 339- 350
KOHLBRENNER, A., HAMMERLE, S., LAIB, A., KOLLER, B., mad ROGSEGGER, R (1999): 'Fast 3D multiple faaa-beaxn CT systems',
Proc. SPiE, 3772, pp. 44-54
LI, X. J., JEE, W. S. S., CHOW, S-Y., mad WOODBURY, D. M. (1990): 'Adaptation of cancellous bone to aging and immobilization in the rat: a single photon absorptiometry and histomorphometry study',
Anat. Rec., 227, pp. 12-24
LORENSEN, W. E., mad CEINE, H. E. (1987): 'Marching Cubes: A high resolution 3D surface construction algorithm', Comput. Graphics, 21, pp. 163-169
MAEDA, H., KIMMEL, D. B., RAAB, D. M., mad LANE, N. E. (1993): 'Musculoskeletal recovery following hindlimb immobilization in adult female rats/, Bone, 14, pp. 153-159
MAJUMDAR, S., NEWITT, D., MATHUR, A., OSMAN, D., GIES, A., CHIU, E., LOTZ, J., KINNEY, J., mad GENANT, H. (1996): 'Magnetic resonance imaging of trabeculax bone structure in the distal radius: relationship with x-ray tomographic microscopy and biome- chaaaics', Osteoporosis Int., 6, pp. 376 385
MOREY, E. R. (1979): 'Spaceflight and bone remover correlation with a new model of weightlessness', Bio. Sci., 29, pp. 168-172 MOSEKILDE, L. (1995): 'Asessing bone quality - animal models in
preclinical osteoporosis research', Bone, 17, pp. 345S 352S MErNCH, B. (1991): '3D-Analyse yon Knietomograxnmen'. Diss. ETH
Zuerich Nr. 9459
ODGAARD, A., mad GUNDERSEN, H. J. G. (1993): 'Quantification of connectivity in cmacellous bone, with special emphasis on 3D reconstructions', Bone, 14, pp. 173-182
ODGAARD, A. (1997): 'Three-dimensional methods for quantification of cmacellous bone architecture', Bone, 20, pp. 315-328
PARFITT, A. M., MATHEWS, C. H. E., VILLANUEVA, A. e., KLEER- EKOPER, M., FRAME, B., mad RAO, D. S. (1983): 'Relationships between surface, volume, and thickness of iliac trabecular bone in aging and in osteoporosis', Ca#'if Tissue Int., 72, pp. 1396-1409 PARFITT, A. M. (1992): 'Implications of architecture for the pathogen-
esis and prevention of vertebral fracture', Bone, 13, pp. $41- $47
PEYRIN, E, SALOME, M., CLOETENS, A. M., LAVAL-JEANTET, A. M., RITMAN, E., and RiJGSEGGER, R (1998): 'Micro-CT examinations of trabeculax bone samples at different resolutions: 14, 7 and 2 micron level', Technol. Health Care., 6, pp. 391-401
RIGGS, B. L., HODGSON, S. F., O'FALLON, W. M., CHAO, E. Y., WAHNER, H. W., MUHS, J. M., CEDEL, S. L., mad MELTON, J. M. (1990): 'Effect of fluoride treatment on the fracture rate in post- menopausal women with osteoporosis', New Engl. J. Med., 332, pp. 802-809
Rt~GSEGGER, R (1996a): 'Bone density measurement' in Br611, H., and Daxnbacher, M. A., (Eds): 'Osteoporosis: A guide to diagnosis and treatment. Rheumatology'. Basel, Kaxger, 18, pp. 103-116 Rt~GSEGGER, E, KOEEER, B., mad MiJEEER, R. (1996b): 'A micro-
tomographic system for the non-destructive evaluation of bone axchitecmre', Calcif Tissue int., 58, pp. 24-29
SIMMONS, C. A. and HIPE J. A. (1997): 'Method-based differences in the automated analysis of the three-dimensional morphology of trabeculax bone', J Bone Miner Res., 12, pp. 942-947
SNYDER, B. D., PIAZZA, S., EDWARDS, W. T., mad HAYES, W. C. (1993): 'Role of trabeculax morphology in the etiology of age- related vertebral fractures', Calcif Tissue int., 53, pp. S14-$22 TURNER, C. H., RHO, J. Y., ASHMAN, R. B., mad CowiN, S. C. (1988):
'The dependence of elastic constants of cancellous bone upon structural density mad fabric', Trans. Orthopaed. Res. Soc., 13, pp. 74
ULRICH, D., VAN RIETBERGEN, B., LAIB, A., and R1JGSEGGER, P. (1999): 'The ability of 3D structural indices to reflect mechanical aspects of trabeculax bone', Bolw., 25, pp. 55-60
VAN RIETBERGEN, B., MAJUMDAR, S., PISTOIA, W., NEWITT, D. C., KOTHARI, M., LAIB, A., and R1JGSEGGER, P. (1998 ): 'Assessment of cancellous bone mechanical properties from micro-FE models based on micro-CT, pQCT and MR images', Techllol. Health
Care., 6, pp. 413-420
WHITEHOUSE, W.J. (1974): 'The quantitative morphology of axliso- tropic trabecular bone', J. Microsc., 101, pp. 153-168
Author's biography
ANDRES LAIB received his MSc degree in experi- mental physics in 1994 and his PhD degree in physics in 1999 from the ETH Ziirich, Switzer- land on the subject of high-resolution PQCT of the human forearm. He currently holds a post-docto- rate position at the Magnetic Resonance Science Center at the University of California in San Francisco. His main research interests axe in bone structure analysis, computed tomography and magnetic resonance imaging.