OBSTETRICS
Can remifentanil use in obstetrics be improved by optimal
patient-controlled analgesia bolus timing?
B. Rehberg
1*, N. Wickboldt
1,2, C. Juillet
3and G. Savoldelli
11Service d’Anesthe´siologie, Hoˆpitaux Universitaires de Gene`ve et Faculte´ de me´decine, Universite´ de Gene`ve, Rue Gabrielle-Perret-Gentil 4, CH-1211 Gene`ve 14, Switzerland
2Department of Adult Intensive Care Medicine at Royal London Hospital, Barts Health NHS Trust, Whitechapel Road, London E1 1BB, UK 3De´partement de me´decine et des urgences, Hoˆpital neuchaˆtelois, Neuchaˆtel, Switzerland
* Corresponding author. E-mail: [email protected]
Editor’s key points
† Patient-controlled remifentanil boluses may have a role in the management of labour pain.
† Ideally, peak levels of remifentanil should coincide with maximum uterine contractions. † This study used
quantifying contraction strength to improve modelling of remifentanil concentrations.
† It was not possible to coordinate peak remifentanil concentrations with contraction strength. † Safe use of remifentanil
boluses in obstetric pain management will still require careful clinical monitoring.
Background.The safety of patient-controlled i.v. analgesia (PCA) with remifentanil for obstetrical analgesia remains a matter of concern. The efficacy of remifentanil bolus application, that is, the coincidence between pain and remifentanil effect-site concentration, may be improved by forecasting contractions, but it is not known whether such a technique would also improve safety.
Methods. We recorded pain intensity during labour continuously using a handheld dynamometer in 43 parturients. Using these data, we compared different models in their ability to predict future contractions. In addition, we modelled remifentanil effect-site concentration using three simulated modes of bolus administration, with and without prediction of future contractions.
Results.The average duration of pain during contractions recorded by the dynamometer was
45 [14 standard deviation (SD)] s. The time interval between painful contractions was highly
variable, with a mean of 151 (31SD) s during the first and 154 (52SD) s during the second
recording. Using a simple algorithm (three-point moving average), theSDof the difference
between predicted and observed inter-contraction intervals can be reduced from 0.95 to 0.79 min. However, the coincidence between remifentanil concentration and pain during contraction is not substantially improved when using these models to guide remifentanil bolus application.
Conclusions. Because of the large variability of inter-contraction intervals, the use of prediction models will not influence the mean remifentanil concentration in-between contractions. Using models predicting future contractions to improve the timing of remifentanil PCA bolus administration will not diminish the need of continuous clinical surveillance and other safety measures.
Keywords: analgesia, obstetrical; analgesia, patient-controlled; forecasting; pharmacokinetics; remifentanil; safety
Accepted for publication: 18 August 2014
The use of remifentanil for analgesia during labour has
become increasingly popular in recent years.1–3However, as
documented by several case reports,4–7serious side-effects
do exist, and therefore, studies looking at the optimization of the efficacy and safety of remifentanil patient-controlled analgesia (PCA) during labour are needed.
In theory, the efficacy of remifentanil application during labour will be determined by the effect-site concentration of remifentanil reached during a contraction. An optimal effect would be achieved if the remifentanil concentration is suffi-ciently high to be effectively analgesic during the total duration
of pain during a contraction. On the contrary, the safety of remi-fentanil use during labour will be theoretically determined by the remifentanil effect-site concentration in-between two painful contractions, inducing respiratory depression. Thus, an optimal remifentanil application during labour would achieve high (‘effective’) remifentanil concentrations during each painful contraction and low (‘safe’) concentrations in between painful contractions.
With standard PCA systems, a bolus is demanded by the par-turient at the beginning of the pain felt with a contraction. This way, peak remifentanil concentration will not be optimally &The Author 2014. Published by Oxford University Press on behalf of the British Journal of Anaesthesia. All rights reserved.
timed. At the beginning of the painful contraction, remifentanil concentration is still insufficient to alleviate the pain, whereas it will be still high after the end of the pain, inducing respiratory depression. Several attempts have already been made to improve the use of remifentanil during labour by modifying
the bolus application8 9or forecasting future contractions.10
The latter solution appears to be promising, since a remifenta-nil bolus may be delivered just before the beginning of a
con-traction, allowing peak remifentanil concentration to
coincide with peak pain during the contraction.
To our knowledge, no study has until now attempted to compare the timing of pain during contractions and the remi-fentanil concentrations achieved with either standard bolus application at the beginning of the pain sensation or with opti-mized bolus delivery by prediction before the start of a contrac-tion. Such a comparison would allow a better understanding of efficacy and safety of remifentanil use during labour.
Our study included an experimental part (clinical observa-tion in the labour ward) and a mathematical modelling part. The study had three objectives. First, we aimed to record the timing and duration of pain during contractions using a new approach consisting of handgrip force measured by a handheld dynamometer (first part). In the second part of the study, we used these data to simulate time series of (painful) contrac-tions and also remifentanil concentracontrac-tions achieved with either standard bolus application at the beginning of the pain sensation or with optimized bolus delivery by prediction of the contractions. The objective of optimization is to find an optimum coincidence of remifentanil concentration and the intensity of pain during uterine contractions.
Finally, different models of prediction of future contractions were compared and the most parsimonious chosen for further evaluation of efficacy and safety of a hypothetical optimized remifentanil PCA application system during labour.
Methods
After institutional review board approval (Commission centrale d’e´thique de la recherche sur l’eˆtre humain des HUG 12-077) and written informed consent, 43 parturients were included in the study. Parturients received information about the study on arrival in the delivery suite.
Experimental part of the study
After informed consent, the handling of the dynamometer was explained and reference values for handgrip force correspond-ing to subjective pain levels of moderate pain (5 on a scale of 0–10) and extreme pain (10 on a scale of 0–10) were obtained. The dynamometer (Noraxon Biofeedback dynamometer, Velamed, Cologne, Germany) was connected via an analogue– digital interface to a portable computer. Handgrip force measured by the dynamometer was recorded continuously using Signal software (CED, Cambridge, UK) during periods of 20 min each. Women were instructed to compress the dyna-mometer with a force corresponding to their subjective pain level and hold it until the pain has subsided. In parallel, the ex-ternal tocographic signal of uterine contractions and an ab-dominal wall electromyogram were recorded.
The first recording (20 min) of frequency and intensity of contractions was taken during the first stage of labour when women experienced regular painful contractions, not yet re-quiring analgesia except for physical relaxation techniques provided by the midwife.
A second recording of 20 min duration was obtained during more advanced labour at the time when women demanded epidural analgesia, but before epidural placement. There was no minimal cervical dilation for epidural analgesia and there-fore, the time during labour for the second recording was variable, from early to late first stage of labour.
Analysis
The duration of the pain during contractions was measured as the time for which the dynamometer signal deviated from baseline, indicating pain. The interval between painful contrac-tions was measured as the time between two starting points of the deviation from baseline on the dynamometer signal. These durations and intervals were compared with those recorded by external tocography.
Mathematical modelling
Modelling of contraction time series
Time series of duration and intervals of painful contractions obtained from the dynamometer signal were further analysed
using the R statistical software.11 Let d
i be the contraction
interval between contraction i–1 and i and knowing the first contraction interval, we are trying to forecast with an horizon of 1 the next contraction interval:
di+1= V(d0,. . . , di)
The simplest way to forecast the next interval is to use the previous one (‘naı¨ve’ forecasting):
di+1= di.
Another simple way of forecasting is to use a moving average of the last n contraction intervals. Here, we used n¼2 –4, because sample calculations with higher n did not improve forecasting. More elaborate forecasting methods are exponential smoothing (ETS) and the autoregressive integrated moving average (ARIMA), both available as functions of the R forecast
package.11 The functions were used to provide automatic
adaptation of all parameters and choice of an optimized model based on maximum likelihood estimation and Akaike’s
information criterion.12 For each new contraction, a new
optimal model was computed with both ETS and ARIMA and then used to forecast the next contraction interval.
To obtain longer time series to test the different prediction models, inter-contraction time interval data of at least 100 min duration derived from external tocography monitoring from an additional 25 parturients were used.
Modelling of remifentanil concentration
Remifentanil effect-site concentrations were modelled using STANPUMP (Steven Shafer, Stanford, available at www.
opentci.org) and the model published by Minto and
collea-gues.13Simulations are based on a typical patient, 25 yr old,
with a height of 165 cm, and a weight of 70 kg. Bolus dose
was 35 mg (0.5 mg kg21), and the bolus was assumed to be
delivered within 10 s. Bolus doses vary widely in the literature, the dose chosen was the mean dose of the studies included in
the systematic review of Schnabel and colleagues.3
The average effect-site concentration of remifentanil during contractions was used as an estimate of PCA efficacy, and the average effect-site concentration in the inter-contraction interval was used as an estimate of PCA safety.
Comparison of the models predicting contractions
For each labour data set, we computed the prediction error
defined as the difference xibetween the exact delay between
two consecutive contractions and the predicted counterpart using a method M. For every forecasting method used, the error is normally distributed with mean E(x)¼0. We were inter-ested to find the method M which would give the smallest
standard deviation (SD) of the prediction error, meaning that
on average, the prediction by M is the most accurate. Since
XMis normally distributed over zero with variance sM, we use
a Bartlett’s test to verify homoscedasticity for the different forecasting methods. For the Bartlett’s test, the null hypothesis is that there is no difference in prediction variance whatever the forecasting method is, thus a significant P-value indicates that there are at least two variances that are significantly different.
Results
The 43 participating women had an average age of 32 (4SD) yr,
weighed on average 75 (11SD) kg, and had an average height of
164 (5SD) cm, resulting in an average BMI of 28 kg m22(4SD).
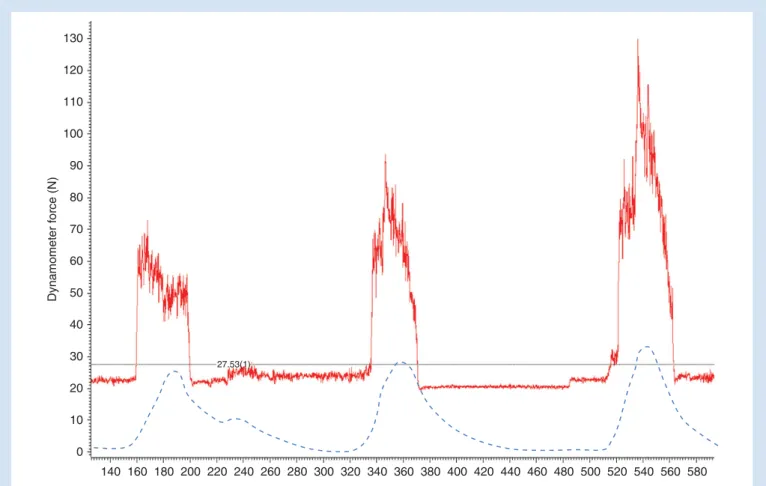
Two-thirds of the women were nulliparous, and one-third had induced labour. In two-thirds of the women, cervical dila-tation was still less than 20 mm when the second recording of pain during contractions was performed (at our institution, most women demand and receive epidural analgesia early during labour). An original tracing of the dynamometer is
shown in Figure 1. As reported elsewhere, hand grip force
recorded by the dynamometer was moderately correlated
with subjective pain intensity.14 Pain during contractions
recorded via the dynamometer corresponded well with those on the tocographic tracing and onset of pain coincides with
Dynamomet e r f o rc e (N) Time (s) 140 160 180 200 220 240 260 280 300 320 340 360 380 400 420 440 460 480 500 520 540 560 580 0 10 20 30 40 50 60 70 80 90 100 110 120 130 27.53(1)
Fig 1 Original tracings of the handheld dynamometer for an exemplary parturient (continuous line) in parallel with the external tocography recording (dashed line). Handgrip force is given in newtons and time in seconds. The baseline limit (dotted line) is determined by averaging baseline fluctuations of the dynamometer signal.
the onset of contractions. However, the duration of pain during the contractions was shorter than the duration of the rise in ab-dominal wall tension for most contractions. The average
dur-ation of pain during contractions recorded by the
dynamometer was 45 s both during the first and the second
recording, with anSDof 14 s.
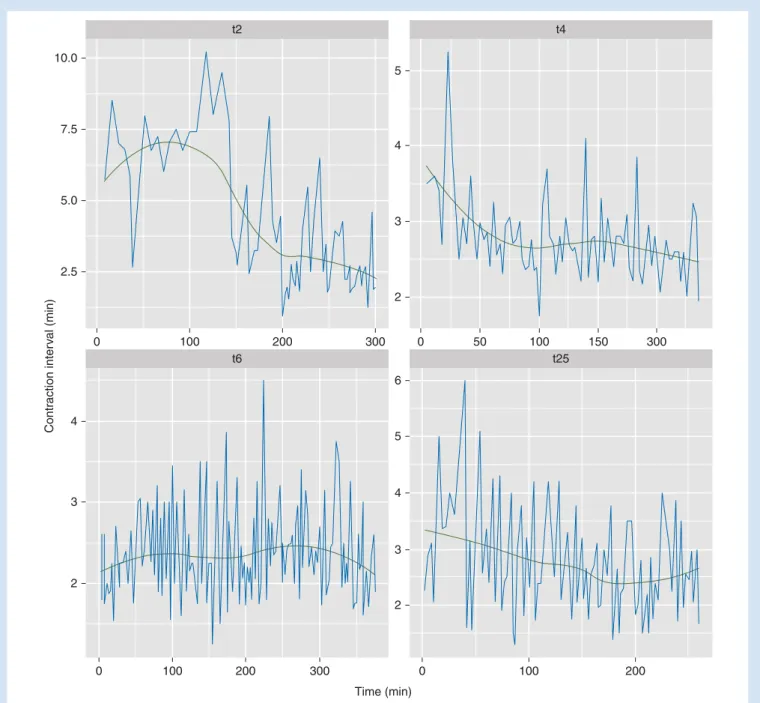
The time interval between painful contractions was highly
variable, with a mean of 151 (31SD) s during the first and 154
(52SD) s during the second recording. Examples of time series
data (four patients with the longest time series of more than 200 min) of the inter-contraction time interval are shown in
Figure2.
Using the time series of the inter-contraction time intervals, different models were tested in their ability to predict future contractions.
Prediction of future contractions by modelling
contraction time series
The ‘goodness of fit’ of the different models can be described by the differences between predicted values and actual values or
rather theSDof these differences, since the differences
them-selves will have a standard distribution with a mean of zero.
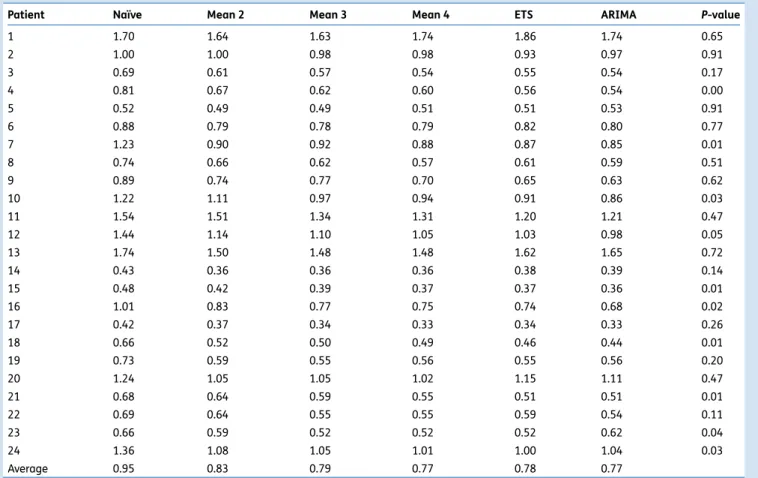
In Table 1, the SDs of these differences are shown for all
Contr action inter v al (min) Time (min) 10.0 7.5 5.0 2.5 0 100 200 300 t2 5 4 3 2 0 50 100 150 300 t4 4 3 2 0 100 200 300 t6 5 6 4 3 2 0 100 200 t25
Fig 2Time series data of the inter-contraction time interval from four patients (coded t2, t4, t6, t25) with uninterrupted time series of more than 200 min.
models and each of the 24 patients with long (.100 min) time series. For eight of the 24 cases, a Bartlett’s test for equal variances yielded a significant difference between
models (Table1). Differences between simple moving average
forecasting models (at least with means of≥3) and the more
elaborate ETS and ARIMA models are negligible.
A simple three-point moving average model was thus con-sidered a parsimonious compromise between forecasting effi-cacy and complexity (which coincides with computationally demanding calculation) and used for further calculations.
Modelling of remifentanil effect-site concentration
Using the average duration of pain during contractions and the inter-contraction intervals obtained by the dynamometer recordings, remifentanil effect-site concentration was mod-elled in relation to the timing of pain during the contractions. To simplify modelling, the duration of pain during contractions was modelled as fixed, using the mean duration obtained from the dynamometer recordings.
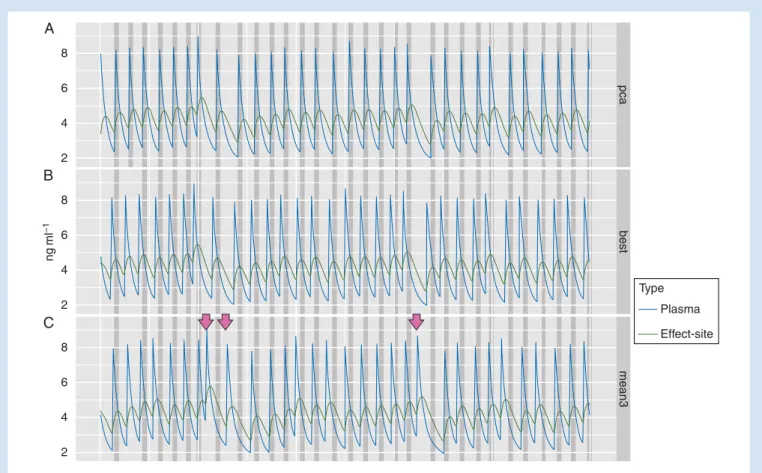
Figure3shows, for one patient, the remifentanil plasma
and effect-site concentrations when the remifentanil bolus is
administered at the beginning of the pain sensation (Fig.3A),
in an ideal situation where remifentanil concentration is
optimized to coincide with the pain sensation (Fig.3B), and
when automatically administered using a three-point moving
average prediction algorithm (Fig.3C). Although the prediction
algorithm improves correlation of pain duration and remifen-tanil effect-site concentration, sometimes the model predicts
a contraction which does not occur (arrows in Fig.3).
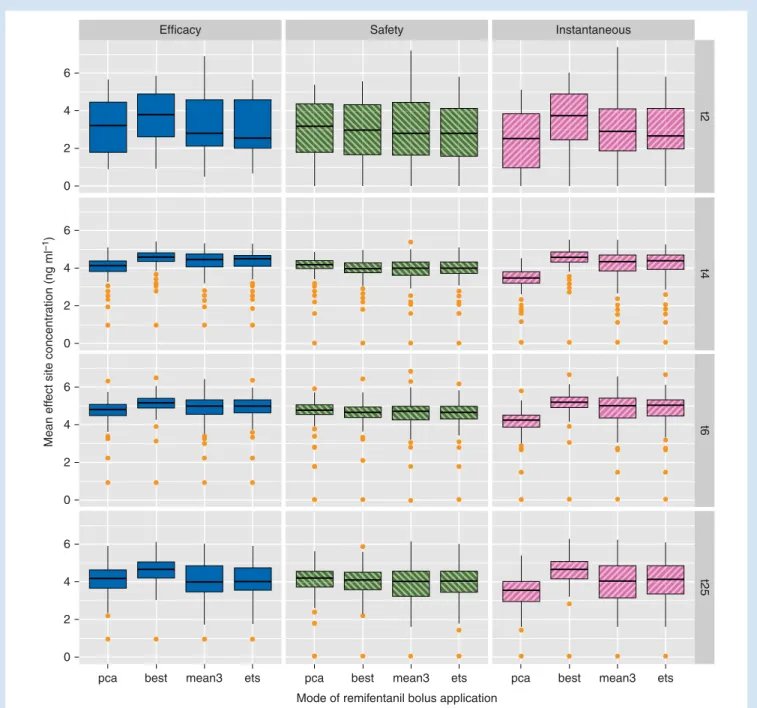
For most patients, the efficacy of a remifentanil PCA, mea-sured as the average remifentanil concentration during a contraction (and the ‘instantaneous’ concentration at the be-ginning of the pain sensation during contractions), can be improved when using an optimized timing by a simple
three-point moving average forecast of contractions (Fig.4).
The mean concentration of remifentanil in-between two con-tractions, however, which is a factor of the safety of a
remifenta-nil PCA, is less changed when bolus timing is optimized (Fig.4).
Discussion
The experimental part of this study provides data about the timing, duration, and spacing of pain during the first stage of labour, and about its regularity or rather irregularity. A study of a large cardiotocography database has found similar
values for the intervals in between contractions,15obviously
without giving information about pain duration and, more Table 1 SDs (in min) of the differences between observed and predicted inter-contraction intervals for all patients with long (.100 min) time series
and the different forecast models: naı¨ve, moving average (mean) of the last 2, 3, and 4 intervals, ETS, and autoregressive integrated moving average (ARIMA). P-values are given for Bartlett’s test to check for equal variances between different models (null hypothesis—no differences between the variances for all models)
Patient Naı¨ve Mean 2 Mean 3 Mean 4 ETS ARIMA P-value
1 1.70 1.64 1.63 1.74 1.86 1.74 0.65 2 1.00 1.00 0.98 0.98 0.93 0.97 0.91 3 0.69 0.61 0.57 0.54 0.55 0.54 0.17 4 0.81 0.67 0.62 0.60 0.56 0.54 0.00 5 0.52 0.49 0.49 0.51 0.51 0.53 0.91 6 0.88 0.79 0.78 0.79 0.82 0.80 0.77 7 1.23 0.90 0.92 0.88 0.87 0.85 0.01 8 0.74 0.66 0.62 0.57 0.61 0.59 0.51 9 0.89 0.74 0.77 0.70 0.65 0.63 0.62 10 1.22 1.11 0.97 0.94 0.91 0.86 0.03 11 1.54 1.51 1.34 1.31 1.20 1.21 0.47 12 1.44 1.14 1.10 1.05 1.03 0.98 0.05 13 1.74 1.50 1.48 1.48 1.62 1.65 0.72 14 0.43 0.36 0.36 0.36 0.38 0.39 0.14 15 0.48 0.42 0.39 0.37 0.37 0.36 0.01 16 1.01 0.83 0.77 0.75 0.74 0.68 0.02 17 0.42 0.37 0.34 0.33 0.34 0.33 0.26 18 0.66 0.52 0.50 0.49 0.46 0.44 0.01 19 0.73 0.59 0.55 0.56 0.55 0.56 0.20 20 1.24 1.05 1.05 1.02 1.15 1.11 0.47 21 0.68 0.64 0.59 0.55 0.51 0.51 0.01 22 0.69 0.64 0.55 0.55 0.59 0.54 0.11 23 0.66 0.59 0.52 0.52 0.52 0.62 0.04 24 1.36 1.08 1.05 1.01 1.00 1.04 0.03 Average 0.95 0.83 0.79 0.77 0.78 0.77
importantly, about the irregularity of individual time series of contractions.
In order to record the timing of pain during contractions, it is not sufficient to simply register uterine tone, since the
correl-ation between uterine tone and pain is highly variable.16In
addition, standard external tocography yields a highly unreli-able signal, and internal tocography is invasive and rarely avail-able. A signal given by the parturient herself may indicate the pain duration of a contraction more consistently. We had tested a system where parturients registered the pain during contractions by pressing a handheld dynamometer, since handgrip force has been shown to correlate with descriptors
of pain intensity.17 A preliminary analysis had shown that
pain onset coincided well with the onset of contractions, but that pain duration was often shorter than the duration of con-tractions on the tocographic recording. Therefore, we used the dynamometer data to calculate the mean duration of pain during contractions. To generate time series of contractions, however, which are calculated using the onset of contractions only, the tocographic data are sufficient.
The results gathered in the first part of the study allowed us to perform the mathematical modelling part. In this simula-tion, we were able to show that a simple algorithm can
indeed predict the occurrence of future contractions quite well, despite the observed irregularity.
Differences of simple moving average algorithms and the complex ETS and ARIMA models are small in terms of the ac-curacy of prediction. Both optimal ETS model and optimal ARIMA model will eventually yield, through iterative refine-ment of model parameters, the best forecasting model for a specific labour data set. Nevertheless, the process being itera-tive and needing several contraction intervals to bootstrap, it is possible to obtain, in certain cases, suboptimal results com-pared with more simple models.
Finally, if a three-point moving average forecast algorithm of contractions is used, the mean remifentanil concentration during a contraction, and especially at the beginning of a con-traction, can be increased for most patients. This in turn increases the efficacy of a remifentanil PCA. The average remi-fentanil concentration in between two contractions, however, is much less dependent on the timing of a bolus, and will be only slightly lower when a remifentanil bolus is applied before a (predicted) contraction. When considering this a factor of the safety of a remifentanil PCA, even optimal bolus application will not much improve safety. The finding from our experimental data that pain during contractions is
ng ml –1 8 6 4 2 8 6 4 2 8 6 4 2 mean3 best pca Type Plasma Effect-site A B C
Fig 3 Modelled remifentanil plasma and effect-site concentration during a series of contractions of an exemplary patient. Painful contractions are indicated by dark grey bars. Different modes of bolus application are compared: (A, upper set of traces) the remifentanil bolus is administered at the
beginning of the pain sensation (traditional PCA setting); (B, second set of traces) in an ideal situation where remifentanil effect-site concentration is optimized to coincide with the pain sensation; (C, third set of traces) automatic bolus application with prediction of the time point by a moving average algorithm of the last three contraction intervals. The arrow marks contractions predicted by the model which do not occur in reality.
actually shorter than the duration of contractions estimated in previous studies using tocographic recordings puts further weight on the importance of inter-contraction remifentanil concentration.
Our study is certainly limited by the fact that we only simu-lated remifentanil bolus application and modelled remifentanil concentrations using the pharmacokinetic
–pharmacody-namic model of Minto and colleagues.13 Since remifentanil
pharmacokinetics are linear,18 simulation is a valid way to
predict clinical scenarios. The Minto model is not very depend-ent on age in the age range concerned by obstetrical analgesia. It is based on lean body mass and thus independent of weight gain during pregnancy. However, no pharmacokinetic – pharmacodynamic studies exist for pregnant patients. In add-ition, peak respiratory depression may arrive even later than the peak remifentanil effect estimated by the model used. Whereas the peak analgesic effect may coincide with the
peak effect predicted by the Minto model,19peak respiratory
Safety Instantaneous 6 4 2 0 t2 t4 t6 6 4 2 0 6 4 2 0 6 4 2 0 Efficacy
pca best mean3 ets pca best mean3 ets pca best mean3 ets Mode of remifentanil bolus application
Mean eff
ect site concentr
ation (ng ml
–1
)
t25
Fig 4 Comparison of the different modes of remifentanil bolus application (PCA, bolus is administered at the beginning of a contraction; BEST, bolus is administered at the ideal time point to maximize efficacy; MEAN3, bolus is administered at the time point predicted by a three-point moving average model; ETS, bolus is administered at the time point predicted by an ETS model) in terms of efficacy, safety, and effect-site concentration at the beginning of pain during a contraction (‘instantaneous’). Shown are simulated mean effect-site concentrations for the four exemplary patients with time series of more than 200 min. Box plots denote outliersmin ,Q1 21.5 IQR,Q1,Q2,Q3,Q3+1.5 IQR ,outliersmax with IQR¼Q32Q1.
depression has been found to occur about 2.5 min after a bolus,
and thus considerably later.20Unfortunately, no
pharmacoki-netic –pharmacodynamic exists for respiratory depression, and thus we were not able to simulate this important side-effect directly.
In addition, the safety of a remifentanil PCA—improved by prediction of future contraction and guided bolus application— will not only be determined by average concentrations, but also by those arriving at the outer limits of the probability dis-tributions. The irregularity of inter-contraction intervals observed in the experimental part of our study is large, and thus from time to time, a bolus will be applied at a time when no contraction will follow for several minutes (see examples
in Fig.3), potentially leading to respiratory depression.
Recently, several cases of respiratory, cardiac arrest, or both with the use of a remifentanil PCA during labour have been
reported,4–7and editorials have discussed the safety of this
al-ternative to epidural analgesia during labour.1 21Even if the
ef-ficacy of remifentanil PCA may be improved by optimized bolus application, our simulations suggest that this would only have a minimal impact on patient safety. Sedation is an important warning sign of opioid overdose, and thus, we suggest that optimized bolus application should never be used with auto-matic bolus application. Instead, a signal (‘green light’) could be given to the parturient, who will have to press the bolus button herself. With this approach, the parturient stays in total control of her analgesia, a factor known to influence
maternal satisfaction.22
However, remifentanil respiratory depression can occur very fast, and thus sedation is not a sufficient warning sign. One-to-one care by a midwife is recommended, and continu-ous presence of a caregiver appears to be vital. In at least two of the published case reports, the incident occurred during a short absence of the midwife, underlining the import-ance of a continuous presence of a caregiver.
It has also been suggested that remifentanil bolus
calcula-tion be based on lean body weight instead of actual weight.23
We have used actual weight for our simulations, since remi-fentanil clearance in pregnant women at term has been
found to be rather increased,24and actual dose should best
be titrated to effect to avoid under- and overdosing.
Mucha-tuta and Kinsella21recommended in their editorial a 3 min
lockout to avoid a second bolus being given before the maximum respiratory depression of a first bolus has been attained. Considering our finding that even in first-stage labour, the average interval between two contractions is ,3 min, a 3 min lockout will impede pain relief. Our results suggest that optimizing bolus application by prediction of future contraction may lead to a better overlap of pain and remifentanil effect and thus improve safety. However, this effect is small, and will not diminish the need of consequent surveillance without interruptions.
In summary, we have shown, based on time series of painful contractions during labour, that future contractions can be predicted by a simple algorithm with sufficient precision to improve the efficacy of remifentanil PCA during first-stage labour. However, safety will only be improved slightly by
optimized bolus application, and thus, the need for safety mea-sures will not be changed by this technique.
Authors’ contributions
B.R.: study design, patient recruitment, data analysis, remifen-tanil concentration modelling, and writing up of the first draft of the paper. N.W.: patient recruitment, data collection and analysis, and finalizing the manuscript. C.J.: data analysis, modelling of contractions, and finalizing the manuscript. G.S.: study organization and finalizing the manuscript.
Acknowledgement
We would like to thank all participating parturients and midwives for their support of the study.
Declaration of interest
None declared.Funding
This work was supported by the ‘Fonds de Service’ of the De-partment of Anesthesiology, Pharmacology and Intensive Care of the Hoˆpitaux Universitaires de Gene`ve.
References
1 Kranke P, Girard T, Lavand’homme P, et al. Must we press on until a young mother dies? Remifentanil patient controlled analgesia in labour may not be suited as a ‘poor man’s epidural’. BMC Pregnancy Childbirth 2013; 13: 139
2 Leong WL, Sng BL, Sia ATH. A comparison between remifentanil and meperidine for labor analgesia: a systematic review. Anesth Analg 2011; 113: 818– 25
3 Schnabel A, Hahn N, Broscheit J, et al. Remifentanil for labour anal-gesia: a meta-analysis of randomised controlled trials. Eur J Anaes-thesiol 2012; 29: 177– 85
4 Pruefer C, Bewlay A. Respiratory arrest with remifentanil patient-controlled analgesia—another case. Anaesthesia 2012; 67: 1044– 5
5 Bonner JC, McClymont W. Respiratory arrest in an obstetric patient using remifentanil patient-controlled analgesia. Anaesthesia 2012; 67: 538 –40
6 Marr R, Hyams J, Bythell V. Cardiac arrest in an obstetric patient using remifentanil patient-controlled analgesia. Anaesthesia 2013; 68: 283– 7
7 Kinney MAO, Rose CH, Traynor KD, et al. Emergency bedside cesar-ean delivery: lessons learned in teamwork and patient safety. BMC Res Notes 2012; 5: 412
8 Volmanen PVE, Akural EI, Raudaskoski T, et al. Timing of intravenous patient-controlled remifentanil bolus during early labour. Acta Anaesthesiol Scand 2011; 55: 486 –94
9 Jost A, Ban B, Kamenik M. Modified patient-controlled remifentanil bolus delivery regimen for labour pain. Anaesthesia 2013; 68: 245–52 10 Huang Z, Shyu M-L, Tien J, Vigoda MM, Birnbach D. Prediction of uterine contractions using knowledge-assisted sequential pattern analysis. IEEE Trans Biomed Eng 2013; 60: 1290– 7 11 R Development Core Team. R: A Language and Environment for
Statistical Computing. Vienna, Austria: R Foundation for Statistical Computing, 2008. Available from http://www.R-project.org
12 Hyndman R, Khandakar Y. Automatic time series forecasting: the forecast package for R. J Stat Softw 2008; 27: 1–29
13 Minto CF, Schnider TW, Egan TD, et al. Influence of age and gender on the pharmacokinetics and pharmacodynamics of remifentanil. I. Model development. Anesthesiology 1997; 86: 10–23
14 Wickboldt N, Savoldelli G, Rehberg-Klug B. Assessment of labour pain using hand grip force. ASA Annu Meet Abstr 2013; A1073
15 Oppenheimer LW, Bland ES, Dabrowski A, Holmes P, McDonald O, Wen SW. Uterine contraction pattern as a predictor of the mode of delivery. J Perinatol 2002; 22: 149 –53
16 Corli O, Grossi E, Roma G, Battagliarin G. Correlation between sub-jective labour pain and uterine contractions: a clinical study. Pain 1986; 26: 53–60
17 Gracely RH, McGrath F, Dubner R. Ratio scales of sensory and affect-ive verbal pain descriptors. Pain 1978; 5: 5–18
18 Egan TD, Lemmens HJ, Fiset P, et al. The pharmacokinetics of the new short-acting opioid remifentanil (GI87084B) in healthy adult male volunteers. Anesthesiology 1993; 79: 881– 92
19 Egan TD, Kern SE, Muir KT, White J. Remifentanil by bolus injec-tion: a safety, pharmacokinetic, pharmacodynamic, and age effect investigation in human volunteers. Br J Anaesth 2004; 92: 335 – 43
20 Babenco HD, Conard PF, Gross JB. The pharmacodynamic effect of a remifentanil bolus on ventilatory control. Anesthesiology 2000; 92: 393– 8
21 Muchatuta NA, Kinsella SM. Remifentanil for labour analgesia: time to draw breath? Anaesthesia 2013; 68: 231 –5
22 Hodnett ED. Pain and women’s satisfaction with the experience of childbirth: a systematic review. Am J Obstet Gynecol 2002; 186: S160–72
23 Tveit TO, Halvorsen A, Seiler S, Rosland JH. Efficacy and side effects of intravenous remifentanil patient-controlled analgesia used in a stepwise approach for labour: an observational study. Int J Obstet Anesth 2013; 22: 19–25
24 Kan RE, Hughes SC, Rosen MA, Kessin C, Preston PG, Lobo EP. Intra-venous remifentanil: placental transfer, maternal and neonatal effects. Anesthesiology 1998; 88: 1467–74