ORIGINAL PAPER
Estimating wild boar (
Sus scrofa) abundance and density using
capture
–resights in Canton of Geneva, Switzerland
C. Hebeisen&J. Fattebert&E. Baubet&C. Fischer
Received: 7 May 2007 / Revised: 29 October 2007 / Accepted: 29 October 2007 / Published online: 21 November 2007
# Springer-Verlag 2007
Abstract We estimated wild boar abundance and density using capture–resight methods in the western part of the Canton of Geneva (Switzerland) in the early summer from 2004 to 2006. Ear-tag numbers and transmitter frequencies enabled us to identify individuals during each of the count-ing sessions. We used resights generated by self-triggered camera traps as recaptures. Program Noremark provided Minta–Mangel and Bowden’s estimators to assess the size of the marked population. The minimum numbers of wild boars belonging to the unmarked population (juveniles and/ or piglets) were added to the respective estimates to assess total population size. Over the 3 years, both estimators showed a stable population with a slight diminishing tendency. We used mean home range size determined by telemetry to assess the sampled areas and densities. Mean wild boar population densities calculated were 10.6
indi-viduals/km2±0.8 standard deviation (SD) and 10.0 ind/km2± 0.6 SD with both estimators, respectively, and are among the highest reported from Western Europe. Because of the low proportion of marked animals and, to a lesser extent, of technical failures, our estimates showed poor precision, although they displayed similar population trends compared to the culling bag statistics. Reported densities were con-sistent with the ecological conditions of the study area. Keywords Noremark . Minta–Mangel . Bowden . Radio-tracking . Culling bag
Introduction
The population dynamics of a given species is known to be influenced by biological and ecological parameters (Coulson et al. 2001). Long-term data on density, age and sex structure, and ecological parameters enhance wildlife management (Clutton-Brock et al.2004), but managers still need simpler data to allow a quick decision-making process (Hauser et al. 2006). Thus, population size and density estimates are commonly used as a basic indicator in wildlife management and conservation (Seber 1982; Hauser et al. 2007; Morley and van Aarde 2007). Estimates that depend on indirect indices of presence can be used to minimize interactions with the animals. However, these indices must be directly proportional to population density to enable comparison in space and time (Nichols1992; Pollock et al. 2002), a condition rarely met in changing environmental conditions. Capture–mark–recapture (CMR) methods (Otis et al.1978; Seber1982; Pollock et al.1990; Nichols1992; Schwarz and Seber 1999; Pollock et al. 2002) are com-monly used to estimate population size, although the trapping itself may bias the estimate. The sample size can DOI 10.1007/s10344-007-0156-5
Communicated by W. Lutz
C. Hebeisen (*)
:
J. FattebertInstitut de Biologie, Laboratoire d’éco-éthologie,
Université de Neuchâtel,
Emile-Argand 11, Case postale 158, 2009 Neuchâtel, Switzerland e-mail: [email protected]
J. Fattebert
e-mail: [email protected] E. Baubet
Office National de la Chasse et de la Faune Sauvage, CNERA Cervidés-Sangliers,
Avenue de Wagram 85 bis, 75017 Paris, France
e-mail: [email protected] C. Fischer
Domaine Nature et Paysage, Rue des Battoirs 7, 1205 Geneva, Switzerland e-mail: [email protected]
be small if the trapping is not efficient, and probabilities of capture–recapture can vary among the population (Pollock et al.1990; Nichols1992; MacKenzie et al. 2005). To par-tially minimize the effects of trapping, the resight of an animal can be considered as its actual recapture (Minta and Mangel 1989; Nichols 1992; Bowden and Kufeld 1995; White 1996; Schwarz and Seber 1999). Capture–resight (CR) models either depend on direct reobservations [e.g., lion Panthera leo (Castley et al.2002), brown bear Ursus arctos and black bear U. amercianus (Miller et al.1997), coyote Canis latrans (Hein and Andelt1995), or elephant Loxodonta africana (Morley and van Aarde 2007)] or pictures taken by self-triggered camera traps [e.g., grizzly bear U. arctos horribilis (Mace et al.1994), lynx Lynx lynx (Zimmermann et al. 2005), jaguar P. onca (Silver et al. 2004), or tiger P. tigris (Karanth et al. 2004)]. Unambig-uous natural marks, such as fur patterns (Karanth 1995; Karanth and Nichols1998), are often used to identify the sighted animals and establish their capture history (Otis et al.1978). In such cases, artificial marking is unnecessary.
Wild boar (Sus scrofa L., 1758) are well known to be difficult to count at an absolute level because of their mainly nocturnal activity and preference for wooded habitats (Boitani et al. 1994; Russo et al. 1997; Fattebert 2005) that limits observation. Consequently, most wild boar population size or density estimates have used relative indices of abundance rather than direct observations or counts. Most depend on hunting or culling statistics (Waithmann et al.1999; Geisser and Reyer2005; Acevedo et al. 2006; Melis et al. 2006; Merli and Meriggi 2006), catch per unit effort (Boitani et al.1995b), or sampling of activity signs (Alpe1995; Okarma et al.1995; Massei et al. 1998). Few studies have used the statistical framework of CMR methods to estimate wild boar populations through live recapture (Andrzejewski and Jezierski 1978) or recoveries of hunted animals (Gabor et al. 1999). More recently, Fickel and Hohmann (2006) examined the use of genetics on hair and scat samples to identify wild boar. Only Sweitzer et al. (2000) used photographic resights of naturally marked wild pigs S. scrofa in California for CR analysis. However, individual recognition is not guaranteed in European free-ranging wild boar, which lack distinctive individual features. Considering this, animals have to be cap-tured and marked, and capture histories of unmarked indi-viduals will be missing. Consequently, estimators that only consider capture histories of marked animals should be used. Wild boar populations have dramatically increased across Europe during the last decades (Sàez-Royuela and Telleria 1986; Boitani et al. 1995a; Schley et al. 1998; Fonseca et al.2004; Klein et al. 2004; Geisser and Reyer 2005). As a consequence, crop damage is a growing prob-lem, bringing concerns with respect to the control of boar numbers. As similar problems arose in the Basin of
Geneva, a cross-border project started in 2002 (Fischer et al. 2004b; Fattebert 2005). The aim of the project was to capture, mark, and radio-track wild boar, so as to improve the knowledge about the ecology of the species and its management at a biogeographically relevant basin scale. As a part of this project, we aimed to determine population size and density in the western part of the Canton of Geneva (Switzerland), where most of the damage occurs and the majority of wild boar is culled. We adapted CR methods to estimate the population size of free-living wild boar after the main farrowing period and before the beginning of the culling season. Then, we compared our estimates to the culling bag statistics, which was the only kind of data previously available in our study area to assess wild boar population trends. We go on to discuss the limits and reliability of our counting method and calculated densities.
Materials and methods Study area
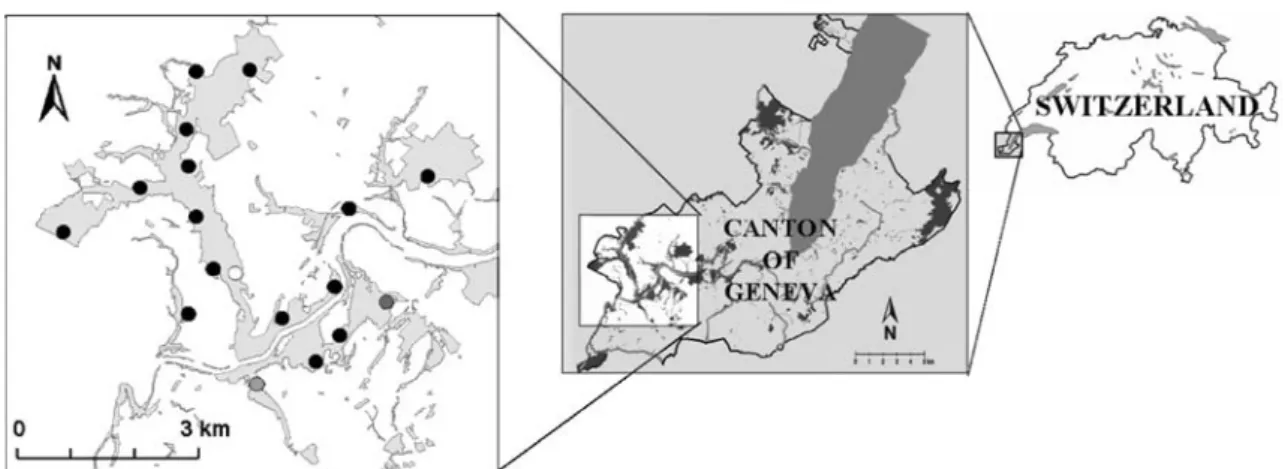
The Canton of Geneva, which lies entirely within the Basin of Geneva, is located at the western tip of Switzer-land (Fig. 1). The Canton covers an area of 240 km2and hosts 400,000 people. Natural predators of wild boar are absent, and hunting was abolished after a public vote in 1974. The sample region is located in the western part of the canton in an area covering 66 km2(46°09.6′–46°13.7′N, 5°57.2′–6°03.9′E; Fig. 1). Elevation ranges from 350 to 470 m a.s.l. The climate is temperate with an average tem-perature of 9.8°C, varying from−1°C in January to 19°C in July. Annual precipitation averages 822 mm and is evenly spread throughout the year (http://www.meteosuisse.ch). Cultivated areas, mainly vineyards and cereal crops, cover 65% of the study area. Forests cover 20% of the area and are mainly distributed along the rivers or scattered in small patches, often not exceeding 1 ha in size. Deciduous oaks (Quercus sp.) are the dominant trees (Steiger1995; Delarze et al.1998) and might produce substantial amounts of mast in autumn and winter. Two main rivers, easily crossed by wild boar, pass through the area, the Rhône River (E–W) and the smaller Allondon River (N–S). The banks of the Allondon River are part of an active alluvial zone. Willows (Salix sp.), alders (Alnus sp.), and ash (Fraxinus excelsior) are present at the flooded areas and along the riverbanks (Delarze et al. 1998). Villages, roads, farms, and other buildings account for 15% of the surface.
Capture and marking
Animals were captured from 2002 to 2005 in live-traps baited with maize (Fischer et al. 2004b). All captured
animals were fitted with uniquely numbered yellow cattle ear-tags and assigned to one of four age categories according to their estimated weight and coat color. Piglets are striped coat, weighing less than 20 kg, and generally, up to 4 to 6 months old. Juveniles are reddish coat, weighing 20 to 40 kg, and generally, 6 to 12 months old. Subadults are black coat, weighing more than 40 kg, between 12– 24 months old, looking smaller than adults. Adults are black or silver coat, looking big and heavy, and generally, weighing more than 60 kg (Dardaillon 1988; Fernandez-Llario and Carranza2000; Santos et al.2006). Fully-grown individuals were fitted with fixed radio-collars (ATS, USA). Other individuals were fitted with Televilt® transmitters (TVP Positioning AB, Sweden) adjusted in extensible collars developed by the ONCFS (Brandt et al. 2004) or ear transmitters (Biotrack®, UK). After handling, all were released at their capture site.
In 2004, only subadults and adults were marked with transmitters. Since 2005, to enlarge the marked fraction of the population, juveniles were also fitted with transmitters or special ear tags. These special tags (S05) were similar to the simple ear tags described above but with a stripe of red reflecting foil glued on it to allow identification. Thus, the marked population, i.e., all animals belonging to the same age classes as marked animals, considered in our counting ses-sions was made up of only subadults and adults in 2004, and juveniles, subadults, and adults in the two following years. Resights
Resights were obtained through phototrapping sessions in early June in 2004, 2005, and 2006 for a period of four to six consecutive nights. Up to 18 different counting sites were used throughout the three counting sessions (Fig.1). Most of the counting sites (N=13) were already used for trapping. However, no trapping was carried out at these sites during baiting and counting sessions. Other sites (N=5)
were selected according to presence indices and suitability for access and camera-trap installation. Before each session, the selected sites were baited with maize every second day for 1–2 weeks and checked for wild boar presence. During the counting sessions, all sites were checked and rebaited daily. All sites (except for two in 2004) were fitted with infrared motion-detecting cameras (CamTrakker®, CamTrak South, USA, and “Bandgenossenschaft Bern”, KORA, Switzerland). The minimum time delay between two suc-cessive photos was set to 20 min. Each wild boar on a photo-graph, either marked or unmarked, was considered as one sighting. In 2004, the two sites without camera traps were surveyed by observers at sunset. Time and kind of observation was noted, and this information was treated as if it had been generated by camera traps. To test the potential impact of sampling method variation, we calculated potential and effective sampling effort. Potential sampling effort considered all sites that were surveyed during a session and, so, could have produced sightings, multiplied by the total sampling nights. Effective sampling effort accounted for technical failures, thus, only considering the sites that really provided sightings.
For each counting session, we determined the number of marked boars (Nk) known to be present at the study area, i.e.,
the fraction of the marked population present. The presence of individuals with transmitters was checked by radio-tracking. S05-marked boars were eliminated from the mark-ed population if (1) they were known to be dead or (2) they were subadult males at the time of the counting sessions, assuming that subadult males would have dispersed out of the study area (Truvé 2004). On the counting sites, indi-viduals with transmitters were identified by radio tracking, whereas animals with S05 marks were identified visually.
We determined the number of marked individuals ac-tually seen and identified on the counting sites (nk), and the
total number of sightings generated by marked (Sk) and
unmarked animals (Su).
Fig. 1 Location of the Canton of Geneva and the study area. Left map Counting sites used throughout the study (black spots), only in 2004 (dark gray spot), in 2004 and 2005 (gray spot), and only in 2006
(white spot) are displayed. Light gray patches on the left map represent forests and wooded patches
Population size estimators
We used Minta and Mangel (MM, 1989) and Bowden’s (BW; Bowden and Kufeld 1995) estimators to assess the size of the marked population (N). Basically, these esti-mators use the known sighting frequencies of marked animals to estimate the number of different unmarked animals that were sighted (for detailed methods, see Minta and Mangel 1989 and Bowden and Kufeld 1995). Both methods share the same general capture–resight assump-tions for geographically and demographically closed free-ranging populations. Marked animals on initial captures are a random sample of the population, and both marked and unmarked animals have equal and independent probability of being sighted during the counting sessions. Both esti-mators require individual and proper identification of marked animals during sightings. Finally, both models allow a sample drawn with replacement (Seber 1982), so that marked animals might be seen more than once on a survey and
admit variability in sighting frequencies of marked animals (Minta and Mangel 1989; Neal et al. 1993; Bowden and Kufeld1995; White 1996). Concerning unmarked animals, only the sum of their sightings (Su) needs to be known.
All calculations were run using the program Noremark (Neal et al.1993; White1996).
Total population size
To estimate the total population size (Ntot), we assessed the
minimal size of the unmarked population, i.e., all animals belonging to the unmarked age-classes at each counting session. Thus, we added minimum numbers of juveniles and piglets (June 2004) or minimum number of piglets (June 2005–2006) to the CR estimates. These minimum numbers were determined as the number of different juveniles and/or piglets individually identified on the pictures taken through the counting sessions. To avoid double counting, particular attention was given to the following aspects: (1) timing of the observations, (2) morphological features of the animals, (3) group size, and (4) group composition (i.e., age classes). Density
Wild boar density was assessed for each session as the total population size (Ntot), divided by the surface area that was
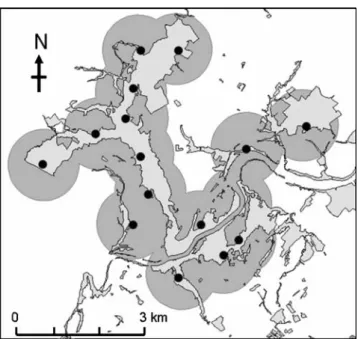
assumed to be effectively sampled. This area varied slightly between the sessions according to changes in camera trap setups. To establish this area, each counting site was sur-rounded by a circular buffer (Sweitzer et al. 2000), which equalled the mean 95% fixed kernel home range observed in the study area (Fischer et al. 2004a). We defined the “effectively sampled area” as the total surface covered by the buffers without overlapping for each counting session (Fig. 2).
Culling bags
Wild boar are exclusively culled at night by official game wardens from July to February. Date and location of death, as well as the time spent in the field by the wardens, are Fig. 2 Effectively sampled area in June 2005. Counting sites (black
spots), forest patches (light gray surfaces), and total surface covered by merged buffers (gray circles)
Table 1 Sampling effort realized during the different counting sessions
Session June 2004 June 2005 June 2006
Date of session 14–18.06.2004 09–15.06.2005 29.05–03.06.2006
Counting nights (CN) 4 6 5
Counting sites monitored (CS) 17 16 16
By technicians 2 – –
By camera traps 15 16 16
Camera-trap failures (CF) – 2 3
Potential sampling effort (CN × CS) 68 96 80
Effective sampling effort (CN×(CS−CF)) 68 84 65
recorded among other information. The total number of shot animals on our study area was weighted by the daily culling effort (hours per day) to establish a Culling Index (CInd). The trends shown by the CInd were compared to our reported total population estimates (Ntot).
Results
In 2004, all sites but one (16 out of 17) were used by wild boar and provided sightings. In 2005 and 2006, an absence of sightings was recorded at two and three spots, respec-tively, although they were used by wild boar. However, neither potential (χ2=4.84, df=2, p>0.05) nor effective (χ2
= 2.93, df=2, p>0.05) sampling efforts differed significantly between the three counting sessions (Table1).
At the time of the different counting sessions, 12, 20, and 17 boars were marked, whereas 5, 6, and 7 of these individuals were resighted at least once during each session, respectively. Marked animals were seen one to three times in the 2004 survey, two to four times in the 2005 survey, and five to ten times in the 2006 survey. The overall pro-portion of resighted marked animals (nk/Nk) did not differ
significantly between sessions (χ2
=0.41, df=2, p>0.05). There was no significant difference in the total sightings of marked (Sk, 04–05; χ2=2.28, df=2, p>0.05) and unmarked
(Su, 04–05; χ2=0.46, df=2, p>0.05) individuals between
June 2004 and June 2005, whereas there was a significant increase in both values in June 2006 (Sk, 05–06; χ2=11.57,
df=1, p<0.01; Su05–06; χ2=73.22, df=1, p<0.01; Table2).
The Minta–Mangel estimator gave stable estimates for June 2004 and June 2005 (N=188) and a decrease in June 2006 (N=148). Bowden’s estimator showed a slight increase of estimated population size from June 2004 (N=164) to June 2005 (N=177) and a decrease in June 2006 (N=138). Both estimators indicate a decreasing tendency over the 3 years of survey. For both estimators, 95% confidence intervals (CIs) were narrowest in 2006. Significantly more piglets were counted in 2006 than in 2005 (χ2
=13.2, df=1, p<0.01). When compared to each other, both estimators provided similar Ntot in each counting session, with no significant
difference (2004,χ2=1.01; 2005, χ2=0.25; 2006,χ2=0.20, df=1, p>0,05). For any estimator, differences in Ntotover the
three sessions were not significant (MM,χ2=5.49; BW,χ2= 3.01, df=2, p>0.05) (Table 2). Thus, the total population appears to be quite stable over the three counting sessions. However, a slight decreasing tendency can be observed be-tween the first two sessions (Fig.3). Despite a comparable culling effort over the three culling periods, the number of shot wild boars diminished from 2004 to 2005, which re-sulted in a significant decrease of the CInd (χ2
=6.01, df=2, p<0.05; Table3). Thus, a decrease in population size be-tween the first two culling seasons seems reasonable, Table
2 Results overview for resights, marked population, and total population estimates, using Minta –Mangel and Bowden ’s estimators, and associated 95% CI Marked population Minimal size of unmarked population T otal population size (N tot ) Marked individuals located in the study area (N k ) Marked individuals resighted (nk ) Proportion of resighted marked individuals (nk /N k ) T otal sightings of marked individuals (Sk ) T otal sightings of unmarked individuals (Su ) Estimation of population size (N ) 95% CI June 2004 12 5 0.42 10 148 Minta –Mangel 188 156 –227 1 1 0 298 Bowden 164 78 –345 1 1 0 274 June 2005 20 6 0.3 18 160 Minta –Mangel 188 160 –242 60 248 Bowden 177 95 –332 60 237 June 2006 17 7 0.41 45 354 Minta –Mangel 148 124 –182 107 255 Bowden 138 78 –246 107 245
whereas the population remains stable afterwards. When compared together, CInd and total population estimates dis-played similar trends (Fig.3).
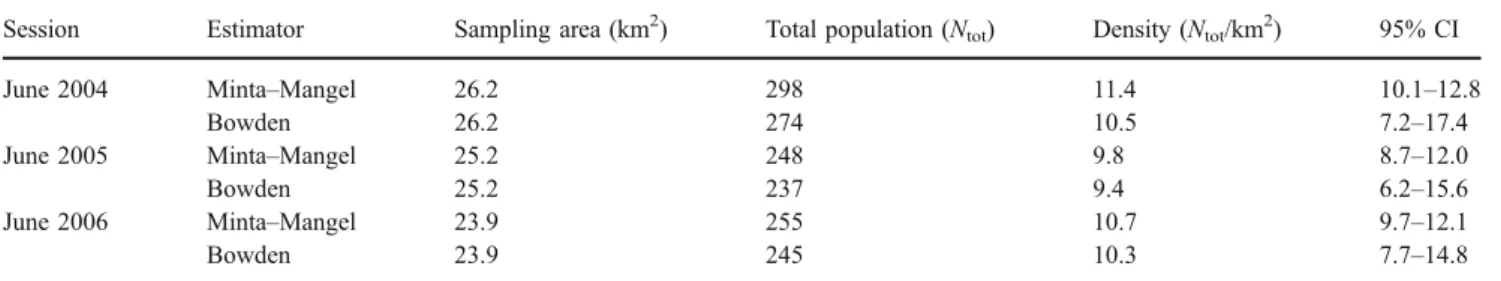
The sampling areas did not vary significantly over the sessions (χ2=0.11, df=2, p>0.05). Densities displayed the same tendencies as those reported for the total population estimates (Table4). Overall, considering MM and BW total population estimates, mean population density was 10.6± 0.8 SD individuals/km2with 95% CI ranging from 8.7 to 12.8 and 10.0±0.6 SD individuals/km2with 95% CI rang-ing from 6.2 to 17.4, respectively.
Discussion
Population size estimators
Several assumptions needed to be fulfilled to apply the se-lected estimators. As we had some evidence of migrations into as well as out of the study area through mark recov-eries, we assumed these migrations to be balanced and not to significantly act upon local densities. Radio tracking in-dicated that wild boar were mostly sedentary (Fischer et al. 2004b), and additionally, none of the radio-tracked indi-viduals left the study area during the sessions. Thus, given the restricted duration of each counting session, we assumed the population to be closed geographically and demographi-cally over these periods. Furthermore, significant recruitment because of births was also unlikely in the early summer, as most of the farrows occurred between December and May in the study area, with a marked minimum in the summer (Fattebert 2005). Transmitters and S05 ear tags allowed proper identification of all resighted individuals. Multiple recaptures of marked individuals indicated that ear tags remained consistently on the animals during their lifetime (Fischer, personal communication). Trapping and marking animals can influence their subsequent recapture
probabili-ties, especially if both capture and recapture methods are the same (Seber1970,1982), and Burnham and Overton (1979) suggested changing methods. Although we baited both cage traps and camera traps with maize, we expect the trapping techniques to differ enough to reduce bias because of trap response. The flashing of the cameras did not disturb the animals, as they stayed on the same spot for 1 h or more. Fournier et al. (1995) used spotlights to identify animals before trapping and made the same observations. Further-more, Sweitzer et al. (2000) did not notice any significant difference in sighting rates of tagged and untagged animals in California. Sighting rates were also similar between age classes. Morley and van Aarde (2007) assessed several mark–resight methods with an elephant population in dense woodlands. They concluded that Bowden’s estimator pro-vided the most realistic estimates and performed best with aggregated breeding herds. These findings suggest that this estimator might also be efficiently applied to other species living in forests and within social groups, e.g., wild boar (Kaminski et al.2005). Regarding the narrower CI obtained with MM, Neal et al. (1993) showed that CI coverage performed poorly (i.e., is too narrow) for this estimator. Despite improvements brought to MM (Gardner and Mangel 1996), Neal et al. (1993) and White and Shenk (2001) suggested the use of Bowden’s estimator to be preferred. Even so, we thought it was useful to consider both methods, as no other relevant population estimates, except culling bags, were available in our study area.
Population estimates
Variation in the sampling methods did not significantly affect resights over the three sessions. Thus, both estimators provided similar and comparable estimates of a stable population over the three consecutive counting sessions, although a slight decreasing tendency was apparent. However, the precision of any CMR estimate depends on
Fig. 3 Total population size estimates (Ntot) with both Minta–Mangel (MM; left) and Bowden’s (BW; right) estimators compared to the Culling
the proportion of marked animals in the sampled population (Seber1982). Our estimated proportion of marked animals (Nk/N) was only about 10% of the total population, which is
quite low compared to the 47 and 67% obtained with wild pigs by Sweitzer et al. (2000). Thus, our study may only provide raw estimates with poor precision. Because wild boar lacks unambiguous natural marks, determining mini-mal numbers of juveniles and/or piglets is difficult and does not contribute to increase precision. To increase accuracy, marking should be extended to more animals of all age classes. Some camera traps in 2005 and 2006 did not work, and because footprints and daily consumption of maize attested wild boar presence on these sites, some animals are likely to have been overlooked.
Sightings of tagged and untagged animals were signifi-cantly higher in 2006 than in the two previous sessions, leading to narrower 95% CIs. Neither variation in the sampling effort nor in the amount of maize used for baiting between the sessions is thought to explain these variations. More likely, the increased sightings are linked to the time setting of this last session, as it was held 2 weeks earlier than the previous ones. Wild boar were possibly less attracted to the less ripe surrounding crop fields and spent more time in the forest, consequently increasing their probability to feed on maize at the counting sites. Radio-tracking data collected around the time of the counts lends support to this idea. The same factors might also have contributed to the increased number of piglets counted in 2006. Reduced food competition because of a significant population decrease could also have allowed the animals to spend more time on the camera sites. However, we assume this to be unlikely regarding our stable estimates.
Never-theless, the significant increase of sightings in 2006 led to narrower CIs and, so, to higher precision. Morley and van Aarde (2007) showed that precision of both the estimates and the 95% CI provided by Bowden’s estimator increase with increased sampling effort. Consequently, counting sessions should be held over a longer period of time to provide more sightings and, preferably, in mid-spring, to optimize attraction of the counting sites. Still, the length of the counting session should be defined so as to satisfy the assumption for a closed population.
Nevertheless, as culling effort is known with precision and is comparable among the considered culling seasons, we can use this information to assess the suitability of our methods. Despite aforementioned factors that reduced precision, our estimates showed the same patterns as the culling bags. Considering this, these CR methods might describe reasonably well wild boar population trends in our study area. As far as marking and sampling efforts are standardized over several counting sessions, CR methods are thought to be a useful and quite simple tool to estimate the abundance of wild boar populations. Still, in our study area, the effect of the culling strategy has to be assessed, as we believe it to be the most important factor to influence wild boar mortality and variations in population size. Densities
Despite differences in sampled areas and sampling meth-ods, the densities found in the present study are among the highest reported in Western Europe (Melis et al. 2006; Table 5). Comparable densities were found in areas that provide favorable conditions for the wild boar. Habitat Table 3 Culling bag statistics of the study area (DNP; Wildlife and Fishery Department, Geneva)
Culling season Total wild boar shot
in the study area (Nc)
Total culling effort (h) Culling period (days) Daily culling effort (h/day) Culling index
(Nc/daily culling effort)
2004 189 1,233 243 5.1 37.2
2005 116 1,396 243 5.7 20.2
2006 118 1,222 243 5.0 23.5
Table 4 Wild boar densities for each year of survey and both estimators, and associated 95% CI
Session Estimator Sampling area (km2) Total population (N
tot) Density (Ntot/km2) 95% CI
June 2004 Minta–Mangel 26.2 298 11.4 10.1–12.8
Bowden 26.2 274 10.5 7.2–17.4
June 2005 Minta–Mangel 25.2 248 9.8 8.7–12.0
Bowden 25.2 237 9.4 6.2–15.6
June 2006 Minta–Mangel 23.9 255 10.7 9.7–12.1
Bowden 23.9 245 10.3 7.7–14.8
T able 5 Reported wild boar densities from dif ferent studies Country Location Sampled surface (km 2 ) Sampled surface assessed by relocations and/or radio-tracking Potential habitat Density (individual/km 2 ) Method Source Switzerland Canton Geneva 23.9 –26.2 Y es Oak-hornbeam forests 10.6/10.0 Capture –resight This study Italy T uscany 96.72 No Deciduous oak and chestnuts forests 12 Drive counts Massolo and Mazzoni della Stella ( 2006 ) Spain Doñana National Park – No Marshes, dune shrubs and forests 10 – Fernandez-Llario ( 1996 ) Italy T uscany 48.40 No Oak and chestnuts forests with patches of crop fields 9.8 Catch per unit ef fort Boitani et al. ( 1995b ) Italy Northern Apennines 7.7 –42.1 No Mixed and deciduous forest. 1.5 to 6.5 Drive counts Merli and Meriggi ( 2006 ) Spain Monfrague – No Perennial oak stands with dense shrub under growth 3.5 – Fernandez-Llario et al. ( 2004 ) Italy Maremma National Park 70 No Mediterranean scrubland 3 – Massei et al. ( 1997 ) France Camar gue 10.47 No Marshes, scrub and grassland, surrounded by cultivated farmland 2.7 – Dardaillon ( 1986 ) France Grésigne 36 No Oak and chestnuts forests with patches of crop fields and vineyards 2.5 – Spitz and Janeau ( 1990 ) Italy Genoa Apennines 59.56 No Hills and mid-range mountains 1.7 Drive census Marsan et al. ( 1995 ) USA California – Y es Oak woodlands, coastal sage scrub shrubs and riparian areas 0.7 to 3.8 a Capture –resight Sweitzer et al. ( 2000 ) USA Santa Catalina Island 60 Y es Patches of oak woodlands, coastal sage scrub and grassland 21 to 34 b Capture-recapture Baber and Coblentz ( 1986 ) Malaysia Pasoh Forest Reserve 25 No Lowland dipterocarp rain forests 47/27 a Line transects Ickes ( 2001 ) a Density of wild pigs (S. scr ofa ) b Density of feral pigs (S. scr ofa )
quality and diversity, especially at a small geographical scale, provide rich food availability all year round and favorable bedding sites (Acevedo et al. 2006; Merli and Meriggi2006). Food availability also affects the reproduc-tive success of wild boar, as this factor largely explains variation in population size between years (Massolo and Mazzoni della Stella2006), as well as the birth distribution (Santos et al.2006). Even if hunting can efficiently reduce population size (Geisser and Reyer 2004), it can also contribute to favor the regeneration of a hunted population (Fernandez-Llario et al.2003; Massolo and Mazzoni della Stella 2006). Therefore, hunting might not be the most important factor to explain density variations as similar population densities are reported in hunted (Dardaillon 1986; Boitani et al. 1995b) and non-hunted (Fernandez-Llario1996; Massei et al. 1997) areas. More likely, patchy distribution and changing availability of resources contrib-ute to lower (Spitz and Janeau 1990; Marsan et al. 1995; Fernandez-Llario et al.2004) or fluctuating (Sweitzer et al. 2000; Merli and Meriggi 2006) densities. Geographic confinement (Baber and Coblentz1986), absence of preda-tors, and abundant year-round food supply (Ickes2001) can lead to extreme densities not yet reported in the native range of the wild boar in Europe. The climatic parameters, especially mild winters, should be favorable for the wild boar in our study area. The diversified habitat constituted by patches of oak forests, wetland, and cultivated areas provide good year-round feeding conditions and suitable resting sites. Moreover, as densities remained rather con-stant over the duration of the study, we think the ecological conditions to be suitable enough to allow the population to compensate the losses caused by culling. Therefore, we assume our density estimates to be representative for the situation in our study area.
Acknowledgment This study was financially and logistically
sup-ported by the Domaine Nature et Paysage of Canton of Geneva (Switzerland). We are grateful to the official game wardens who participated in the captures and provided culling data. We thank the KORA (Coordinated Research Projects for the Conservation and Management of Carnivores in Switzerland) for lending us numerous camera traps. We specially thank Jacques-Olivier Chappuis, Marc Oberman, Maxime Roulet, Julien Vasse, Nicolas Thuaire, Jacques Thiébaud, and François Corcelle for efficient support in the fieldwork. C. Hebeisen was supported by a doctoral fellowship of the University of Neuchâtel. Many thanks to Prof. Redouan Bshary for useful comments on a previous draft of this manuscript and to Dr. Russell E. Naisbit for the English proofreading. Our experiment complied with the laws of Switzerland.
References
Acevedo P, Escudero MA, Munoz R, Gortazar C (2006) Factors affecting wild boar abundance across an environmental gradient
in Spain. Acta Theriol 51:327–336
Alpe D (1995) Distribution and density of wild boar (Sus scrofa) through tracks survey in the Orseria Rocciavre Natural Park,
Piedmont (Italy). IBEX J M E 3:209–210
Andrzejewski R, Jezierski W (1978) Management of a wild boar population and its effects on commercial land. Acta Theriol 23:
309–339
Baber DW, Coblentz BE (1986) Density, home range, habitat use, and reproduction in feral pigs on Santa Catalina Island. J Mammal 67:512–525
Boitani L, Mattei L, Nonis D, Corsi F (1994) Spatial and activity patterns of wild boars in Tuscany, Italy. J Mammal 75:600–612 Boitani L, Trapanese P, Mattei L (1995a) Demographic patterns of wild
boar (Sus scrofa L.) population in Tuscany, Italy. IBEX J M E
3:197–201
Boitani L, Trapanese P, Mattei L (1995b) Methods of population estimates of a hunted wild boar (Sus scrofa L.) population in
Tuscany. IBEX J M E 3:204–208
Bowden DC, Kufeld RC (1995) Generalized mark-sight population size estimation applied to Colorado moose. J Wildl Manage 59:
840–851
Brandt S, Vassant J, Baubet E (2004) Adaptation d’un collier émetteur
extensible pour Sanglier. Faune Sauvage 263:13–18
Burnham KP, Overton WS (1979) Robust estimation of population size when capture probabilities vary among animals. Ecology 60:
927–936
Castley JG, Knight MH, Mills MGL, Thouless C (2002) Estimation of the lion (Panthera leo) population in the southwestern Kgalagadi Transfrontier Park using a capture-recapture survey. Afr Zool 37: 27–34
Clutton-Brock TH, Coulson T, Milner JM (2004) Red deer stocks in
the highlands of Scotland. Nature 429:261–262
Coulson T, Catchpole EA, Albon SD, Morgan BJT, Pemberton JM, Clutton-Brock TH, Crawley MJ, Grenfell BT (2001) Age, sex, density, winter weather, and population crashes in Soay sheep.
Science 292:1528–1531
Dardaillon M (1986) Seasonal variations in habitat selection and spatial distribution of wild boar (Sus scrofa) in the Camargue,
southern France. Behav Proc 13:251–268
Dardaillon M (1988) Wild boar social groupings and their seasonal changes in the Camargue, southern France. Zeitschrift für
Säugetierkunde 53:22–30
Delarze R, Gonseth Y, Galland P (1998) Guide des milieux naturels de Suisse. Ecologie-Menaces-Espèces caractéristiques. Delachaux et Niestlé, Lausanne
Fattebert J (2005) Structure de la population, démographie et utilisation de l’espace par le sanglier Sus scrofa dans l’ouest du canton de Genève, Suisse. M.Sc. thesis, Université de Neuchâtel, Neuchâtel
Fernandez-Llario P (1996) Ecología del jabalí del Doñana: biología reproductiva e impacto ambiental. PhD thesis, University of Extremadura, Extremadura
Fernandez-Llario P, Carranza J (2000) Reproductive performance of the wild boar in a Mediterranean ecosystem under drought
conditions. Ethol Ecol Evol 12:335–343
Fernandez-Llario P, Matoes-Quesada PM, Silverio A, Santos P (2003) Habitat effects and shooting techniques on two wild boar (Sus scrofa) populations in Spain and Portugal. Zeitschrift
für Jagdwissenschaft 49:120–129
Fernandez-Llario P, Parra A, Cerrato R, de Mendoza J (2004) Spleen size variations and reproduction in a Mediterranean population of
wild boar (Sus scrofa). Eur J Wildl Res 50:13–17
Fickel J, Hohmann U (2006) A methodological approach for non-invasive sampling for population size estimates in wild boars (Sus scrofa). Eur J Wildl Res 52:28–33
Fischer C, Baubet E, Thiébaud J, Roulet M, Prunier J, Dändliker G (2004a). Spatial behaviour of wild boars in the Basin of Geneva.
In Bobek B (ed) 5th International Wild Boar and Suidae Symposium. Abstracts. Krakow, Poland
Fischer C, Gourdin H, Obermann M (2004b) Spatial behaviour of the wild boar in Geneva, Switzerland: testing the methods and first results in Fonseca C, Herrero A, Luis A, and Soares AMVM (eds) Wild boar research 2002. A selection and edited papers from the 4th Intrenational Wild boar Symposium. Galemys, Màlaga. Pages 149–155
Fonseca C, Herrero J, Luis A, Soares AMVM, editors (2004) Wild Boar Research 2002. A selection and edited papers from the 4th International Wild Boar Symposium. Galemys, 16 Special Issue. SECEM, Màlaga
Fournier P, Maillard D, Fournier-Chambrillon C (1995) Use of spotlight for capturing wild boar (Sus scrofa L.). IBEX J M E 3:
131–133
Gabor TM, Hellgren EC, Van Den Bussche RA, Silvy NJ (1999) Demography, sociospatial behaviour and genetics of feral pigs
(Sus scrofa) in a semi-arid environment. J Zool 247:311–322
Gardner SN, Mangel M (1996) Mark–resight population estimation
with imperfect observations. Ecology 77:880–884
Geisser H, Reyer H-U (2004) Efficacy of hunting, feeding, and fencing to reduce crop damage by wild boar. J Wildl Manage 68: 939–946
Geisser H, Reyer H-U (2005) The influence of food and temperature on population density of wild boar Sus scrofa in the Thurgau (Switzerland). J Zool 267:89–96
Hauser CE, Pople AR, Possingham HP (2006) Should managed
populations be monitored every year? Ecol Appl 16:807–819
Hauser CE, Runge MC, Cooch EG, Johnson FA, Harvey WF (2007) Optimal control of Atlantic population Canada geese. Ecol Model
201:27–36
Hein EW, Andelt WF (1995) Estimating coyote density from mark–
resight surveys. J Wildl Manage 59:164–169
Ickes K (2001) Hyper-abundance of native wild pigs (Sus scrofa) in a lowland dipterocarp rain forest of Peninsular Malaysia. Biotropica
33:682–690
Kaminski G, Brandt S, Baubet E, Baudoin C (2005) Life-history
patterns in female wild boars (Sus scrofa): mother–daughter
postweaning associations. Can J Zool 83:474–480
Karanth KU (1995) Estimating tiger Panthera tigris populations from camera-trap data using capture-recapture models. Biol Conserv 71:333–338
Karanth KU, Nichols JD (1998) Estimation of tiger densities in India using photographic captures and recaptures. Ecology 79:2852–2862 Karanth KU, Chundawat RS, Nichol JD, Kumar NS (2004) Estimation of tiger densities in the tropical dry forests of Panna,
Central India, using photographic capture–recapture sampling.
Anim Conserv 7:285–290
Klein F, Baubet E, Toigo C, Leduc D, Saint-Andrieux C, Saïd S, Fréchard C, Vallance M, Vassant J, Boiseaubert B, Monnier A, Ferté C, Lefebvre B (2004) La gestion du sanglier, des pistes et des outils pour réduire les populations. ONCFS
Mace RD, Minta SC, Manley TL, Aune KE (1994) Estimating grizzly bear population size using camera sightings. Wildl Soc Bull 22:
74–83
MacKenzie DI, Nichols JD, Sutton N, Kawanishi K, Bailey LL (2005) Improving inferences in populations studies of rare species that are detected imperfectly. Ecology 86:1101–1113
Marsan A, Spanò S, Tognoni C (1995) Management attempts of wild boar (Sus scrofa L.): first results and outstanding researches in northern Apennines (Italy). IBEX J M E 3:219–221
Massei G, Bacon P, Genov P (1998) Fallow deer and wild boar pellet group disappearance in a Mediterranean area. J Wildl Manage
62:1086–1094
Massei G, Genov P, Staines BW, Gorman ML (1997) Factors influencing home range and activity of wild boar (Sus scrofa)
in a Mediterranean coastal area. J Zool 242:411–423
Massolo A, Mazzoni della Stella R (2006) Population structure variations of wild boar Sus scrofa in central Italy. Ital J Zool 73:137–144
Melis C, Szanfranska PA, Jedrzejewska B, Barton K (2006) Biogeographical variation in the population density of wild boar (Sus scrofa) in western Eurasia. J Biogeogr 33:803–811
Merli E, Meriggi A (2006) Using harvest data to predict habitat–
population relationship of the wild boar Sus scrofa in Northern
Italy. Acta Theriol 51:383–394
Miller SD, White GC, Sellers RA, Reynolds HV, Schoen JW, Titus K, Barnes VG, Smith RB, Nelson RR, Ballard WB, Schwartz CC (1997) Brown and black bear density estimation in Alaska using
radiotelemetry and replicated mark–resight techniques. Wildl
Monogr 133:5–55
Minta SC, Mangel M (1989) A simple population estimate based on
simulation for capture–recapture and capture–resight data. Ecology
70:1738–1751
Morley RC, van Aarde RJ (2007) Estimating abundance for savanna elephant population using mark–resight methods: a case study for the Tembe Elephant Park, South Africa. J Zool 271:418–427 Neal AK, White GC, Bruce Gill R, Reed DF, Olterman JH (1993)
Evaluation of mark–resight model assumptions for estimating mountain sheep numbers. J Wildl Manage 57:436–450 Nichols JD (1992) Capture-recapture models: using marked animals to
study population dynamics. BioScience 42:94–102
Okarma H, Jedrzejewska B, Jedrzejewski W, Krasinski Z, Milkowski L (1995) The roles of predation, snow cover, acorn crop, and man-related factors on ungulate mortality in Bialowieza Primeval
Forest, Poland. Acta Theriol 40:197–217
Otis DL, Burnham KP, White GC, Anderson DR (1978) Statistical inference from capture data on closed animal populations. Wildl
Monogr 62:7–135
Pollock KH, Nichols JD, Brownie C, Hines JE (1990) Statistical inference
for capture–recapture experiments. Wildl Monogr 107:1–97
Pollock KH, Nichols JD, Simons TR, Farnsworth GL, Bailey LL, Sauer JR (2002) Large scale wildlife monitoring studies: statistical methods for design and analysis. Environmetrics 13: 105–119
Russo L, Massei G, Genov P (1997) Daily home range and activity of wild boar in a Mediterranean area free from hunting. Ethol Ecol Evol 9:287–294
Sàez-Royuela C, Telleria JL (1986) The increased population of wild
boar (Sus scrofa) in Europa. Mamm Rev 16:97–101
Santos P, Fernandez-Llario P, Fonseca C, Monzon A, Bento P, Soares AMVM, Mateos-Quesada P, Petrucci-Fonseca F (2006) Habitat and reproductive phenology of wild boar (Sus scrofa) in the
western Iberian Peninsula. Eur J Wildl Res 52:207–212
Schley L, Krier A, Wagner M, Roper TJ (1998) Changes in the wild boar Sus scrofa population in Luxembourg during the period 1946 to 1996. Bulletin de la société des Naturalistes Luxembourgeois 99:
77–85
Schwarz CJ, Seber GAF (1999) Estimating animal abundance: review
III. Stat Sci 14:427–456
Seber GAF (1970) The effects of trap response on tag recapture estimates. Biometrics 26:13–22
Seber GAF (1982) The estimation of animal abundance and related parameters. 2nd edn. Charles Griffin, London
Silver SC, Ostro LET, Marsh LK, Maffei L, Noss AJ, Kelly MJ, Wallace RB, Gomez H, Ayala G (2004) The use of camera traps for estimating jaguar Panthera onca abundance and density using
Spitz F, Janeau G (1990) Spatial strategies: an attempt to classify daily
movements of wild boar. Acta Theriol 35:129–149
Steiger P (1995) Wälder der Schweiz. 2nd edn. Ott Verlag, Thun Sweitzer RA, Van Vuren D, Gardner IA, Boyce WM, Waithmann JD
(2000) Estimating sizes of wild pig populations in the north and central region of California. J Wildl Manage 64:531–534 Truvé J (2004) Pigs in space: movement, dispersal and geographic
expansion of wild boar (Sus scrofa) in Sweden. Doctoral thesis, Göteborg University, Göteborg
Waithmann JD, Sweitzer RA, Van Vuren D, Drew JD, Brinkhaus AJ, Gardner IA, Boyce WM (1999) Range expansion, population
sizes, and management of wild pigs in California. J Wildl Manage
63:298–308
White GC (1996) Noremark: population estimation from mark–
resighting surveys. Wildl Soc Bull 24:50–52
White GC, Shenk TM (2001) Populations estimation with radio-marked animals. In: Millspaugh JJ, Marzluff JM (eds) Radio tracking and animal populations. Academic, San Diego, pp pp330–350 Zimmermann F, Weber J-M, Molinari-Jobin A, Ryser A, von Wattenwyl
K, Siegenthaler A, Molinari P, Angst C, Breitenmoser-Würsten C, Capt S, Breitenmoser U (2005) Monitoring der Raubtiere in der