Veronika Zubler Bernard Mengiardi Christian W. A. Pfirrmann Sylvain R. Duc Marius R. Schmid Juerg Hodler Marco Zanetti Received: 21 December 2006 Revised: 1 March 2007 Accepted: 8 May 2007 Published online: 7 July 2007
# Springer-Verlag 2007
Bone marrow changes on STIR MR images
of asymptomatic feet and ankles
Abstract The purpose of this study was to evaluate the prevalence, pattern and size of bone marrow changes on short-tau inversion recovery (STIR) magnetic resonance (MR) images of asymptomatic feet and ankles. In 78 asymptomatic volunteers (41 women, 37 men; median age 47 years; range 23–83 years) sagittal STIR MR images of hindfoot and midfoot were reviewed for various patterns of high signal changes in bone marrow. The size of these bone marrow changes was measured, and signal intensity was rated semi-quantitatively using a scale from 0(=normal) to 10(=fluid-like). Fifty percent (39/78) of all volunteers had at least one bone
marrow change. Thirty-six percent (28/78) of all volunteers had edema-like changes, 26% (20/78) had necrosis-like changes, and 5% (4/78) had cyst-like changes. The long diameters of all changes varied between 4 mm and 16 mm (median 7.5 mm). The median signal intensity for all changes was 5.0 (range 1–10). Bone marrow changes on STIR MR images are commonly detected in asymptomatic feet and ankles. How-ever, such changes tend to be small (<1 cm) or subtle.
Keywords Foot . MR imaging . Pitfalls . Bone marrow .
Normal variants
Introduction
Magnetic resonance (MR) abnormalities with increased signal on T2-weighted or short-tau inversion recovery (STIR) images in the foot and ankle are found in a wide array of conditions, including occult fractures, osteo-chondral defects, disorders of tendons with subtendinous bone marrow abnormalities, osteoarthritis, inflammatory arthropathies, osteomyelitis, neuropathic arthropathy, be-nign and malignant neoplasm [1–10]. Such abnormalities are clinically relevant and are often associated with pain [2, 11–13]. However, increased signal on STIR images may also represent normal variants or clinically asymptomatic abnormalities. Lohman et al. [14] reported that in individuals performing recreational sports a number of MR findings, including bone marrow edema, occur without any symptoms. On the other hand, little is known about the prevalence, size and location of increased signal on STIR images in the bone marrow of asymptomatic feet and
ankles. We believe that such knowledge is relevant because these signals may simulate disease, potentially leading to unnecessary diagnostic work-up and treatment.
Thus, the purpose of this study was to evaluate the prevalence, pattern and size of bone marrow changes on STIR MR images of asymptomatic feet and ankles.
Materials and methods
Asymptomatic volunteers
Seventy-eight asymptomatic volunteers (41 women, 37 men; median age 47 years; range 23–83 years) were prospectively included in the study. Asymptomatic volun-teers had to fulfill following inclusion criteria: (1) age older than 20 years, (2) no foot and ankle complaints, (3) no previous foot and ankle surgery, (4) no history of trauma of the foot/ankle for the last two years, (5) no inflammatory V. Zubler . B. Mengiardi .
C. W. A. Pfirrmann . S. R. Duc . M. R. Schmid . J. Hodler . M. Zanetti (*)
Department of Radiology, University Hospital, Balgrist, Forchstrasse 340,
8008 Zurich, Switzerland e-mail: [email protected] Tel.: +41-44-3863303
obtained from each volunteer. The study was approved by the local investigational board. The study protocol planned to include 14 volunteers (seven men and seven women) for each decade between ages 20 and 80 or older. However, one female volunteer in the fifth decade had to be excluded because one MR series was not correctly saved on the PACS. One male volunteer in the sixth decade was excluded because he had pronounced tendon and ligament abnormalities, casting some doubts on the reliability of the volunteer during the recruiting interview. Due to difficul-ties in finding asymptomatic elderly volunteers, only ten asymptomatic volunteers (three men, seven women) could be included for the subpopulation older than 70 years.
MR imaging
MR imaging of the hindfoot, including the ankle and midfoot, was performed with a 1.5- T system (Symphony; Siemens Medical Solutions, Erlangen, Germany). Subjects were examined in the supine position with the ankle in neutral position in the extremity coil. Sagittal T1-weighted spin-echo images (repetition time, echo time, 330/14 ms, 3-mm section thickness, 19-cm field of view, matrix size 512×512) and sagittal fast spin echo STIR images (4,000/89/170 ms inversion time, 3-mm section thickness, 19-cm field of view, matrix size 512×512) were obtained. These two sequences were adapted from our standard sequences for patients with hindfoot and midfoot abnor-malities. The cause that the forefoot was not included in this study was that in our institution, the forefoot examination is performed separately in prone position with a smaller field of view.
Qualitative analysis
MR examinations were analysed in consensus by two readers [two staff radiologists with eight years (M.S.) and
ology] using a PACS Workstation (Cerner ProVision, Idstein, Germany). The following distinct patterns of bone marrow abnormalities were recorded [15,16]:
Type 1:
Edema-like bone marrow changes characterized by ill-defined, low signal intensity (in comparison to normal fatty marrow) on T1-weighted images and high signal intensity on STIR images.
Type 2:
Necrosis-like changes characterized by well-defined, low signal intensity on T1-weighted and high signal intensity on STIR images.
Type 3:
Cystic bone marrow changes characterized by well-defined, round, homogeneous, with low signal intensity on T1-weighted and with pronounced hyperintensity on STIR images. The cystic bone marrow changes were categorized as either subarticular or intraosseous. More-over, surrounding edema-like changes were recorded. For each bone marrow change, the anatomic location was recorded. Multiple changes were also noted. In addition, tendon abnormalities, plantar fasciitis and osteo-arthritis adjacent to the signal abnormalities were noted.
Quantitative and semi-quantitative analysis
The size of all bone marrow changes determined by the experienced readers was measured by a trained fourth-year resident (V.Z.) using the PACS workstation. The maximal diameters in the cranio-caudal and anterior-posterior orientations were measured. The area of the abnormality was calculated with the ellipsoid formula: [(a×b)/4]×Pi; where a is the long diameter and b is the short diameter.
The signal intensities of the bone marrow changes on the STIR images were graded semi-quantitatively from 0 to 10 (0: signal intensity identical to normal bone marrow; 10: hyperintensity comparable with fluid) in analogy to a
Fig. 1 A 43-year-old asymp-tomatic male volunteer with subtle edema-like Type 1 bone marrow changes. a Type 1 bone marrow change (arrowhead) is demonstrated in the talus on a sagittal fast spin-echo STIR (4,000/30/150) image. b The Type 1 abnormality is barely visible (arrowhead) on the cor-responding sagittal T1-weighted spin-echo image (330/14)
visual analogue scale score by the same fourth-year resident. In volunteers with multiple changes, the most conspicuous finding was assessed.
Statistics
Descriptive statistics were used to demonstrate the prev-alence of the changes. Associations between gender and the different types of bone marrow changes were tested by the chi-square test. To analyse associations between age and the various bone marrow changes, the Wilcoxon rank sum test was used. The relationship between the size of bone marrow changes, age and gender was analysed by a Spearman rank correlation (age) and a Wilcoxon rank sum test (gender). A P value of <0.05 was considered to indicate statistical significance. SPSS (version 11.5.0; SPSS, Chicago, Ill.) was used to perform all statistical calculations.
Results
Prevalence and location of bone marrow changes
Fifty percent (39/78) of all volunteers had at least one bone marrow change in the hindfoot or midfoot. Type 1 bone marrow changes (Figs.1,2) were seen in 36% (28/78) of volunteers, Type 2 bone marrow changes (Fig.3) in 26% (20/78), and Type 3 bone marrow changes (Fig.4) in 5% (4/78). Three cysts were subarticularly located and one cyst was intraosseous near the Achilles tendon insertion. All subarticular cysts were surrounded by edema-like bone marrow changes, while the intraosseous cyst was not. The prevalence of feet with multiple changes was 24% (19/78). Ten volunteers had two changes, five had three, four had four, and one had six. No significant association (chi square test P values ranged between 0.29 and 0.92) was present between gender and presence of bone marrow changes. Fig. 2 A 31-year-old
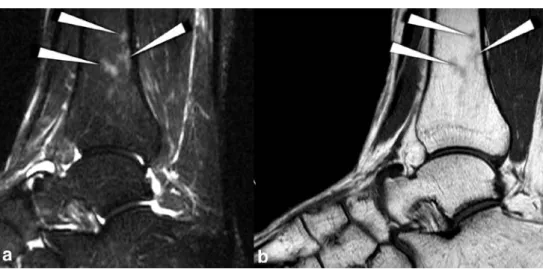
asymp-tomatic female volunteer with multiple edema-like Type 1 bone marrow changes. a Type 1 bone marrow changes (arrow-heads) with a signal intensity of 3 is demonstrated in the tibia on a sagittal fast spin-echo STIR image (4,000/84/170). b The Type 1 abnormality is barely visible (arrowheads) on the corresponding sagittal T1-weighted spin-echo image (330/14)
Fig. 3 A 44-year-old asymp-tomatic male volunteer with necrosis-like Type 2 bone mar-row changes. a A well-defined bone marrow change (arrow-head) with high signal intensity (6) on a sagittal fast spin-echo STIR image (4,000/84/170) in the distal portion of the calcaneal bone. b The Type 2 bone marrow change shows low signal intensity on T1-weighted spin-echo image (330/14) (arrowhead)
Bone marrow changes were found in the fibula (n=2), the tibia (n=8), the talus (n=16), the calcaneus (n=15), the navicular (n=3), the cuboid (n=4), the medial cuneiform (n=8), the intermediate cuneiform (n=5) and in none of the lateral cuneiforms. In one volunteer (61 years old), Type 1 bone marrow changes were seen in an os tibiale externum. In 14 volunteers, an os trigonum was found, of which 36% (5/14) presented with edema-like signal.
Prevalence of bone marrow changes related to age
Thirty-six percent (10/28) of bone marrow changes were found in 20- to 39-year-old volunteers, 65% (17/26) in 40- to 59-year-old volunteers, and 50% (12/24) in 60- to 83-year-old volunteers. In 20- to 39-year-old volunteers, Type 1 changes were most commonly found (prevalence 36%; 10/28), Type 2 changes were uncommon (11%; 3/28) and cystic Type 3 changes were not seen. In 40- to 59-year-old volunteers, Type 1 (46%; 12/26) and Type 2 (38%; 10/26) changes were
equally common; Type 3 changes were seen once (a 51-year-old volunteer). In volunteers above the age of 60 years, Type 1 (25%; 6/24) and Type 2 (29%; 7/24) changes were equally common; Type 3 changes were rare (three volunteers, aged 63, 63 and 76) (Fig.5).
Bone marrow changes associated with osteoarthritis, tendon insertion and ligament attachment
Bone marrow changes associated with osteoarthritis were exclusively found in volunteers above age 50. The prevalence of osteoarthritis was 0% between ages 20 and 49 (0/41), 8% (1/13) between ages 50 and 59, 36% (5/14) between ages 60 and 69, and 40% (4/10) in volunteers above age 70. In four volunteers (5%), bone marrow changes were located adjacent to a tendon or fascia. There was a calcaneal edema-like signal adjacent to a thickened plantar fascia (45 years old), a calcaneal cyst at the insertion of a normal Achilles tendon in a 51-year-old tomatic male volunteer with
necrosis-like Type 2 and cystic Type 3 bone marrow changes. a A Type 3 bone marrow change (white arrowhead) in the medial cuneiform with a round hyper-intensity (signal hyper-intensity of 9) on a STIR image (4,000/84/170) located subchondral immediate adjacent to a necrosis-like Type 2 change near the navicular-cuneiform joint (black arrowhead) with b low signal intensity on the corresponding T1-weighted image (330/14) 0.00 10.00 20.00 30.00 40.00 50.00 60.00 20-29 30-39 40-49 50-59 60-69 70-79 age group Prevalence in % edema-like necrosis-like cystic Fig. 5 Histogram showing
the prevalence of edema-like (Type 1), necrosis-like (Type 2) and cystic (Type 3) MR changes in relation to age
volunteer, an edema-like Type 1 signal in the fibula close to a normal-appearing peroneal tendon in a 51-year-old volunteer, and a Type 1 signal abnormality in the tibia close to a normal-appearing posterior tibial tendon in a 23-year-old volunteer. Five of 15 (33%) calcaneal bone marrow changes were located at the attachment of the cervical and intraosseous ligaments at the Gissane’s angle (Fig.6). Three of them were classified as Type 2, and two as Type 1 abnormality.
The Wilcoxon rank sum tests revealed a statistically significant relationship with age for cysts (P=0.049) and for changes associated with osteoarthritis (P<0.001). All other P values were greater than 0.05.
Size and signal intensity of bone marrow changes
The areas of all changes varied between 9 mm2and 151 mm2. The range of edema-like signal was 9–151 mm2 (median 34 mm2), of necrosis-like changes 12–64 mm2 (median 24 mm2), and of cystic changes 9–38 mm2(22 mm2). The long diameters of all changes varied between 4 mm and 16 mm (median 7.5 mm). The corresponding values for Type 1 changes were 4–16 mm (7.5 mm), for Type 2 changes 4–9 mm (6.0 mm) and for cystic Type 3 changes 4–7 mm (5.5 mm) (Table 1). Type 1 changes longer than 1 cm were detected in six feet. The diameters of Type 2 and 3
changes were all shorter than 1 cm. The areas of the changes did not differ significantly (Wilcoxon rank sum test, all P values >0.29) between men and women. No significant relationship between size of the changes and age was found (Spearman rank correlation).
The median signal intensity for all changes was 5.0 (range 1–10). The median signal intensity of Type 1 bone marrow changes was 3.0 (range: 1–7). For Type 2 changes the median intensity was 5.0 (range: 3–9), and for the Type 3 changes 8.5 (range: 8–10)
Discussion
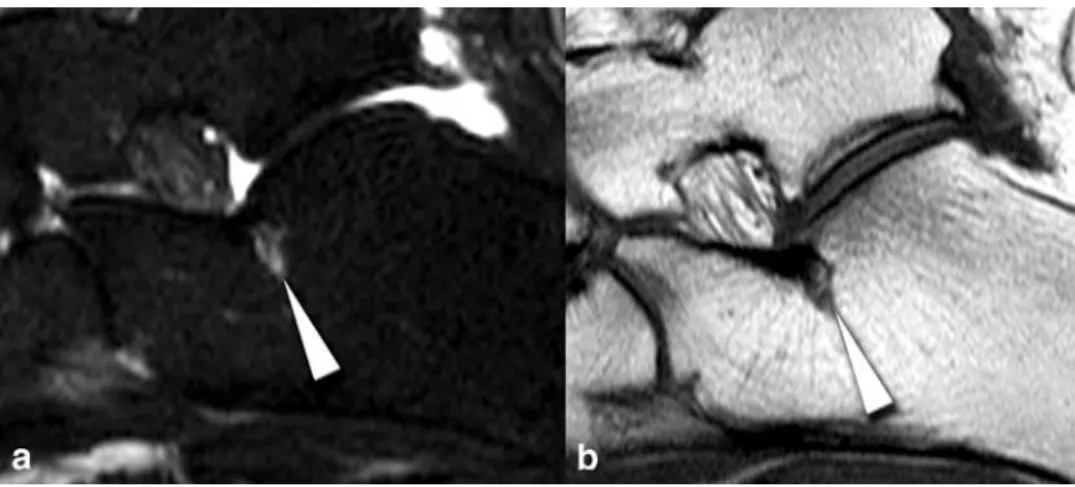
Our results indicate that subtle bone marrow changes detected on STIR MR images of the foot and ankle are common and are not necessarily responsible for symptoms. The prevalence of changes in the current study is relatively high (50%). However, the extent and signal intensity of the bone marrow changes in the current study were substan-tially smaller than those in symptomatic patients with unexplained chronic foot pain, stress fractures, degenera-tive disorders, inflammatory arthropathies, necrosis, osteo-myelitis, neuropathic arthropathy and other diseases [1,2, 4–8,13]. Admittedly, we have no quantitative comparison because previously published studies in symptomatic feet with bone marrow changes did not measure similarly in Fig. 6 A 46-year-old
asymp-tomatic male volunteer with necrosis-like changes attributed to prominent vascular remnants [22] at the attachment of the cervical and interosseous ligaments (at the Gissane’s angle). a Sagittal fast spin-echo STIR image (4,000/84/170) and b sagittal T1-weighted image (330/14) show necrosis-like changes (arrowhead) in the calcaneus with a signal intensity of 4
Table 1 Prevalence, size, and signal intensity of bone marrow changes in 78 asymptomatic hindfeet and midfeet Pattern of bone marrow abnormalitya
Prevalence n (%) Diameter in mmb Area in mm2b Signal intensityb, c
Long Short
Type 1 28 (36%) 7.5 (4–16) 5.5 (3–12) 34 (9–151) 3.0 (1–7)
Type 2 20 (26%) 6.0 (4–9) 4.5 (3–9) 24 (12–64) 5.0 (2–9)
Type 3 4 (5%) 5.5 (4–7) 5.0 (3–7) 22 (9–38) 8.5 (8–10)
a
Type 1: ill-defined edema-like bone marrow changes; Type 2: well-defined necrosis-like changes; Type 3: cystic changes
b
The median, and range (in parentheses) of the long and short diameters of bone marrow changes, area, and signal intensity
c
marrow changes resembled signal abnormalities shown in runners after exercise, representing possibly transient and physiological reactions to stress [17, 18]. Our findings were also similar to signal changes described in asymp-tomatic children, where such changes are considered to represent hematopoetic marrow [19]. The small and subtle edema-like changes seen in the current study should not be difficult to differentiate from clinically relevant lesions, including malignancy [10].
In our study, the types of abnormality were age-dependent. Young volunteers predominantly had edema-like Type 1 changes, and elderly volunteers had all types of changes, including cysts which were not seen before age 50. One explanation for the Type 1 bone marrow changes in young people may be their comparatively high physical activity, resulting in increased mechanical stress reactions. Reconversion or persistence of hematopoietic bone mar-row changes is another possible explanation for this finding in our youngest decade. Although by the age of 5 years bone marrow conversion of hematopoetic marrow to fatty marrow is nearly complete in the foot and ankle [20], isolated islands of red marrow may persist up to the age of young adults [19,21].
Five of 15 bone marrow changes of the calcaneus (33%) were located at the calcaneal attachment of the cervical and interosseous ligaments. Such changes have been recently attributed to prominent vascular remnants [22]. Histolog-ical examination of four cadaveric specimens within the calcaneus near the insertion of the cervical and interosseous ligaments revealed thinned cortical bone surrounded by fatty marrow and numerous dilated vascular channels [22].
not have surgical or histological correlation for our bone marrow changes. This is the drawback of any imaging study investigating asymptomatic persons. The few pre-viously published studies [16, 23] where histological correlation was available for edema-like and necrosis-like bone marrow abnormalities have shown rather unspecific histological findings. A mixture of histological abnormal-ities was consistently seen in such areas [16, 23]. A previously published study addressing bone marrow changes in the knee [16] has shown that bone marrow fibrosis and necrosis is a major component in edema-like bone abnormalities. In so-called necrosis-like zones and in cysts the amount bone marrow necrosis and fibrosis is quantitatively more extensive but qualitatively not sub-stantially different than in the edema-like zones [16]. For the present study, we assume that our three different imaging patterns would show “overlapping” histological findings. However, not only histological findings of edema-like, necrosis-like, and cystic changes may overlap. In patients with symptomatic osteoarthritis of the knee, Carrino et al. [15] demonstrated recently “overlapping” imaging findings with subchondral cysts developing in pre-existing regions with subchondral bone marrow edema-like signal. Therefore, it is evident that the differentiation of our three bone marrow patterns (edema-like, necrosis-like, and cyst-like) is somewhat arbitrary.
In conclusion, bone marrow changes on STIR MR images are commonly detected in asymptomatic feet and ankles. They tend to be small (<1 cm) or subtle and should not lead to further diagnostic work-up or treatment without any additional abnormalities.
References
1. Erdem CZ, Sarikaya S, Erdem LO, Ozdolap S, Gundogdu S (2005) MR imaging features of foot involvement in ankylosing spondylitis. Eur J Radiol 53:110–119
2. Gigena LM, Chung CB, Lektrakul N, Pfirrmann CW, Sung MS, Resnick D (2002) Transient bone marrow edema of the talus: MR imaging findings in five patients. Skeletal Radiol 31:202–207
3. James SL, Hughes RJ, Ali KE, Saifuddin A (2006) MRI of bone marrow oedema associated with focal bone lesions. Clin Radiol 61: 1003–1009
4. Ledermann HP, Morrison WB, Schweitzer ME (2002) MR image analysis of pedal osteomyelitis: distribution, patterns of spread, and frequency of associated ulceration and septic arthritis. Radiology 223:747–755 5. Newman JS, Newberg AH (2000)
Congenital tarsal coalition: multimo-dality evaluation with emphasis on CT and MR imaging. Radiographics 20:321–332; quiz 526–327, 532 6. O’Donnell P, Saifuddin A (2005)
Cuboid oedema due to peroneus longus tendinopathy: a report of four cases. Skeletal Radiol 34:381–388 7. Trappeniers L, De Maeseneer M,
De Ridder F et al (2003) Can bone marrow edema be seen on STIR images of the ankle and foot after 1 week of running? Eur J Radiol 47:25–28 8. Weishaupt D, Schweitzer ME (2002)
MR imaging of the foot and ankle: patterns of bone marrow signal abnormalities. Eur Radiol 12:416–426
9. Weishaupt D, Schweitzer ME, Alam F, Karasick D, Wapner K (1999) MR imaging of inflammatory joint diseases of the foot and ankle. Skeletal Radiol 28:663–669
10. Zanetti M, De Simoni C, Wetz H, Zollinger H, Hodler J (1997) Magnetic resonance imaging of injuries to the ankle joint: can it predict clinical out-come? Skeletal Radiol 26:82–88 11. Miller TT, Staron RB, Feldman F,
Parisien M, Glucksman WJ, Gandolfo LH (1995) The symptomatic accessory tarsal navicular bone: assessment with MR imaging. Radiology 195:849–853
12. Morrison WB, Carrino JA, Schweitzer ME, Sanders TG, Raiken DP, Johnson CE (2001) Subtendinous bone marrow edema patterns on MR images of the ankle: association with symp-toms and tendinopathy. AJR Am J Roentgenol 176:1149–1154 13. Zanetti M, Steiner CL, Seifert B,
Hodler J (2002) Clinical outcome of edema-like bone marrow abnormalities of the foot. Radiology 222:184–188 14. Lohman M, Kivisaari A, Vehmas T, Kallio P, Malmivaara A, Kivisaari L (2001) MRI abnormalities of foot and ankle in asymptomatic, physically active individuals. Skeletal Radiol 30:61–66
15. Carrino JA, Blum J, Parellada JA, Schweitzer ME, Morrison WB (2006) MRI of bone marrow edema-like signal in the pathogenesis of subchondral cysts. Osteoarthritis Cartilage 14: 1081–1085
16. Zanetti M, Bruder E, Romero J, Hodler J (2000) Bone marrow edema pattern in osteoarthritic knees: correlation between MR imaging and histologic findings. Radiology 215:835–840 17. Lazzarini KM, Troiano RN, Smith RC
(1997) Can running cause the appear-ance of marrow edema on MR images of the foot and ankle? Radiology 202:540–542
18. Schueller-Weidekamm C, Schueller G, Uffmann M, Bader TR (2006) Does marathon running cause acute lesions of the knee? Evaluation with magnetic resonance imaging. Eur Radiol 16:2179–2185
19. Shabshin N, Schweitzer ME, Morrison WB, Carrino JA, Keller MS, Grissom LE (2006) High-signal T2 changes of the bone marrow of the foot and ankle in children: red marrow or traumatic changes? Pediatr Radiol 36:670–676
20. Steiner RM, Mitchell DG, Rao VM, Schweitzer ME (1993) Magnetic resonance imaging of diffuse bone marrow disease. Radiol Clin North Am 31:383–409
21. Pal CR, Tasker AD, Ostlere SJ, Watson MS (1999) Heterogeneous signal in bone marrow on MRI of children’s feet: a normal finding? Skeletal Radiol 28:274–278
22. Fleming JL 2nd, Dodd L, Helms CA (2005) Prominent vascular remnants in the calcaneus simulating a lesion on MRI of the ankle: findings in 67 patients with cadaveric correlation. AJR Am J Roentgenol 185:1449–1452 23. Reinus WR, Fischer KC, Ritter JH
(1994) Painful transient tibial edema. Radiology 192:195–199