Changes in milk L-lactate, lactate dehydrogenase, serum albumin,
and IgG during milk ejection and their association with somatic
cell count
Mirjam Lehmann†, Samantha K Wall†, Olga Wellnitz and Rupert M Bruckmaier*
Veterinary Physiology, Vetsuisse Faculty University of Bern, Bremgartenstrasse 109a, CH-3001 Bern, Switzerland Received 8 May 2014; accepted for publication 24 October 2014; first published online 3 December 2014In both conventional and automatic milking systems (AMS), sensitive and reliable mastitis detection is important for profitable milk production. Mastitis detection parameters must be able to detect mastitis when the somatic cell count (SCC) is only slightly elevated. Owing to the pre-milking teat cleaning process in AMS, sampling cannot take place before the occurrence of alveolar milk ejection and importantly, this can affect the ability of parameters to detect mastitis. The aim of the present study was to examine the effect of alveolar milk ejection onL-lactate, lactate dehydrogenase (LDH), serum albumin (SA) and immunoglobulin G (IgG) compared with SCC, a commonly used indicator of mastitis. In this experiment, milk samples were collected every 20 s from one quarter during a 120-s manual teat stimulation in ten cows. Samples were analysed for SCC,L-lactate, LDH, SA and IgG. Quarters were grouped by low (< 5·0 log10 cells/ml), mid (5·0–5·7 log10 cells/ml), and high (> 5·7 log10 cells/ml) SCC using the sample at t = 0 s. NeitherL-lactate nor LDH could statistically differentiate between low and mid-SCC quarters, but there were a significant difference in levels between the high-SCC quarters and low and mid-SCC quarters. SA could not differentiate between the low and mid-SCC quarters, but the SA levels for the high SCC quarters remained statistically different compared with low and mid-SCC quarters throughout the experiment. IgG could statistically differentiate between low and mid-SCC, although the high-SCC quarters were not statistically different from the mid-SCC quarters after 60 s. In the high-SCC quarters, a decrease was shown in all parameters during milk ejection, after t = 60 s. In conclusion, alveolar milk ejection reduces the effectiveness of detection parameters when compared with SCC. With the exception of IgG, the ability of other tested parameters was not satisfactory to differentiate between quarters with low to mid-SCC levels
Keywords: Mastitis indicator,L-lactate, LDH, SA, IgG, alveolar milk ejection.
Early detection of mastitis is essential to allow for separation of milk from infected quarters, to improve the cure rate of mastitis treatment, and to minimise economic losses (Milner et al. 1997). In conventional milking systems, clinical mastitis cases can be detected by the milker via milk clots in foremilk, signs of udder inflammation, and increased somatic cell count (SCC). Cows with subclinical mastitis can exhibit an elevated SCC, but may not be detected by the milker owing to lack of clinical symptoms mentioned above. Nonetheless, both types of mastitis can be detected by the California Mastitis Test (Schalm &
Noorlander, 1957). In conventional systems, milkers can also obtain strict foremilk samples (i.e. before alveolar milk ejection) but in automatic milking systems (AMS) this is not possible owing to teat cleaning and cup placement. The effects of alveolar milk ejection are particularly important in evaluating mastitis indicators in AMS because udder health is controlled without interference by the milker. Parameters must be reliable enough to detect not only clinical mastitis where there is a substantial increase in SCC, but also subclinical mastitis when SCC is slightly elevated. It is, therefore, important to test parameters against varying SCC levels to determine whether these detection parameters can be useful in AMS. Currently, automatic measurement of electrical conductivity, milk colour, milk temperature, milk yield, or a multi-variate approach of several parameters are often used for monitoring udder health in AMS (Hovinen &
†Authors contributed equally to this work.
*For correspondence; e-mail: [email protected]. ch
Pyörälä, 2010). However, the use of some of these parameters including electrical conductivity and milk colour are insufficient, (Biggadike et al.2002; Hovinen et al.2006) and various other novel parameters have been tested.
The concentration of a number of milk constituents differs between milk fractions. In particular, milk composition in dairy cows differs between cisternal and alveolar milk (Ontsouka et al.2003; Bruckmaier et al.2004). The cisternal milk is immediately available for milk removal, whereas the alveolar milk fraction is only available in response to the release of oxytocin, i.e. after the occurrence of alveolar milk ejection (Bruckmaier & Blum,1998). The time between the first contact with the udder and the start of milk ejection is reported to be 50–100 s as a function of the degree of udder filling (Bruckmaier & Hilger,2001). The decline of physicochemical mastitis indicators such as electrical conductivity and milk electrolytes during alveolar milk ejection, concomitantly with a reduced difference of these parameters and loss of statistical significance between groups has been shown before (Bruckmaier et al. 2004). This is also true for SCC to a lesser extent (Sarikaya & Bruckmaier,2006) probably because an elevation of SCC follows more of an exponential than a linear curve. There-fore, an elevation of SCC still remains visible even if diluted with milk that has a low cell content.
Only a few reports are available on the potential mastitis indicatorL-lactate (hereafter referred to as lactate) in the milk of dairy cows. Lactate is the conjugate base of lactic acid and its concentration in raw milk is approximately 0·1 mmol/l (Morr et al.1957). Davis et al. (2004) found an increase in milk lactate concentration in the foremilk of dairy cows during mastitis and concluded that milk lactate can serve as an indicator of clinical and subclinical mastitis.
Lactate dehydrogenase (LDH) has repeatedly been dis-cussed as another indicator of mastitis (Chagunda et al.
2006; Hiss et al.2007). The origin of LDH in milk is often attributed to leucocytes (Kato et al. 1989) and mammary epithelial cells (Bogin et al.1977). During mastitis, the blood milk barrier is compromised and becomes leaky. This allows for paracellular transport of blood components into the milk and vice versa. Symons & Wright (1974) discussed that LDH originates from the blood and is an indicator of increasing permeability of the blood milk barrier. This hypothesis was confirmed in our recent study (Lehmann et al.2013).
Two other components that can be used as indicators of blood milk barrier permeability and mastitis are serum albumin (SA) and immunoglobulin G (IgG). SA is a ubiquitous blood constituent that increases in milk when the blood milk barrier is compromised (Stelwagen et al.
1994). During an infection, IgG2 is the most important immunoglobulin in bovine milk and it plays an important role in udder defence against mastitis (Burton & Erksine,
2003). During an immune response to mastitis, there is an increase in IgG in the milk due to passive transfer through the leaky blood milk barrier.
The objective of the present study was to evaluate milk lactate, LDH activity, SA and IgG concentrations compared
with low, mid, and high-SCC levels. Special emphasis was put on the influence of alveolar milk ejection on these parameters for the possible application in AMS, since teat cleaning in AMS induces milk ejection before foremilk can be sampled (Dzidic et al.2004a,b).
Materials and methods
Animals and milking management
Ten Holstein cows with a daily milk yield of 32·3 ± 1·9 kg were used. They were kept in free stall housing and were milked in a milking parlour at 5·00 and 16·00. Cows were 65–199 d in milk and in their first to sixth lactation. Experimental design
Repeated milk sampling was carried out during pre-stimulation in ten cows. The manual pre-stimulation time was 120 s and included all teats. Milk samples (*6 ml) were collected from the start until the end of stimulation from one single quarter at 20-s intervals, while the other quarters were continuously stimulated. Therefore, seven consecutive milk samples were taken. The udder was not touched before the start of sampling and stimulation. The procedure was repeated at four milkings per cow and every quarter was sampled only once. Four quarters were excluded from the experiment, thus 36 quarters were used.
Sample analysis
Milk SCC was determined immediately after sampling by using a DeLaval cell counter, and samples were frozen
at 20 °C for further analyses. Lactate concentrations
were measured enzymically in raw milk using a prototype of Lact-Sens-PoC (Foerster-Technik GmbH, Gerwigstrasse 25, D-78234, Engen, Germany). The coefficient of variation of this method was 6·2% and the minimum detectable concentration was 0·01 mmol/l. To validate the measuring technique, lactate values in milk, measured by Lact-Sens-PoC, were compared with lactate values measured in milk serum (milk serum was isolated by a two-step centrifugation procedure at 4000 g for 15 min and at 14 000 g for 30 min) using the test kit Lactate PAP (bioMérieux, Marcy l`Etoile, F-69280, France) and an automated analyser (COBAS MIRA, Roche Diagnostics, Grenzacherstrasse 124, CH-4070, Basel, Switzerland). LDH activity was measured in milk serum (prepared as described above) using the test kit LDH IFCC (Axon Lab AG, Täferstrasse 15, CH-5405, Baden, Switzerland) and an automated analyser (COBAS MIRA, Roche Diagnostics, Grenzacherstrasse 124, CH-4070, Basel, Switzerland) according to manufacturer’s instructions. Minimum detectable activity was 5 U/l.
SA and total IgG were measured in milk serum by ELISA using a commercial kit (Bethyl Laboratories, Montgomery TX, USA) according to the manufacturer’s instructions. A slight modification of the protocol was used for IgG as samples were blocked in 5% fish skin gelatin (Sigma-Aldrich,
St. Louis MO, USA) diluted in double-distilled water. Samples were diluted in wash buffer (50 mM-Tris, 0·14 m-NaCl, 0·05% Tween 20, adjusted to pH 8·0) to ensure the samples were within the range of the standards. Absorbance measurements were read on the Synergy Mx plate reader (Bio Tec Instruments, Winooski VT, USA). The inter and intra assay coefficients of variation were *4 and *5% for SA and *3 and *8% for IgG. The minimum detectable concentration was 6·25 ng/ml for SA and 9·375 ng/ml for IgG.
Statistical analysis
Results are presented as means ±SEM. SCC is presented and statistically evaluated at a logarithmic scale (log10) to ensure normal distribution. Results were tested for signifi-cance (P < 0·05) using the repeated measures analysis of the MIXED procedure of SAS (SAS Institute Inc., 2002–2008, Release 9.2 Cary NC, USA). For this experiment, quarters were classified based on the SCC of the first sample obtained at t = 0 s. Three groups were used: SCC < 5·0 log10cells/ml (SCC I), 5·0–5·7 log10cells/ml (SCC II) and > 5·7 log10cells/ml (SCC III). The model included the SCC group and the time of sampling as fixed effects and the animal was considered as a repeated factor. Lactate, LDH, IgG, and SA were the dependent variables.
Results
Somatic cell count
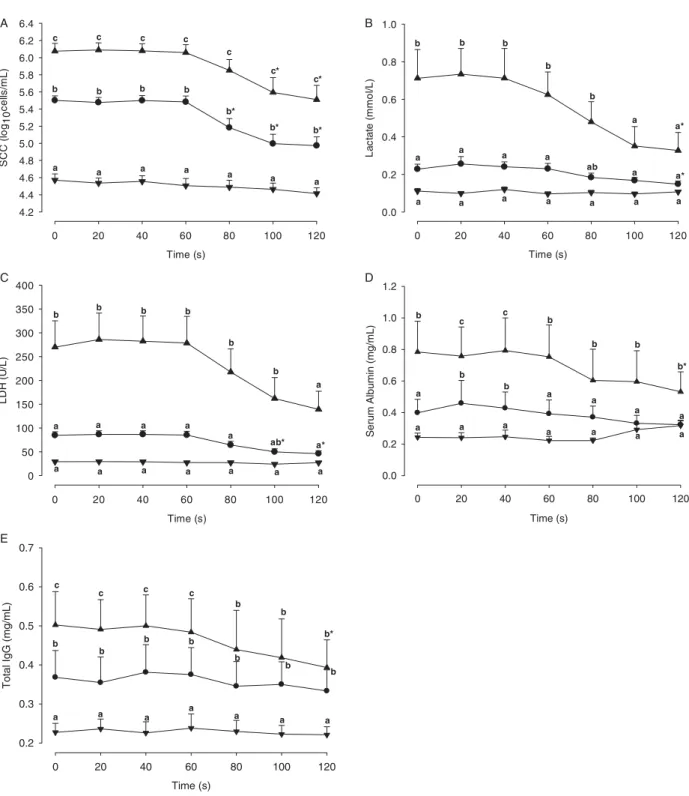
Results are presented as means ±SEM. In the first sample (t = 0 s), mean SCC was 4·57 ± 0·07, 5·50 ± 0·05, and 6·08 ± 0·09 log10cells/ml in SCC I (n = 14 samples), SCC II (n = 12 samples), and SCC III (n = 10 samples), respectively. SCC decreased within 120 s and was significantly lower at 80, 100 and 120 s than at the start of sampling (t = 0 s) in SCC II quarters and at 100 and 120 s in SCC III quarters. SCC group differences between SCC I, SCC II and SCC III quarters remained significant throughout the entire 120-s sampling period (Fig. 1a).
Lactate
From 0 to 60 s and from 0 to 80 s, the lactate concentration in SCC III quarters was significantly higher than in SCC II and SCC I quarters, respectively. Lactate concentrations did not differ significantly between SCC I and SCC II quarters at any time-point. A decrease of lactate occurred between 40 and 100 s of sampling in both the SCC II and SCC III quarters. In SCC III and SCC II quarters, lactate was significantly lower at t= 120 s than at t = 0 s. The difference of lactate concentra-tions between SCC III and SCC I quarters were no longer significant from t = 100 s, i.e. lactate concentrations were similar in SCC III, SCC II and SCC I quarters 100 s after the start of sampling (Fig. 1b).
Lactate dehydrogenase activity
LDH activity in SCC III quarters was significantly higher than in SCC II and SCC I quarters from 0 to 80 s and from 0 to 100 s, respectively. LDH activity did not differ signifi-cantly between SCC I and SCC II quarters during the entire sampling period. Between 60 and 100 s a decrease of LDH activity in SCC II and SCC III quarters was detected. In SCC II quarters, LDH activity was significantly lower at 100 and 120 s than at t = 0 s. The difference of LDH activity between SCC III and SCC I quarters was no longer significant from t= 120 s, i.e. 120 s after the start of sampling LDH activity was similar in SCC III, SCC II and SCC I quarters (Fig. 1c). Serum albumin
SA concentration was significantly higher in the SCC III quarters than in the SCC I and SCC II quarters throughout the entire sampling period. SA concentration was higher in the SCC II quarters compared with the SCC I quarters only at 20 and 40 s. In SCC III quarters, SA concentration was significantly lower at 120 s than t = 0 s. There were no significant decreases in SA concentration in the SCC I and SCC II quarters (Fig. 1d).
Immunoglobulin G
Total IgG concentration was significantly higher in SCC II quarters than in SCC I quarters throughout the entire sampling. SCC III quarters were significantly higher than SCC I throughout the experiment, but only significantly higher than SCC II quarters from t = 0 to t = 60 s. There was a significant decrease in IgG concentration at t = 120 s compared with t = 0 s in SCC III quarters. There were no significant decreases in IgG concentration in both the SCC I and SCC II quarters throughout the experiment (Fig. 1e). Discussion
The most widely accepted indicator of mammary inflam-mation is the SCC (Harmon,1994), although recommended SCC thresholds are different among authors. According to Hillerton (1999), a SCC threshold of 100 000 cells/ml was used to define mastitis, i.e. a quarter was classified as healthy when the milk SCC was < 100 000 cells/ml, whereas an unhealthy quarter was defined when the milk SCC was > 100 000 cells/ml. In addition, two less rigid definitions of mastitis with SCC thresholds of 200 000 and 500 000 cells/ml have been considered (IDF,1971; Smith,1996). For adequate mastitis detection in AMS, mastitis indicators should be highly effective at SCC levels around 100 000 cells/ml. For the purpose of this study, samples were grouped into SCC I (SCC < 5·0 log10cells/ml), SCC II (SCC 5·0–5·7 log10cells/ml) and SCC III (SCC > 5·7 log10cells/ml).
In the present study, IgG concentration could successfully differentiate between the SCC I and SCC II quarters and also between SCC II and SCC III until t = 60 s. The reason why this
specific parameter can detect a slightly elevated SCC throughout the 120-s sampling period is unknown, although it is important to note that IgG is the only studied parameter with a known immune function. Specifically, IgG2 is the major opsonisation protein for neutrophil phagocytosis
in the udder. As previously stated, during mastitis the blood milk barrier loses integrity and becomes open allowing IgG to enter the milk (Burton & Erksine, 2003). Since IgG can detect slightly elevated SCC before and after milk ejection, which is essential for its use in AMS, it could Time (s) 0 20 40 60 80 100 120 SCC ( lo g10 c e lls /m L ) 4.2 4.4 4.6 4.8 5.0 5.2 5.4 5.6 5.8 6.0 6.2 6.4 c c c c c c* c* b b b b b* b* b* a a a a a a a Time (s) 0 20 40 60 80 100 120 La ct a te ( m m o l/ L) 0.0 0.2 0.4 0.6 0.8 1.0 b b b b b a a* a a a a ab a a* a a a a a a a 0 20 40 60 80 100 120 S e rum A lbumin (mg/mL) 0.0 0.2 0.4 0.6 0.8 1.0 1.2 a a a a a a a a b* a b a b c b c b b a b a Time (s) Time (s) 0 20 40 60 80 100 120 Tota l Ig G ( m g/mL) 0.2 0.3 0.4 0.5 0.6 0.7 a a a a a a a b b b b b b b c c c c b b b* Time (s) 0 20 40 60 80 100 120 LD H ( U /L ) 0 50 100 150 200 250 300 350 400 a a a a a a a a a a a a ab* a* b b b b b b a A B C E D
Fig. 1. SCC (a), lactate (b), LDH (c), SA (d), and IgG (e) in the different milk fractions, 0–120 s after the first touch of the udder and start of stimulation; results are presented as means ±SEM; data are clustered according to the SCC of the first sample (t = 0 s),▼< 5·0 log10cells/ml (SCC I),●5·0–5·7 log10cells/ml (SCC II),▲> 5·7 log10cells/ml (SCC III); n = 10 cows; four milkings/cow; a, b, c: means with different letters indicate differences between clusters within time points (P < 0·05); * indicates a significant (P < 0·05) difference compared with the sample t= 0 s.
be suitable for use as a mastitis indicator. More studies of this nature either with manual stimulation or sampling in AMS are needed to examine the use of IgG.
Lactate and LDH activity could not significantly differen-tiate between low SCC (SCC I) and slightly increased SCC (SCC II). This is indicative that neither lactate nor LDH would be suitable to identify mastitis with a slightly elevated SCC in conventional or AMS systems, even before alveolar milk ejection. Both of these parameters could identify the high-SCC quarters (when high-SCC is5500000 cells/ml), until t=100 s for lactate and t = 120 s for LDH. It is possible that these parameters could distinguish a quarter with substantially elevated SCC in AMS.
SA is a ubiquitous blood protein that could be used as an indirect mastitis indicator, although this parameter has not yet been studied in AMS. SA concentration could not be used to distinguish between SCC I and SCC II (with the only statistically significant differences at t = 20 and 40 s) after milk ejection, although it could differentiate high-SCC quarters at all time-points. This again demonstrates that this parameter could be used to detect quarters with high SCC, but not in quarters that are only slightly elevated.
SCC, LDH activity, and concentrations of lactate, SA and IgG decreased during the sampling period but they did not change before 60 s after the start of udder stimulation. In a similar experiment by Bruckmaier et al. (2004), a decrease of the electrical conductivity after 60 s was shown when different parameters were measured. It is clear that the continuous teat stimulation induced alveolar milk ejection after approximately 60 s, and caused a mixture of alveolar and cisternal milk. This fact needs to be considered in the case of foremilk sampling for measurements, i.e. foremilk can only be expected to be cisternal milk until about 40 s from the first contact with the udder (Bruckmaier & Hilger,
2001).
The reason for higher SCC, lactate, SA, IgG and LDH concentrations in cisternal milk compared with alveolar milk is still not known. It is possible that the blood milk barrier is regulated differently in the teat end compared with the rest of the mammary gland. Nickerson & Pankey (1983) suggested that cells are recruited in the Furstenberg’s rosette area to serve as protection against invading pathogens. It is also possible that during milk let-down, the composition of milk changes while travelling through the milk ducts reducing the concentration of SA, IgG, lactate and LDH in alveolar milk.
In conclusion, IgG could detect a slightly elevated SCC both before and after alveolar milk ejection whereas the ability of lactate, LDH and SA in detecting quarters with only a slightly increased SCC was not satisfactory even in milk samples of the cisternal fraction. LDH activity and the concentration of lactate and SA are usable parameters in detecting only quarters with high SCC in strict foremilk samples; however in AMS it seems to be almost impossible to collect milk samples before the occurrence of alveolar milk ejection. More studies need to be conducted to examine the use of these parameters in AMS.
We would like to thank Foerster-Technik, Engen, Germany for providing the device to measure lactate, and especially Mr Thomas Foerster and Mr Markus Huetter for their scientific input. The technical assistance of Mme Yolande Zbinden, Veterinary Physiology, is gratefully acknowledged.
References
Biggadike HJ, Ohnstad I, Laven RA & Hillerton JE 2002 Evaluation of measurements of the conductivity of quarter milk samples for the early diagnosis of mastitis. Veterinary Record 150 655–658
Bogin E, Ziv G, Avidar J, Rivertz B, Gordin S & Saran A 1977 Distribution of lactate dehydrogenase isoenzymes in normal and inflamed bovine udders and milk. Research in Veterinary Science 22 198–200 Bruckmaier RM & Blum JW 1998 Oxytocin release and milk removal in
ruminants. Journal of Dairy Science 81 939–949
Bruckmaier RM & Hilger M 2001 Milk ejection in dairy cows at different degrees of udder filling. Journal of Dairy Research 68 369–376 Bruckmaier RM, Weiss D, Wiedemann M, Schmitz S & Wendl G
2004 Changes of physicochemical indicators during mastitis and the effects of milk ejection on their sensitivity. Journal of Dairy Research 71 316–321
Burton JL & Erksine RJ 2003 Immunity and mastitis. Some new ideas for an old disease. Veterinary Clinics of North America Food Animal Practice 19 1–45
Chagunda MGG, Larsen T, Bjerring M & Ingvartsen KL 2006 L-lactate dehydrogenase and N-acetyl-beta D-glucosaminidase activities in bovine milk as indicators of non-specific mastitis. Journal of Dairy Research73 431–440
Davis SR, Farr VC, Prosser CG, Nicholas GD, Turner S, Lee J & Hart AL 2004 Milk L-lactate concentration is increased during mastitis. Journal of Dairy Research71 175–181
Dzidic A, Macuhova J & Bruckmaier RM 2004a Effects of cleaning duration and water temperature on oxytocin release and milk removal in an automatic milking system. Journal of Dairy Science 87 4163–4169 Dzidic A, Weiss D & Bruckmaier RM 2004b Oxytocin release, milk ejection
and milking characteristics in a single stall automatic milking system. Livestock Production Science86 61–68
Harmon RJ 1994 Physiology of mastitis and factors affecting somatic cell counts. Journal of Dairy Science 77 2103–2112
Hillerton JE 1999 Redefining mastitis based on somatic cell count. IDF Bulletin345 4–6
Hiss S, Mueller U, Neu-Zahren A & Sauerwein H 2007 Haptoglobin and lactate dehydrogenase measurements in milk for the identification of subclinically diseased udder quarters. Veterinary Medicine-Czech 52 245–252
Hovinen M & Pyörälä S 2010 Invited review: udder health of dairy cows in automatic milking. Journal of Dairy Science 94 547–562
Hovinen M, Aisla A-M & Pyörälä S 2006 Accuracy and reliability of mastitis detection with electrical conductivity and milk colour measurement in automatic milking. Acta Agriculturae Scandinavica, Section A 56 121–127
IDF 1971 A monograph on bovine mastitis. International Dairy Federation Bull. Standard No. 60. Brussels, Belgium
Kato K, Mori K & Katoh N 1989 Contribution of leukocytes to the origin of lactate dehydrogenase isozymes in milk of bovine mastitis. Journal of Veterinary Medical Science-Japan51 530–539
Lehmann M, Wellnitz O & Bruckmaier RM 2013 Concomitant lipopoly-saccarhide-induced transfer of blood-derived components including immunoglobulins into milk. Journal of Dairy Science 96 889–896 Milner P, Page KL & Hillerton JE 1997 The effects of early antibiotic
treatment following diagnosis of mastitis detected by a change in the electrical conductivity of milk. Journal of Dairy Science 80 859–863 Morr CV, Harper WJ & Gould IA 1957 Some organic acids in raw and heated
skim milk. Journal of Dairy Science 40 964–972
Nickerson SC & Pankey JW 1983 Cytologic observations of the bovine teat end. American Journal of Veterinary Research 44 1433–1441
Ontsouka CE, Bruckmaier RM & Blum JW 2003 Fractionized milk composition during removal of colostrum and mature milk. Journal of Dairy Science86 2005–2011
Sarikaya H & Bruckmaier RM 2006 Importance of the sampled milk fraction for the prediction of total quarter somatic cell count. Journal of Dairy Science86 4246–4250
Schalm OW & Noorlander DO 1957 Experiments and observations leading to the development of the California mastitis test. Journal of the American Veterinary Medical Association130 199–204
Smith KL 1996 Standards for somatic cells in milk: physiological and regulatory. In IDF Mastitis Newsletter 144/21:7–9
Stelwagen K, Politis I, White JH, Zavizion B, Prosser CG, Davis SR & Farr VC 1994 Effect of milking frequency and somatotropin on the activity of plasminogen activator, plasminogen, and plasma in bovine milk. Journal of Dairy Science77 3577–3583
Symons DBA & Wright LJ 1974 Changes in bovine mammary gland permeability after intramammary exotoxin infusion. Journal of Comparative Pathology84 9–17