Localization of 102 exons to a 2.5 Mb region involved
in Down syndrome
D.Lucente, H.M.Chen1, D.Shea, S.N.Samec1, M.Rutter, R.Chrast1, C.Rossier1, A.Buckler, S.E.Antonarakis1 and M.K.McCormick*
Molecular Neurogenetics Unit, Department of Neurology, Massachusetts General Hospital and Harvard Medical School, Charlestown, MA 02140, USA and 1Genes 'R' Us Laboratory of Human Molecular Genetics, Department of Genetics and Microbiology, University of Geneva
Medical School and Division of Medical Genetics, University Cantonal Hospital of Geneva, Switzerland Received April 10, 1995; Revised and Accepted June 19, 1995
Exon amplification has been applied to a 2.5 Mb
region of chromosome 21 that has been associated
with some features of Down syndrome (DS).
Identi-fication of the majority of genes from this region will
facilitate the correlation of the over-expression of
particular genes with specific phenotypes of DS. Over
100 gene fragments have been isolated from this 2.5
Mb segment. The exons have been characterized by
sequence analysis, comparison with public
data-bases and expansion to cDNA clones. Localization
of the exons to chromosome 21 has been determined
by hybridization to genomic Southern blots and to
YAC and cosmid clones representing the region. This
has resulted in a higher resolution physical map with
a marker approximately every 25 kb. This integrated
physical and transcript map will be valuable for fine
mapping of DNA from individuals with partial
aneu-ploidy of chromosome 21 as well as for assessing
and ultimately generating a complete gene map of
this segment of the genome.
INTRODUCTION
Since the association of Down syndrome (DS) with trisomy
for human chromosome 21 (1,2), the study of this common
birth defect has progressed from cytogenetic analyses of patient
chromosomes (3) through the molecular characterization of
gene and sequence dosage in individuals with partial trisomy
21 (4-9). The resulting genotype-phenotype correlations that
have emerged define subregions of the chromosome that likely
contain genes contributing to specific features of DS (5,10).
The current correlation of DS phenotypes with sub-regions
of chromosome 21 has relied primarily on the analyses of
sequence copy number in individuals with partial trisomy 21.
In one model, the genotype-phenotype definitions are based
on the smallest region of overlap (SRO) present in triplicate
in different individuals with partial trisomy 21 (5). The features
of the syndrome present in common in these individuals are
assigned to genes in the SRO. In an alternative model, if
more than one gene on chromosome 21 contributes to a DS
phenotype, then the minimal molecular overlap in the DS
individuals exhibiting the phenotype may erroneously identify
the region believed to contain the gene(s) (10). Those features
of DS that are likely to be influenced by more than one gene
on chromosome 21 are identified by comparing the penetrance
and expressivity of the trait in the DS and the unaffected
populations. In both models, the region around locus D21S55,
which is between loci CBR and ERG, is almost always
implicated in contributing to DS phenotypes and has only been
excluded from contributing to one phenotype (10). Therefore,
we have chosen to concentrate our initial gene isolation efforts
on this interval, while also recognizing that additional regions
of chromosome 21 likely contain genes of significance to DS.
Although defining these regions is a complex issue, an obvious
next step toward eventual understanding of the etiology of DS
is to begin isolating the genes from these segments of the
chromosome. It is precisely because of this complexity, and
the number of genes that may have to be isolated and
characterized, that DS is an excellent choice for the application
of large scale, comprehensive gene isolation efforts.
Many techniques exist for isolating expressed sequences,
including utilizing CpG islands or evolutionary sequence
conservation as indicators of the presence of genes,
hybridiza-tion of genomic fragments to cDNA libraries, direct cDNA
selection and exon amplification. The last two methods are
most amenable to gene isolation from megabase genomic
regions. The successful application of direct cDNA selection
for identifying genes from chromosome 21 has recently been
reported (11-13). We have utilized exon amplification to isolate
over 100 gene fragments from a 2.5 Mb region of chromosome
21 between loci CBR and ERG, which is present in three
copies in common in many DS individuals with partial trisomy
21 (4,5,7,10). Localization of these gene fragments to a
physical map of the region has imparted higher resolution
to the physical map and contributes to integration with a
transcript map.
RESULTS
Exon isolation and integration with the physical map
A group of 12 YAC clones previously localized in the -2.5
Mb distance between loci CBR and ERG was used to identify
394 corresponding cosmids from a flow sorted chromosome 21
cosmid library, LL21NC02, constructed at Lawrence Livermore
National Laboratory (Fig. 1). Sixteen markers previously
localized to this genomic segment were assayed in this subset
of cosmids. Markers that were not represented in this subset
were used to identify additional clones from the cosmid library
by PCR. Gene fragments were then isolated from pools of
these cosmids by the method of exon amplification (14).
Background was eliminated by hybridization of trapped
back-ground products to colony grids of all the trapped products.
Redundant exon clones relative to those exons in the first row
4
N
* '•
Figure 1. Identification of cosmid clones corresponding to YACs. Cosmid
colony grids of a portion of the chromosome 21 cosmid library are shown. They have been hybridized to pooled Alu-PCR products generated individually from four YACs. Positive clones were transferred to 96-well dishes and re-screened with each of the YAC Alu-PCR products individually. Cosmids that re-screened positive were pooled for subsequent isolation of exons.
of twelve were detected by hybridization of individual exons
to colony grids of all the exon clones resulting in 404
potentially unique gene fragments. Complete sequence has
been obtained for 115 exons and 102 exons have been localized
on the physical map.
The chromosome location of exons was confirmed in two
ways. Forty one exons were mapped to chromosome 21 by
hybridization to Southern blots containing genomic DNA from
human and rodent cell lines and somatic cell hybrids (Fig.
2A). A total of 102 exons, or 1 exon every -25 kb on average,
have been localized to the physical map of the 2.5 Mb between
CBR and ERG by hybridization to YAC and/or cosmid colony
grids (Fig. 2B). Overlapping clones will contain some exons
in common. Cosmid clones within and between cosmid bins
were assembled based on the presence or absence of the exons.
Hybridization of the exons to the cosmids resulted in organizing
276 cosmid clones into 34 contigs covering -2.2 Mb and
leaving -300 kb distributed in 33 gaps. This is an average gap
size of -10 kb, with a range from <10 kb to -100 kb. The
integrated exon, cosmid and YAC physical map is illustrated
in Figure 3. The cosmid clones associated with each contig
are listed in Table 1 and can also be obtained from the
anonymous ftp site at neuron.mgh.harvard.edu by logging in
as anonymous, giving your email as the password and 'cd' to
the directory /pub. The file is named dscosex. The ftp site may
also be accessed via a World Wide Web (WWW) browser
through our chromosome 9q34 Home Page at URL http://
neuron.mgh.harvard.edu:8000.
Comparison with other cosmid contigs
The cosmid contigs generated by exon content were
independ-ently identified and then compared to cosmid contigs, A
B
,1
• •
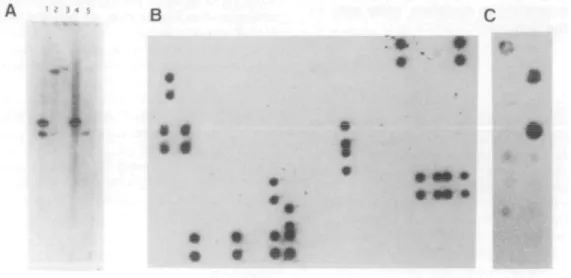
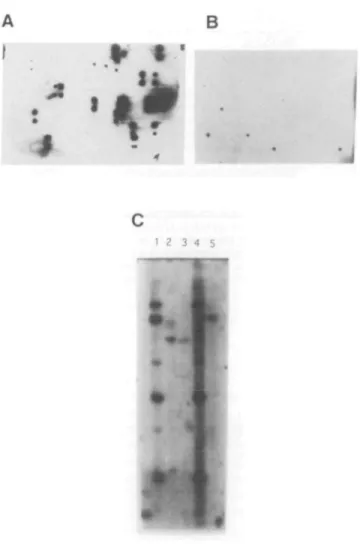
Figure 2. Localization of exons to chromosome 21. (A) Genomic Southern blot hybridized with exon 4E2. Digested genomic DNA, isolated from cell lines,
was separated on 1.0% agarose gels, transferred to nylon membranes and hybridized with gel purified exon clones following PCR amplification of the exon from the cloning vector with T3 and T7 primers. Lanes: I, mouse-human hybrid containing human chromosome 21; 2, hamster-mouse hybrid containing mouse chromosome 16; 3, hamster; 4, human; 5, mouse. The common band in lanes 1 and 4 indicate this exon localizes to chromosome 21. Similarly, a common band in lanes 2 and 5 indicate cross hybridization to mouse genomic DNA and localization to mouse chromosome 16. This sequence is also conserved in hamster genomic DNA as indicated by the bands in lanes 2 and 3. (B) Cosmid colony grid hybridized with exon 6E3. Colony grids of the 394 cosmids identified by hybridization with YAC Alu-PCR products were prepared using a Biomek 1000 robot. Clones were stamped in duplicate in a 4X2 array. Cosmids containing the exon are indicated by the duplicate signals. Exon 6E3 is present in 17 cosmids. (C) YAC colony grids hybridized with exon 6E3. Colony grids from a subset of YACs localized between CBR and ERG-2, made as described (26) are shown. Only those YACs used to identify cosmids are included in Figure 3. Column I. top to bottom, 751B9J50F7, A222A12, 259H11, C3C1, 413C1. 179B7; Column 2. top to bottom, 152F7. B139B9, 285E6. 336G 11,175G9. 549A9, 743A4. Exon 6E3 is present in YACs 751B9, B139B9 and 336GI1.
through Y, in this region described by Patil et al. (12). The
locations of those contigs relative to this map are shown in
Figure 3. In general, the majority of contigs are consistent
between the two maps. However, exon mapping has provided
evidence for clarifying some previously ambiguous contig
orders and connecting cosmid contigs. For example, previously
described and unordered contigs D and G are connected by
our bins 11 and 12, suggesting the order E-D-G when the STS
content of cosmids in E and G contigs are also considered.
Similarly, our bins 47-50 and 53 connect previously described
contigs L and N, and N and O, respectively. Finally, contigs
V and X are contiguous based on an exon (8B11) in common
between cosmid 23H5 (contig V) and 9C9 (contig X). The
order VX, as opposed to XV, is suggested based on the
presence of ERG exons in a larger contig containing VX and
the known orientation of the ERG gene (15). Some minor
discrepancies were also uncovered as a result of comparing
the two cosmid maps. For example, some cosmids were
described as disjoint (12) that we found to be overlapping
based on exon content, including cosmids 3E2 and 45A8;
19F7, 28B8 and 34H12; 56H1 and 41B8; 39D1 and 47D9;
56H1 and 39D1.
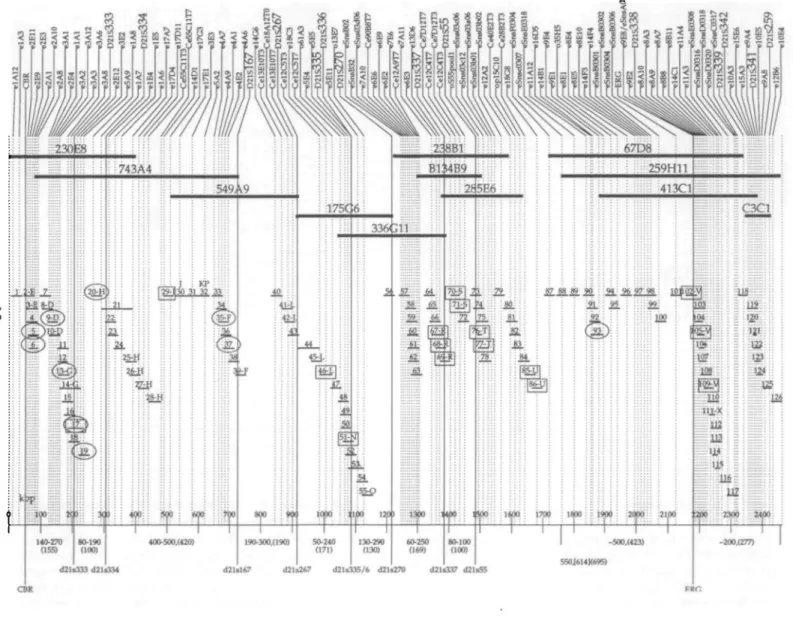
Figure 3. Integrated exon, cosmid and YAC map of the CBR-ERG region of chromosome 21. Markers are listed across the top of the figure. They are: exons
(beginning with 'e'), known genes (capitalized), cosmid end clones (beginning with 'Ce') and STS. Markers beginning with 'o' indicate detection of a cosmid clone by hybridization with a whole cosmid probe. There is a corresponding line from each marker through the YAC and/or cosmid clones containing it to the kilobase scale at the bottom of the figure. YACs are depicted below the markers by the bold, labeled lines. Cosmid bins are shown staggered and numbered 1-126 below the YACs. Bins consist of individual or multiple cosmids as detailed in Table 1. Individual cosmids are arranged as overlapping clones based primarily on exon content. The cosmid location of the 10 cDNA clones that have been expanded from exons is indicated by a circle. Additional detail regarding markers present in specific cosmid clones is given in Table 1. An attempt has been made to coordinate previously published mapping information about this region with this exon map. Therefore, the cosmids are annotated with letters to reflect those clones that have also been reported (12). Estimates of fragment sizes between various markers based on pulsed field gel electrophoresis and restriction fingerprinting of YACs (15,19,25) are given below the bottom scale along with the estimated size of the same fragment from this map in parentheses. The cosmid location of cDNA clones reported by other groups (11,13) is indicated by a square if the cosmid was also present in this collection of clones.
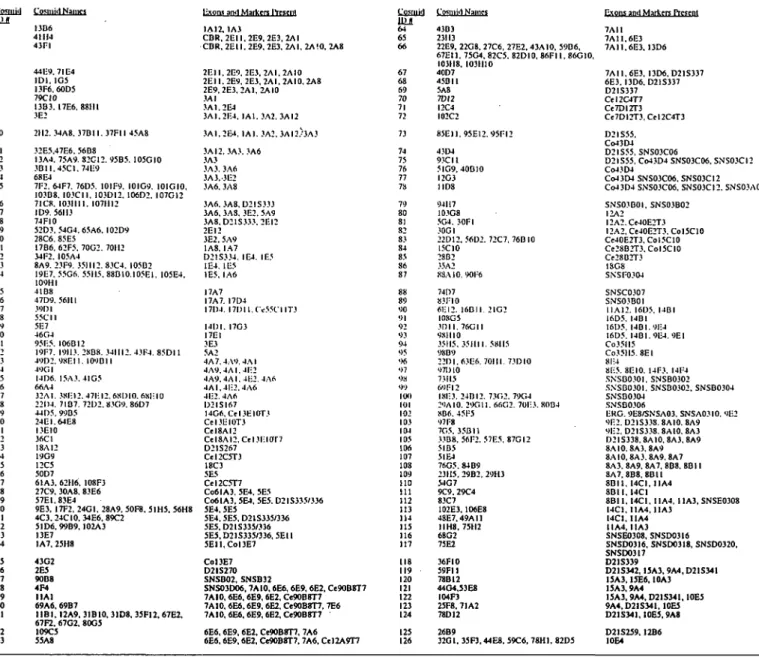
Table 1. Cosmid clones and associated exons timiiu 1114 I 2 3 4 5 6 7 8 9 10 11 12 13 14 15 16 17 18 19 20 21 • > • > 23 24 25 26 27 28 29 30 31 32 33 34 35 36 37 38 39 4 0 41 42 4 3 44 45 46 47 48 49 50 51 52 53 54 55 56 57 58 59 60 61 62 63 Cosmid Names 13B6 41114 43FI 44E9. 7IE4 IDI. 1G5 13F6. 60D5 79CI0 I3B3. 17E6. 88111 3E2 2112. 34A8. 37B11. 37F11 45A8 32E5.47E6. 56B8
I3A4. 75A9. S2G12. 95B5. 105GI0 3BII.45C1.74E9
68E4
7F2. 64F7. 76D5. 10IF9. I0IG9. 101GI0, 103B8. IOJCII, 1O3D12. 106D2. I07G12 71C8. 1031111. 1071112 ID9. 56113 74F10 52D3. 54G4. 65A6. I02D9 28C6. 85E5 I7B6. 62F5. 70G2. 70112 34F2. I05A4
8A9. 21F9 3^1IP 81C4 lOSB"* 19E7. 55G6. 55115. 88B10.I05E1. 105E4. 109H1 41B8 47D9. 56111 3901 55CII 5E7 46G4 95P.5. I06BI2 19F7. 19113. 28B8. 341112. 43F4. 85D11 49D2. 98EI1. I09B1I 49GI 1406. 15A3. 4IG5 66A4 J2A1. 38H12. 471! 12. 681)10. 6HH10 221)4. 71B7. 72D2. 83G9. 86D7 441)5. 99B5 24E1.64E8 I3EI0 36C1 18A12 19G9 12C5 50D7 61A3. 62116. I0SF3 27C9, 30A8, 83E6 57E1.83E4 9E3. 17F2. 24G1. 28A9. 50F8. 51H5. 56H8 4C3. 24CI0. 34E6. 89C2 51D6. 99B9.102A3 13E7 1A7. 25H8 43G2 2E5 90B8 4F4 IIA1 69A6, 69B7 11B1, I2A9. 31B10, 31D8. 35F12. 67E2. 109C5 55A8
ILxons ami Markers lYesein IAI2.IA3
CBR, 2E11.2E9. 2E3. 2A1 CBR, 2E11. 2E9. 2E3. 2AI. 2A!0. 2A8 2E1I.2E9. 2E3. 2AI.2AIO 2EI1. 2E9. 2E3. 2A1. 2A10.2A8 2E9. 2E3. 2A1.2AI0 3AI
3AI.2E4
3A1.2E4. IA1.3A2. 3AI2 3AI.2E4. IA1. 3A2. 3AI2.-'3A3 3AI2. 3A3. 3A6
3A3 3A 3. 3A6 3A3.3E2 3A6. 3A8 3A6. 3A8, D2IS333 3A6. 3A8. 3E2. 5A9 3A8.D21S333. 2E12 2E12 3E2. 5A9 1A8. IA7 D21S334. IE4. IE? 1E4. 1E5 1E5. IA6 I7A7 I7A7. I7D4 171)4. I7UII.CV55CI1T3 141)1. I7G3 17EI 3E3 5A2
4A7. 4A9. 4AI 4A9. 4A1. 41:2 4A9.4AI.4E2. 4A6 4AI.4H2.4Afi 4E2.4A6 D2ISI67 I 4 G 6 . C C I 3 E I 0 T 3 Cel3EIOT3 Cel8AI2 Cel8AI2.Ccl3EIOT7 D21S267 Cel2C5T3 18C3 5E5 Cel2C5T7 Co61A3. 5E4. 5E5 Co61A3, 5E4, 5E5. D2IS33.V336 5E4, 5E5 5E4.5E5.D2IS335/336 5E5.D21S335/336 5E5.D2IS335/336,5E11 5EI1.COI3E7 Col3E7 D2IS27O SNSB02, SNSB32
SNS03DO6, 7A10,6E6, 6E9, 6E2, Ce90B8T7 7A10, 6E6,6E9,6E2, Ce90B8T7 7A10. 6E6.6E9. 6E2. Ce90B8T7, 7E6 7A10, 6E6, 6E9.6E2, Ce90B8T7 6E6,6E9.6E2, Ce9OB8T7, 7A6 6E6,6E9,6E2, Ce90B8T7, 7A6, Cel2A9T7
Cosiniil II) » 64 65 66 67 68 69 70 71 72 73 74 75 76 77 78 79 80 81 82 83 84 85 86 87 88 89 90 91 92 93 94 95 96 97 98 99 10(1 101 102 103 104 105 106 107 108 109 110 111 112 113 114 115 116 117 118 119 120 121 122 123 124 125 126 C n . j . i N . m c 43B3 23113
22E9. 22G8. 27C6, 27E2. 43A10. 59B6, 67EII.75G4.82C5.82D10, 86F11.86G10, 103118. 1031110 40D7 45BI1 5A8 7DI2 I2C4 1O2C2 85E11.95E12. 95FI2 431)4 93C11 5IG9. 40BI0 I2G3 IIO8 94117 103G8 5G4. 30F1 30GI
22DI2. 56U2. 72C7, 76BI0 I5C10 28B2 35A2 88AI0. 90F6 7407 83FIO 61:12. I6BII 2IG2 I08G5 31)11. 76GI1 981110 35115. 351111.58115 98B9 22O1.63E6. 70111. 73DIO 971)10 73115 69F12 181:3. 24BI2. 73G2. 79G4 29AI0. 29G1I. 6CG2. 701:3. 80B4 8B6. 45F5 97F8 7G5. 35BI1 33B8. 56F2. 57E5. 87GI2 51B5 51E4 76G5. 84B9 23115. 29B2, 29H3 54G7 9C9. 29C4 83C7 102E3. 1O6E8 48E7.49A11 11H8. 75112 68G2 75E2 36F10 59F1I 78B12 44G4.53E8 1O4F3 25F8. 71A2 78012 26B9 32G1, 35F3.44E8. 59C6, 78H1, 82D5
Exons anil Markers Present 7A11 7A11.6E3 7A11.6E3, I3D6 7 A I I . 6 E 3 . 13D6.D21S337 6E3. 13D6. D21S337 D21S337 Ctl2C4T7 Ce7DI2T3 Cs7DI2T3.Cel2C4T3 D2IS55. Co43D4 D2IS55, SNS03C06
D2IS55, Co43D4 SNS03C06. SNS03CI2 CO4JD4
Co43D4 SNS03C06, SNS03C12 Co43D4 SNS03C06. SNSO3C12. SNSO3AO6 SNS03B0I. SNSO3BO2
12A2 l2A2.Ce40E2T3 12A2, Ce40E2T3. ColSCIO Ce40E2T3, ColSCIO Ce28B2T3. Col5CI0 Ce28B2T3 1SG8 SNSF0304 SNSCO3O7 SNS03B0I IIA12. 16D5. I4BI I6D5. 14B1 1605, I4BI.9IM 1605. 14B1.9E4. 9E1 Co35ll5 CoJ5115.8EI 81:4 8K5. 8EI0. 14FJ. I4F4 SNSB030I, SNSBO3O2 SNSB030I. SNSBO3O2. SNSB0304 SNSB0304 SNSBO3O6
ERG. 9E8/SNSA03. SNSA03IO. 9B2 9E2. D21S338. 8AI0. 8A9 9E2, D21S338.8A10. 8A3 O2IS338.8A10. 8A3, 8A9 8 A I 0 . 8 A 3 . 8 A 9 8 A I 0 , 8 A 3 . 8 A 9 . 8A7 8A3. 8A9. 8A7, 8B8. 8BI1 8A7, 8B8. 8B1I 8 B I I . 1 4 C I . IIA4 8 B I I . 1 4 C 1
8 B I I . I 4 C 1 . 1IA4. 1IA3, SNSEO3O8 14C1, 11A4, 11 A3 MCI, I1A4 I I A 4 . I I A 3 SNSE0308, SNSDO316 SNSD0316. SNSD0318, SNSDO32O, SNSDO317 D21S339 D21S342,13A3. 9A4, D21S341 15A3.13E6.10A3 15A3.9A4 15A3.9A4, D21S341.10E5 9A4. D2IS341, 10E5 D21SM1.10E5,9A8 D21S239. I2B6 10E4
Exon characterization
Sequence analysis of these exons and comparison with public
databases revealed that six different exons from the ERG
proto-oncogene had been isolated. Several other significant
similarities [p(N) >\Qr
A] were found. The strongest similarity
was found with exon 17D11 and the Drosophila gene
single-minded (sim), which is a transcriptional regulator of genes
controlling development of some cells in the Drosophila central
nervous system (16,17). The results of the database analyses
are listed in Table 2.
The authenticity of the isolated exons as parts of genes is
supported by expansion of the exons to cDNA clones and/or
identification of a mRNA species by hybridization of the exon
or cDNA fragment to northern blots. To date, 16 exons have
identified 10 different cDNA clones by hybridization to one
or more cDNA libraries. Nine other exons have not identified
a cDNA clone, although only one cDNA library (human fetal
brain) was screened. Four of the 10 cDNA clones obtained
contain one or two mapped exons in addition to the exon used
to identify the cDNA. The cDNA clones have been purified
and localized to chromosome 21 by hybridization to genomic
Southern blots and colony grids of exon and cosmid clones as
described above for localization of the exons. Figure 4 is an
example of a cDNA hybridization to cosmid and exon colony
grids. A representative cosmid to which each of the 10 cDNA
clones has been localized is indicated in Figure 3 by a circle.
Three exons and three cDNA fragments expanded from an
exon have been hybridized to northern blots to determine
expression pattern and mRNA size. Figure 5 is an example of
a northern blot hybridized with a cDNA fragment that was
expanded from exon 3E2. This cDNA detects a predominant
~8 kb mRNA species that appears to be expressed at varying
levels in all adult tissues assessed.
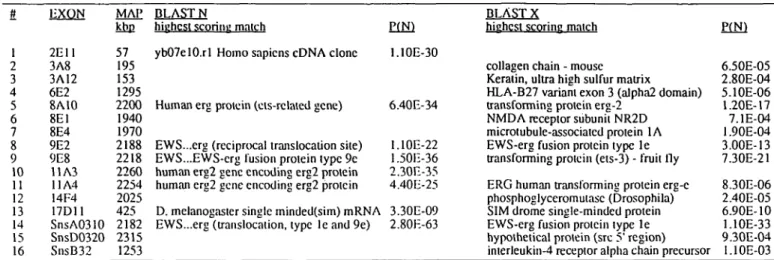
Table 2. Results of sequence database searches
EXON MAP BLAST N
kbp highest scoring match P(N) 1 2 3 4
5
6 7 8 9 10 11 12 13 14 15 162nn
3A8 3A12 6E2 8A10 8E1 8E4 9E2 9E8 11 A3 11A4 14F4 17D11 SnsA0310 SnsD0320 SnsB32DISCUSSION
57 195 153 1295 2200 1940 1970 2188 2218 2260 2254 2025 425 2182 2315 1253ybO7elO.rl Homo sapiens cDNA clone 1.10E-30 Human erg proiein (eis-rclaied gene) 6.40E-34 EWS...erg (reciprocal translocation site) 1.10E-22 EWS...EWS-crg fusion protein type 9e 1.50E-36 human erg2 gene encoding erg2 protein 2.30E-35 human erg2 gene encoding erg2 proiein 4.40E-25 D. melanogaster single minded(sim) mRNA 3.30E-09 EWS...erg (translocation, type Ieand9e) 2.80E-63
BLAST X
highest scoring match P(N) collagen chain - mouse 6.50E-05 Keratin, ultra high sulfur matrix 2.80E-04 HLA-B27 variant exon 3 (alpha2 domain) 5.1OE-06 transforming protein erg-2 1.20E-17 NMDA receptor subunit NR2D 7.1E-04 microtubule-associatcd protein 1A 1.90E-04 EWS-erg fusion protein type 1 e 3.00E-13 transforming protein (ets-3) - fruit fly 7.30E-21 ERG human transforming protein erg-e 8.30E-06 phosphoglyceromutasc (Drosophila) 2.40E-05 SIM drome single-minded protein 6.90E-10 EWS-erg fusion protein type le 1.1OE-33 hypothetical protein (sre 5' region) 9.30E-04 interleukin-4 receptor alpha chain precursor 1.10E-03
The extensive amount of physical and genetic information and
resources available for chromosome 21 was instrumental in
allowing the construction of the next phase of higher resolution
physical and transcript maps by us and others (11-13,18-20).
Our approach was to: (i) use the YAC map to identify a subset
of cosmids for a 2.5 Mb region; (ii) bin the cosmids according
to regions of YAC overlap; (iii) assay the cosmids for the
presence of known markers; (iv) isolate exons from the cosmid
bins; and (v) use the isolated exons as markers to further order
cosmids within and between bins. Integrating exon content
mapping with genetic mapping information culminated in the
relative placement of ordered cosmids covering -88% (2.2
Mb/2.5 Mb) of this region with an average exon density of 1
every 25 kb, the identification of cosmid gaps and estimates
of gap sizes. In this map, the average cosmid gap is estimated
to be -10 kb. Only one cosmid gap appears to be of significant
size, -100 kb, and current efforts are focused on closing it by
cosmid end clone walking. A previously reported cosmid map
of this region describes a minimal set of 76 cosmid clones
and associated cDNA fragments (12,13). The addition of the
information described here provides depth to the cosmid map,
additional contig ordering and linking, and complements the
transcript map with non-redundant gene fragments in the form
of exons.
Localization of cDNA clones to this region by other groups
has recently been reported (11,13). Comparison of these cDNA
sequences with the exon sequences revealed one overlapping
clone, a cDNA fragment corresponding to the ERG gene that
contained exon 9E2. The YAC and cosmid location of the
remaining cDNA clones places them in regions where other
exons have been localized and therefore some of them may
represent different fragments of the same genes. The combined
efforts of exon amplification and cDNA selection have likely
isolated fragments of many of the genes in this region.
However, the coverage of the transcript map can only be as
comprehensive as the initial cosmid map from which the exons
and cDNAs are derived. Where there are cosmid gaps in the
map, there are potential gene gaps and current efforts are
focused on investigating these areas.
The blast analysis of the exons has identified 4.9% (5/
102) with significant similarities [p(N) > 10"
4] to reported
sequences, in addition to those exons from the ERG gene.
This is comparable to the 5.5% (1/18) significant similarities
reported for BLAST analysis of cDNA selected clones from
this region (12) with analogous values for p(N). Possible
explanations for this finding are that many of the genes in this
region are novel or, more likely, that the amount of sequence
available from the exons is insufficient to identify similarities
with known genes in many instances. As additional sequence
from the same gene is determined from cDNA analysis more
relationships with known genes might be expected to emerge.
Another application of the high resolution map of this region
will be in the area of fine mapping of sequence copy number
in some individuals with partial aneuploidies for chromosome
21. By using individual cosmid clones as FISH probes,
the requirement for informative polymorphisms to determine
sequence copy number is alleviated and the analysis can be
performed approximately every 50 kb between CBR and ERG
with the existing cosmids. This will allow refinement of the
definitions of some phenotype-genotype correlations in DS.
Having cloned exons available from these cosmids provides
immediate access to the genes that contribute to the DS
phenotypes mapped to that region.
It is expressly because the definition of DS regions is
complicated that large scale gene isolation efforts are needed
since many genes from several regions of the chromosome
will likely need to be studied in order to decipher their roles
in DS. In addition, the experience gained from utilizing large
scale gene isolation approaches in the DS region should allow
them to be more effectively applied to other genomic regions
of interest. The challenge of the future is to correlate
over-expression of these genes, singly or in combination, with the
presence of a DS phenotype.
MATERIALS AND METHODS
YAC clones
DNA from YAC clones representing the region between CBR and ERG (21,22) was made as described (23). Sizes of the YACs were determined by hybridization of Southern blots of pulsed field gels to human Cot\ DNA. The presence of STS in the YACs were confirmed by PCR using primer sequences available from public databases.
A B
I
1 2 3 4 5 6 7 8 9
3 4 5
Figure 4. Localization of the cDNA clone containing exon 3E2 to chromosome
21. (A) Cosmid colony grid. Colony grids of the 394 cosmids identified by hybridization with YAC Alu-PCR products were prepared using a Biomek 1000 robot. Clones were stamped in duplicate in a 4X2 array. Cosmids containing the cDNA are indicated by the duplicate signals. This cDNA is present in 17 cosmids, five of which also contain exon 3E2 (Table 1). (B) Colony grid of exon clones. Exons isolated from cosmid pools were cloned, arrayed in 96-well dishes and stamped on nylon filters. This cDNA hybridizes to exon 3E2, which was used to isolate the cDNA, and four other trapped exons. (C) Genomic Southern blot. Digested genomic DNA, isolated from cell lines, was separated on 1.0% agarose gels, transferred to nylon membranes. Lanes are the same as described in Figure 2B. The bands common to lanes I and 4 indicate this cDNA localizes to chromosome 21. Similarly, a common band in lanes 2 and 5 indicate cross hybridization to mouse genomic DNA and localization to mouse chromosome 16. This sequence is also conserved in hamster genomic DNA as indicated by the band in lanes 2 and 3.
Isolation of cosmid clones
Cosmid clones were identified by hybridization of colony grids with gel purified YAC DNA or YAC Alu-PCR products (Fig. 1). When Alu-PCR products were used, DNA from YAC clones was amplified with four different
Alu primers, combined and hybridized to colony grids (3X3 or 4X4) of a
flow sorted chromosome 21 cosmid library, LL2INC02, constructed at Lawrence Livermore National Laboratory. Positive cosmids were picked into microtitre plates and colony grids were prepared. Alu-PCR products from individual YACs were individually hybridized to this subset of cosmid clones. Cosmid clones that rescreened positive with individual YACAlu-PCR products were placed in bins. Cosmid bins are defined by regions of overlap and non-overlap between different YACs. The individual cosmids in each bin are listed in Table 1. Miniprep DNA was prepared and the restriction patterns of cosmids
Figure 5. Northern blot analysis with the cDNA clone containing exon 3E2.
Tne northern blot containing poly-A+ mRNA from human adult tissues was obtained from Clontech and hybridized with the gel purified cDNA insert from the clone containing exon 3E2. Lanes: 1, marker; 2, heart; 3, brain; 4, placenta; 5, lung; 6, liver; 7, sk. muscle; 8, kidney; 9, pancreas. This cDNA hybridizes to an mRNA of ~8.0 kb that is expressed in all tissues present.
within a bin were compared to identify identical cosmids. Non-identical cosmids were chosen for subsequent exon amplification experiments.
Isolation of exons
Subsets of non-identical cosmids from each bin were subjected to exon amplification (13; Gibco-BRL). A total of 218 cosmids were trapped in 21 pools of up to 15 clones per pool. Forty eight exon clones from each cosmid pool (1008 total exon clones) were picked to 11 microtitre plates. Initially, 12 exon clones, (252 total clones) were sequenced from each pool to identify unique exons and background products, which consist of repetitive elements and vector sequences. Redundant clones in each trapping pool were identified by hybridizing PCR amplified products from these 12 exons and background containing clones to colony grids of all the clones obtained from the trapping experiment. A second round of exon trapping was performed using 56 cosmids that either yielded no exons in the initial trapping experiments, or were obtained as the result of chromosome walking or PCR screening of the cosmid library. The second round of trapping was performed on individual clones or on pools of up to seven cosmids per pool. The resulting exons were analyzed as described above for the initial trapping experiments. A total of 404 potentially unique exon clones were identified. Full sequence has been obtained for 115 unique exon clones using the method of Sanger (24) and a sequencing kit (USB). Sequence database analysis was performed using the BLAST network service of the National Center for Biotechnology Information. The Genbank accession numbers for the exons included in Figure 3 are X85338-X85367 for SNS exons and R82098-R82175 for exons beginning with 'e'.
PCR conditions
The primers used in the Alu-PCR of YAC DNA, derived from the Alu sequence, were: Alu S (5'-gaggttgcagtgagccgagat-3'), Alu J (5'-gctgcagtgagccgtgat-3'), ALE 1 (5'-gcctcccaaagtgctgggattacag-3'), ALE 3 (5'-ccactgcactccagcctggg-3'), END-2 (5'-acagagc/tg/aagactccgtctc-(5'-ccactgcactccagcctggg-3'), END-1 (5'-acagagcgagactcc/tg/ atc-3'). The Alu S and Alu J primers are combined in a single PCR reaction as are the END-1 and END-2 primers. The Ale 1 and Ale 3 primers are used individually. Amplification conditions were 94°C, 30 s; 60°C, 30 s; 72°C, 2 min for 35 cycles. Amplification of YAC DNA with STS was performed using primer sequences described in public databases and conditions as above with a 1 min extension time. Cloned exon products were amplified using vector sequences SD2 and SD2R. Purified amplification products were used as hybridization probes in subsequent mapping experiments.
Hybridization conditions
Probes for hybridization to colony grids or genomic Southern blots were exons -50 bp or longer, cDNA clones or Alu-PCR products. Probes were labelled by random priming with 32P-dATP and 32P-dCTP and pre-annealed
with human placental and/or Cot\ DNA (BRL) if necessary. Preannealed probes were mixed with 50 ng Cot\ DNA or 5 ng Cot\ and 2 mg of placental DNA in 5X SSC. 0.1% SDS, heated to 100°C for 5 min followed by incubation at 65°C for 1 or 4 h, respectively, before adding to hybridization buffer. Hybridizations were performed in Church and Gilbert hybridization buffer at 65°C overnight. Filters were washed in 2X SSC, 0.1% SDS at room temperature followed by IX SSC, 0.1% SDS at 65°C and 0.5X SSC, 0.1% SDS at 65°C for 15-20 min each, except for/l/a-PCR product probes, which were washed to 0.1 x SSC, 0.1% SDS at 65°C for 15-20 min. Northern blots were hybridized in 50% formamide, 10% dextran sulfate, 1 M NaCl, IX Denhardt's solution, 50 mM Tris (pH 7.5), 0.5% SDS, 100 Hg/ml sheared denatured salmon sperm DNA at 42°C and washed to a stringency of 0.5 X SSC, 0.1% SDS. Filters were exposed to autoradiographic film from several hours (colony grid hybridizations) to several days (genomic Southern and northern blots).
ACKNOWLEDGEMENTS
The authors would like to thank C.J.Stotler and J.Rutter for excellent technical support and M.Lalioti and J-L.Blouin for their assistance with certain experiments. This work was supported in part by N1H grant NS32675 to MKM and by the Swiss FNRS grant 31-33965.92, 31-40500.94 and EC grant GENE-CT93-O015 to SEA.
REFERENCES
1. Lejeune, J., Gautier, M. and Turpin, R. (1959a) Etude des chromosomes somatiques de neuf enfants mongoliens (Study of the somatic chromosomes of nine mongol children) C. R. Acad. Sci. (Paris) 248: 1721-1722.
2. Lejeune, J., Turpin, R. and Gautier, M. (1959b) Le mongolisme, maladie chromosomique (Trisomie). (Monglosim, a chromosomal disease (Trisomy)). Bull. Acad. Nat. Med. 143: 256-265.
3. Summit, R.L. (1981) Trisomy 21 (Down syndrome) Research Perspectives. (1981) (FF de la Cruz and PS Gerald, eds). pp 225-235. University Park Press, Baltimore.
4. McCormick, MK., Schinzel, A., Petersen, M.B., Stetten, G., Driscoll, D.J., Cantu, E.S., Tranebjaerg, L., Mikkelsen, M , Watkins, PC. and Antonarakis, S.E. (1989) Molecular genetic approach to the characterization of the 'Down syndrome region' of chromosome 21.
Genomics 5: 325-331.
5. Delabar, J-M., Theophile, D., Rahmani, Z., Chettouh, Z., Blouin, J-M, Prieur, M., Noel, B. and Sinet, P-M. (1993) Molecular mapping of twenty-four features of Down syndrome on chromosome 21. Eur. J. Hum. Genet. 1: 114-124.
6. Sinet, P-M., Theophile, D., Rahmani, Z., Chettouh, Z., Blouin, J-L., Prieur, M., Noel, B. and Delabar, J-M. (1993) Molecular mapping of the Down syndrome phenotype on chromosome 21 in Thephenotypic mapping
of Down syndrome and other aneuploid conditions. Wiley-Liss, Inc. p.
63-86.
7. Rahamni, Z., Blouin, J.L., Creau-Goldberg, N., Watkins, P C , Mattei, J.F., Poisonnier, M., Prieur, M., Chettouh, Z., Nicole, A., Aurias, A., Sinet, P-M. and Delabar, J-P-M. (1989) Critical role of the D2IS55 region on chromosome 21 in the pathogenesis of Down syndrome. Proc. Natl.
Acad. Sci. USA 86: 5958-5962.
8. Korenberg, J.R., Kojis, T.L., Bradley, C. and Disteche, C. (1989) Down syndrome and band 2lq22.2: molecular definition of the phenotype. Am.
J. Hum. Genet. 45: (Suppl) A79.
9. Korenberg, J.R., Kawashima, H., Pulst, S-M., Ikeuchi, T., Ogasawara, N., Yamamoto, K., Schonberg, S.A., et al. (1990) Molecular definition of a region of chromosome 21 that causes features of the Down syndrome phenotype. Am. J. Hum. Genet. 47: 236-246.
10. Korenberg, J. R., Chen, X-N., Schipper, R., Sun, Z., Gonsky, R., Gerwehr, S., Carpenter, N., Daumer, C , Dignan, P., Disteche, C , Graham, Jr., J. M., Hugdins. L., McGillivray, B., Miyazaki, K., Ogasawara, N., Park, J. P., Pagon, R., Pueschel, S., Sack, G., Say, B., Schuffenhauer, S., Soukup, S. and Yamanaka, T. (1994) Down syndrome phenotypes: The consequences of chromosomal imbalance. Proc. Nail.
Acad. Sci. USA 91: 4997-5001.
11. Cheng, J-F., Boyartchuk, V. and Zhu, Y. (1994) Isolation and mapping of human chromosome 21 cDNA: Progress in constructing a chromosome 21 expression map. Genomics 23: 75—84.
12. Patil, N., Peterson, A., Rothman, A., de Jong, P. J., Myers, R. M. and Cox, D. R. (1994) A high resolution map of 2.5 Mbp of the Down
syndrome region on chromosome 21. Hum. Mol. Genet. 3: 1811-1817. 13. Peterson, A., Patil, N., Robbins, C , Wang, L., Cox, D. R. and Myers, R.
M. (1994) A transcript map of the Down syndrome critical region on chromosome 21. Hum. Mol. Genet. 3: 1735-1742.
14. Buckler, A.J., Chang, D.D., Graw, S.L., Brook, J.D., Haber, D.A., Sharp, PA. and Housman, D.E. (1991) Exon Amplification: A strategy to isolate mammalian genes based on RNA splicing. Proc. Natl. Acad.
Sci. USA 88: 4005^009.
15. Crete, N., Gosset, Ph., Theophile, D., Duterque-Coquillaud, M., Blouin, J. L., Vayssettes, C , Sinet, P-M. and Creau-Goldberg, N. (1993) Mapping the Down syndrome chromosome region. Eur. J. Hum. Genet. 1: 51-63. 16. Nambu, J. R., Lewis, J. O., Wharton, K. A. and Crews, S. T. (1991) The Drosophila single-minded gene encodes a helix-loop-helix protein that acts as a master regulator of CNS midline development. Cell 67: 1157-1167.
17. Muralidhar, M. G., Callahan, C. A. and Thomas, J. B. (1993) Single-minded regulation of genes in the embryonic midline of the Drosophila central nervous system. Mech. Dev. 41: 129-138.
18. Antonarakis, S.E. (1993) Human chromosome 21: genome mapping and exploration. Trends Genet 9: 142-148.
19. Nizetic, D., Gellen, L., Hamvas R. M. J., Mott, R., Grigoriev, A., Vatcheva, R., Zehetnet, G., Yaspo, M-L., Dutriaux, A., Lopes, C., Delabar, J-M., Van Broeckhoven, C , Potier, M-C. and Lehrach, H. (1994) An integrated YAC-overlap and 'cosmid-pocket' map of the human chromosome 21. Hum. Mol. Genet. 3: 759-770.
20. Soeda, S., Hou, D-X., Osoegawa, K., Atsuchi, Y, Yamagata, T., Shimokawa, T., Kishida, H., Soeda, E., Okano, S., Chumakov, I., Cohen, D., Raff, M., Gardiner, K., Graw, S., Patterson, D., De Jong, P., Ashworth, L., Slezak, T. and Carrano, A. V. (1995) Cosmid assembly and anchoring to human chromosome 21. Genomics 25: 73-84. 21. Chumakov, I. M., Le Gall, I., Billault, A., Ougen, P., Soularue, P.,
Guillou, S., Rigault, P., Bui, H., De Tand, M-F., Barillot, E., Abderrahim, H., Cherif, D., Berger, R., Le Paslier, D. and Cohen, D. (1992) Isolation of chromosome 21-specific yeast artificial chromosomes from a total human genome library. Nature Genet. 1:222-225.
22. Cohen, D., Chumakov, I., Weissenbach, J. (1993) A first-generation physical map of the human genome. Nature 366:698-701.
23. Davis, R. W., Thomas, M., Cameron, J., St. John, T P., Scherer, S. and Padgett, R. A. (1980) Rapid DNA isolation for enzymatic and hybridiaztion analysis. Meth. Enzymol. 65:404-411.
24. Sanger, F., Nicklen, S. and Coulsen. (1977) Proc. Natl. Acad. Sci. USA 74: 5463-5467.
25. Dufresne-Zacharia, M-C, Dahmane, N., Theophile, D., Orti, R., Chettouh, Z., Sinet, P-M. and Delabar, J-M. (1994) 3.6 Mb genomic and YAC physical map of the Down syndrome chromosome region on chromosome 21. Genomics 19: 462—469.
26. McCormick, M. K., Buckler, A., Bruno, W., Campbell, E., Shera, K., Torney, D., Deaven, L. and Moyzis, R. (1993) Construction and characterization of a YAC library with a low frequency of chimeric clones from flow sorted human chromosome 9. Genomics 18: 553-558.