[15:16 26/6/2009 Bioinformatics-btp303.tex] Page: 1982 1982–1983
BIOINFORMATICS
APPLICATIONS NOTE
Vol. 25 no. 15 2009, pages 1982–1983doi:10.1093/bioinformatics/btp303Genetics and population analysis
TANDEM: integrating automated allele binning into genetics and
genomics workflows
Michael Matschiner
∗and Walter Salzburger
Zoological Institute, University of Basel, Vesalgasse 1, 4051 Basel, Switzerland Received on December 11, 2008; revised on April 30, 2009; accepted on May 1, 2009
Advance Access publication May 6, 2009 Associate Editor: Martin Bishop
ABSTRACT
Summary: Computer programs for the statistical analysis of
microsatellite data use allele length variation to infer, e.g. population genetic parameters, to detect quantitative trait loci or selective sweeps. However, observed allele lengths are usually inaccurate and may deviate from the expected periodicity of repeats. The common practice of rounding to the nearest whole number frequently results in miscalls and underestimations of allelic richness. Manual sorting of allele lengths into discrete classes, a process called binning, is tedious and error-prone. Here, we present a new program for the automated binning of microsatellite allele lengths to overcome these problems and to facilitate high-throughput allele binning.
Availability: www.evolution.unibas.ch/salzburger/software.htm Contact: [email protected]
Supplementary information: Supplementary data are available at
Bioinformatics online.
1 INTRODUCTION
Microsatellites are among the most important molecular markers for a wide range of biological questions (Schlötterer, 2004). Despite the recent trend towards single nucleotide polymorphisms (SNPs), microsatellites still enjoy many advantages, in particular for studies of nonmodel organisms, where substantial effort is required for the development of a sufficient number of biallelic markers (Ryynanen et al., 2007). Among the main problems associated with microsatellites are effort and error rates of genotyping. Scoring of microsatellite alleles is typically performed using commercial software such as GENEMAPPER (Applied Biosystems) or GENEMARKER (Softgenetics). Both programs calculate allele lengths through comparison with internal size standards run alongside PCR amplified fragments in capillary electrophoresis. This calculation is based on the assumption of equal migration rates of DNA fragments of the same length. However, migration rates depend not only on fragment length, but also on DNA sequence motifs (Rosenblum et al., 1997) and fluorescent labels (Wenz et al., 1998). Therefore, measured fragment lengths are often inaccurate. As microsatellite variability mainly results from slippage synthesis (Schlötterer and Tautz, 1992) allele sizes are expected to conform to the periodicity of the repeated motif. However, it has been observed that the effective spacing between peaks of observed allele sizes varies between 1.77 and 2.23 base pairs (bp) (Amos et al., 2007). This so-called ‘allelic drift’ renders automated binning of alleles
∗To whom correspondence should be addressed.
a nontrivial task (Idury and Cardon, 1997). Simple rounding of alleles to the nearest whole number will lead to inconsistencies, such as the presence of even and odd alleles for the same marker. Rounding to the nearest number conforming the expected periodicity will merge alleles and may cause underestimates of allelic richness and heterozygosity when the effective spacing between peaks of dinucleotide repeat loci is>2.0 bp. Manual binning of alleles is time-consuming, error-prone and often arbitrary. GENEMAPPER’s built-in binning method requires reference data that is usually not available for nonmodel organisms. When GENEMAPPER is run without exhaustive reference data, new alleles that fall outside established bins are placed with poor accuracy (Amos et al., 2007). Automated binning without reference data has been addressed by the software packages ALLELOBIN (Idury and Cardon, 1997) and FLEXIBIN (Amos et al., 2007), using least-squares minimization procedures and allowing for allelic drift. Here, we present a new program called TANDEM that is specifically designed for seamless integration into population genetic and genomic workflows as it requires no additional reformatting of data files. It is freely available in two versions: (i) a Macintosh version, which is equipped with a basic graphical user interface (GUI) and (ii) Ruby source code, which is compatible with Macintosh, Windows and Linux systems.
2 METHODS
For minimum configuration effort, TANDEM has been designed to accept files in the format of the programs MSA (Dieringer and Schlötterer, 2003) and CONVERT (Glaubitz, 2004), that are both commonly used starting points for population genetic and genomic workflows (Excoffier and Heckel, 2006; Teschke et al., 2008; Zhang et al., 2007). These two programs are able to convert spreadsheet data into input files for a large number of downstream applications, such as ARLEQUIN (Excoffier et al., 2005), STRUCTURE (Pritchard et al., 2000), GENEPOP (Raymond and Rousset, 1995), MIGRATE (Beerli, 2005) and IM (Hey and Nielsen, 2004). MSA as well as CONVERT expect alleles that have already been binned, while TANDEM uses the same formats with unbinned alleles.
In order to compensate for allelic drift and compression at large fragment sizes, TANDEM transforms all allele sizes before rounding. To this end, TANDEM optimizes all parameters of the power function
transformed allele size= a+b×observed allele sizec (1) so that rounding errors of transformed allele sizes become minimal. TANDEM applies a least-squares minimization of rounding errors. Parameter optimization is performed using an exhaustive search or, optionally, using a heuristic search with the Nelder–Mead Downhill Simplex algorithm (Nelder and Mead, 1965). Prior parameter bounds and step sizes for the exhaustive search are listed in Supplementary Table 1. By default, transformed allele
[15:16 26/6/2009 Bioinformatics-btp303.tex] Page: 1983 1982–1983
TANDEM
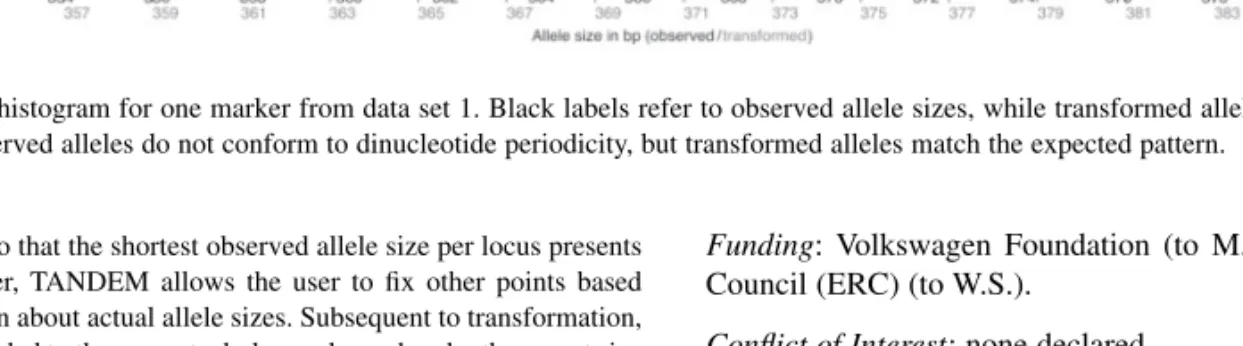
Fig. 1. Frequency histogram for one marker from data set 1. Black labels refer to observed allele sizes, while transformed allele sizes are shown with grey
labels (in bp). Observed alleles do not conform to dinucleotide periodicity, but transformed alleles match the expected pattern.
sizes are adjusted so that the shortest observed allele size per locus presents a fixpoint. However, TANDEM allows the user to fix other points based on prior information about actual allele sizes. Subsequent to transformation, allele sizes are rounded to the nearest whole number, whereby the repeat size of the microsatellite is taken into account (e.g. repeat size = 2 for dinucleotide repeats). Where repeat sizes of loci are not specified by the user, they are estimated by TANDEM, based on observed allele sizes. Rounded allele sizes are written to a separate file in the same format as the input file. The average rounding error is calculated over all alleles and is included in the output to serve as a marker-specific quality indicator. The transformation of allele sizes is visualized by frequency histograms as shown in Figure 1. From these histograms, the overall quality of each marker, and the validity of the performed allele transformation become apparent. Outlier alleles with large rounding errors are highlighted to alert the user of problematic samples that should possibly be removed from the data set. Bin sets are automatically exported.
3 RESULTS AND DISCUSSION
In order to verify TANDEM results, we sequenced the locus depicted in Figure 1 from five individuals following Matschiner et al. (2009). Results show close agreement of fragment lengths observed by genotyping and by sequencing (Supplementary Table 2). The best fit was found for shorter allele sizes, thus justifying our approach to use the shortest fragment as a fixpoint. However, if the user is interested in absolute allele sizes, we generally recommend to sequence the respective locus in at least one individual, and to specify fixpoints accordingly. We also recommend specification of repeat sizes whenever known.
We benchmarked TANDEM’s exhaustive search algorithm against ALLELOBIN and FLEXIBIN using four different data sets, containing 8–23 microsatellite loci and varying numbers of diallelic individuals (Supplementary Table 3). We found TANDEM to perform favorably compared to both other programs. Especially when data sets included tri- and tetranucleotide repeats, TANDEM performed substantially better than FLEXIBIN. In conclusion, we present a user-friendly and versatile program for the automatic binning of microsatellite alleles that performs better than alternative software. Moreover, TANDEM is the first such program that does not require tedious and error-prone reformatting of allelic data, and thus integrates well into existing population genetic and genomic workflows.
ACKNOWLEDGEMENTS
We thank O. Balmer for discussion and permission to use his unpublished data, F. Münzel and four reviewers for valuable comments.
Funding: Volkswagen Foundation (to M.M.); European Research Council (ERC) (to W.S.).
Conflict of Interest: none declared.
REFERENCES
Amos,W. et al. (2007) Automated binning of microsatellite alleles: problems and solutions. Mol. Ecol. Notes, 7, 10–14.
Beerli,P. (2005) Comparison of Bayesian and maximum-likelihood inference of population genetic parameters. Bioinformatics, 22, 341–345.
Dieringer,D. and Schlötterer,C. (2003) Microsatellite Analyser (MSA): a platform independent analysis tool for large microsatellite data sets. Mol. Ecol. Notes, 3, 167–169.
Excoffier,L. and Heckel,G. (2006) Computer programs for population genetics data analysis: a survival guide. Nat. Rev. Gen., 7, 745–758.
Excoffier,L. et al. (2005) Arlequin ver. 3.0: an integrated software package for population genetics data analysis. Evol. Bioinf. Online, 1, 47–50.
Glaubitz,J.C. (2004) Convert: a user-friendly program to reformat diploid genotypic data for commonly used population genetic software packages. Mol. Ecol. Notes,
4, 309–310.
Hey,J. and Nielsen,R. (2004) Multilocus methods for estimating population sizes, migration rates and divergence time, with applications to the divergence of
Drosophila pseudoobscura and D. persimilis. Genetics, 167, 747–760.
Idury,R.M. and Cardon,L.R. (1997) A simple method for automated allele binning in microsatellite markers. Genome Res., 7, 1104–1109.
Matschiner,M. et al. (2009) Gene flow by larval dispersal in the Antarctic notothenioid fish Gobionotothen gibberifrons. Mol. Ecol., doi: 10.1111/j.1365-294X.2009.04220.x.
Nelder,J.A. and Mead,R. (1965) A simplex method for function minimization. Comput.
J., 7, 308–313.
Pritchard,J.K. et al. (2000) Inference of population structure using multilocus genotype data. Genetics, 155, 945–959.
Raymond,M. and Rousset,F. (1995) Genepop (version 1.2): population genetics software for exact tests and ecumenicism. J. Hered., 86, 248–249.
Rosenblum,B.B. et al. (1997) Improved single-strand DNA sizing accuracy in capillary electrophoresis. Nucl. Acids Res., 25, 3925–3929.
Ryynanen,H.J. et al. (2007) A comparison of biallelic markers and microsatellites for the estimation of population and conservation genetic parameters in Atlantic salmon (Salmo salar). J. Hered., 98, 692–704.
Schlötterer,C. (2004) The evolution of molecular markers-just a matter of fashion?
Nat. Rev. Gen., 5, 63–69.
Schlötterer,C. and Tautz,D. (1992) Slippage synthesis of simple sequence DNA. Nucleic
Acids Res., 20, 211–215.
Teschke,M. et al. (2008) Identification of selective sweeps in closely related population of the house mouse based on microsatellite scans. Genetics, 180, 1537–1545. Wenz,H.M. et al. (1998) High-precision genotyping by denaturing capillary
electrophoresis. Genome Res., 8, 69–80.
Zhang,J. et al. (2007) Genetic analysis and linkage mapping in a resource pig population using microsatellite markers. J. Genet. Genomics, 34, 10–16.