Invasive Chemicals
Lisa Pollaro*, Bastien Dalla Piazza, and Yann Cotte
Nanolive SA, Chemin de la Dent d’Oche 1a, 1024 Ecublens, Switzerland *[email protected]
Introduction
Until now it was impossible to look inside a living cell without damaging it, even using the most sophisticated devices. Traditional microscopy techniques rely on procedures requiring complicated time-consuming preparation (1–72 hours), which are likely to be invasive to the cells (risk of cell damage). The 3D Cell Explorer from Nanolive overcomes many limitations of light microscopy in live cell imaging. Just like computer tomography (CT) for human bodies, the 3D Cell Explorer can make a complete tomographic data set of the living cell [1]. But unlike a CT for human bodies, it does it instantly and at very low cost. Key among the features is the new concept of digital staining, which allows users to look inside the living cell, discover its interior organelles, and “travel” through it in 3D on any screen. This article describes the method and provides some examples.
Materials and Methods
Tomography of cells. By a combination of holography
[2] and rotational scanning [3], the system detects changes to light as it propagates through the cell. The sample is positioned between a high-numerical-aperture air objective beneath the sample and a rotational illumination arm above (Figure 1). This optical path forms one arm of a Mach–Zehnder interferometer setup, with the other being the reference path. Green light (520 nm) from a diode laser is split into sample and reference beams; the sample beam illuminates the sample through the rotational illumination arm at a very steep angle (Figure 2). A hologram is recorded on a digital camera by combining the beam that has passed through the sample with the reference beam. The sample beam is then rotated by a small angle and the process is repeated, with one hologram recorded for each beam position. The parameter measured by the 3D Cell Explorer is not absorption nor fluorescence intensity of an exogenous molecule as with most light optical microscopes. Instead, the physical refractive index of the sample is obtained in a three-dimensional (3D) distribution with a resolution better than the diffraction limit given by the microscope objective. The output is the refractive index distribution within the cell. The result is quantitative cell tomography, in vitro without any invasive sample preparation. Improved image resolution is achieved by employing a synthetic aperture and multiple-viewpoint-holographic methods. After the holograms have been captured, high-resolution images of each plane in the sample are created by computer processing.
Specimen preparation. As a general requirement for
any type of sample, the buffering medium should be optically clear and not scatter incoming light. For instance, solutions
with phenol red are not suitable for observation. Best are clear liquids like PBS or HEPES. The observation is always made either through FluoroDishes (glass bottom culture dishes) or coverslips about 150 µm thick (standard practice for microscope objectives). Also, because of the limited working distance of our objectives, cells should be fixed on the holders and not much more than 30 µm in height.
Cleanliness. The cleanness of the sample is crucial to
assuring good quality images. Because of our rotating illumi-nation system, debris (either floating or out-of-focus) can be hit by the beam while not being in the field of view. So optical surfaces must be as clean as possible, and cell holders should be carefully cleaned so that dead cells or other remains are not floating in the mounting medium.
Depending on the support used for the experiment, there are two procedures to follow before the start of data acquisition with the 3D Cell Explorer: (1) For coverslips, lens tissues are recommended to clean the surface of the coverslip
Figure 1: Marker-free 3D Cell explorer sample stage setup. The rotating scanning head illuminates the sample from all directions with a 520 nm green laser light at low power.
diameter of 9 mm and a thickness of 0.12 mm), by using the recommended method, or by sealing with nail polish. The last option is not the best choice because the liquid frequently overflows onto the coverslip. (2) On a FluoroDish, live or fixed cells may be directly observed on this specially designed culture dish (FluoroDish glass bottom culture dishes are available at www.wpiinc.com; ask for a 35 mm dish with a 25 mm well). In this case the amount of liquid is not important. It just should be enough so that the bottom surface of the dish is fully covered.
3D Cell Explorer. The microscope measures changes
in refractive index as light propagates through the cell, providing 3D and 4D (time) cell tomography without any intrusion of the cell. Holography offers a means to probe cells in their native environment: label-free, non-invasive, manipulation-free, and interference-free. Rotational scann- ing (with a low-power 520 nm laser beam) allows low-noise 3D reconstructions and a resolution that pushes the limit for light (Δ xy of 200 nm and Δ z of 500 nm). This new technology allows measurement of cellular processes with real-time kinetics, enabling multi-parameter analysis at the single-cell and sub-cellular scale. The cells are not manipulated in any way in order to introduce a digital label, thus the user has the possibility of measuring the response of a stimulated cell in real-time.
STEVE. The Nanolive 3D Cell Explorer works
differ-ently from most microscopes available today. Images are acquired with proprietary control software called STEVE (software for tomographic exploration of living cells). The microscope quickly self-adjusts, and a full 3D image of the cell appears on the computer screen. STEVE software controls the automatic calibration routines, 3D data acquisition, and reconstruction. Based on the cell’s physical properties (that is, refractive index) the microscopist can decide which cell parts are of interest after the experiment and can stain these regions digitally, saving time and money on reagents. This means regions with similar refractive index can be stained differently based on how sharply (large gradient) or smoothly (small gradient) the refractive index is changing within each region. An offline version of STEVE may be obtained at http://nanolive.ch/software. This is an alpha version, which works on 64-bit version of windows Vista/7/8. For additional support, Nanolive provides a document and a video to help the new user get started.
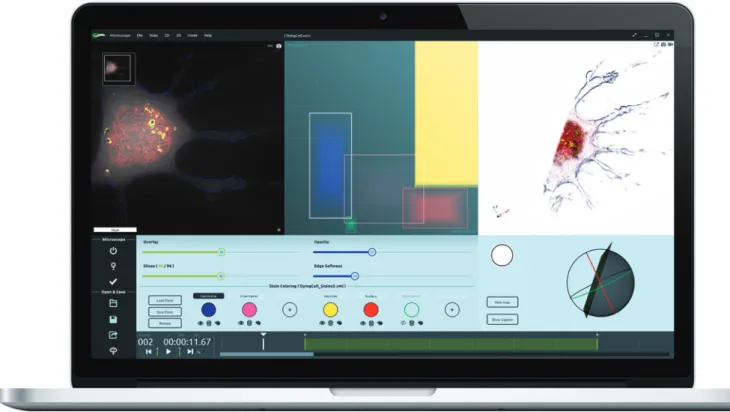
Control panels. STEVE has an intuitive graphical user
interface, shown in Figure 3, that has been specifically designed for fast learning by showing all options and commands necessary for acquiring and staining images on the main screen. The Panel Viewer shows acquisition results as two-dimensional (2D) slices and includes an interactive tool for defining digital stains that are applied to the 3D dataset. The result is shown in a 3D visualization window. Below the Panel Viewer is a Control Field, which allows the user to access the different modes of operation. To quickly scan a sample, the user can choose the “white light” mode to illuminate the sample using standard, incoherent wide-field illumination. The field of view is shown on the screen in real time. Although the images obtained in this mode are low in contrast and limited to two dimensions, near the objective (for example, MC-50E from www.thorlabs.
com). Lens tissues are ideal for removing all dust or finger-prints from the coverslip without leaving any trace of lint or fibers. To clean the coverslip, wet the tissue with a few drops of ethanol and gently rub the surface. (2) When using a FluoroDish, first wash the cells 3 times with PBS to remove cell debris, and then add the appropriate mounting medium. Second, using the same procedure described above for the coverslip, clean the external surface of the glass bottom dish, which has to be next to the objective.
In addition, it is important to clean the microscope objective lens. To do this, it is necessary to use a cotton tip applicator (for example, CTA-10 from www.thorlabs.com) soaked in ethanol. Ideally cells should have reached a low confluence (30–40%) in order to have single cells within the field of view. In this situation, tissues or cells grown on the membrane are not observable. The membranes with micron-size pores generate speckles and forbid any observation. Because the field of view of the microscope is ~90 µm and the depth of field is ~30 µm, both the dimension and the thickness of the cell must be less than these values.
Observation techniques. Again there are two options:
(1) On coverslips the medium chamber is sealed to avoid liquid drying out or leakage. This can be done either by taping on an imaging spacer (for example, from Grace Bio-Labs SS1X9-SecureSeal Imaging, typically with an inner
Figure 2: Schematic diagram of the mechanical components. The rotating scanning head can illuminate the specimen from all directions with a 520 nm green laser beam at low power. A hologram is recorded on a digital camera by combining the beam that has passed through the sample with the reference beam that has not. The sample beam is then rotated by a small angle, and the process is repeated. One hologram is recorded for each beam position.
“white light” mode can be useful for finding a specific type of cell in a sparsely populated sample. Once a suitable cell has been found, the user can start an acquisition. STEVE automati-cally verifies that the microscope is properly aligned and performs calibration steps where necessary. Once running, acquisitions are performed at a rate of 1 second per 3D frame. An explanatory video is also available at the company software link: http://nanolive.ch/software.
Digital staining. To label certain parts of the measured
cells, a process called digital staining is applied to the acquired data. The Panel Viewer is the central control element for digitally staining a sample. It allows users to define a region in a 2D space defined by the refractive index on one axis and the gradient norm of the refractive index, that is, its spatial variation, on the other. Stains are represented as rectangular areas in the Panel Viewer and can be modified by the user. Changes to stains are shown in real time in the 2D (and 3D) view. To further accelerate the digital staining process, STEVE includes a “stain painter,” with which users can “paint” a part of a cell they want to stain, and STEVE will automatically define the corresponding region in the Panel Viewer. This enables stains to be defined on regions with similar structural features.
Reconstruction and processing. To compute a 3D
refractive index distribution from the holograms recorded in the microscope, STEVE relies on routines from the field of optical diffraction tomography [1, 2]. Optimized for speed and implemented to run on graphics processing units (GPUs), the 3D reconstruction runs in real time using affordable, consumer-grade graphics hardware.
Beyond reconstruction, STEVE uses the GPU to perform image enhancement steps based on complex deconvolution. Using this process, image aberrations, usually only avoidable using expensive optical components, can be subtracted numerically, enhancing image quality and resolution. Such aberrations normally distort the light wave front and induce
Figure 3: STEVE interface screenshot. The panel on the left offers a 2D viewer of the 96 z-stacks that compose the 3D image on the right. In the center, the Panel Viewer constitutes a fingerprint of the analyzed cell. In the x-axis refractive indexes are reported, while the y-axis shows the gradients. On the bottom (Control Field) the user can chose the color to apply to each cell part in order to produce the 3D reconstruction and modulate its transparency.
Figure 4: Living mouse fibroblastic reticular cell obtained with the 3D Cell Explorer. Nucleus is marked with violet, nucleolus in gold, membrane in pink, and lipid vesicles in green. Scale bar = 10 µm.
optical distortion in the reconstructed image. However, because these distortions are predictable and tied to a specific set of optical components (mirrors, objective, etc.), they can be accurately measured and calibrated for each model of the 3D Cell Explorer, allowing automatic digital corrections to be applied. Thus, considering green light (520 nm) and an
NA of 0.8, the Abbe limit would be roughly d=0.5*λ /NA=325 nm. Using the correction scheme above, the 3D Cell Explorer can reach 200 nm.
Results
Fibroblastic reticular cells.
The first prototype of the 3D Cell Explorer was delivered in 2014 to the Laboratory of Lymphatic and Cancer Bioengineering (LLCB) at the École Polytechnique Fédérale de Lausanne in Switzerland. This group uses the microscope to study how T-cells interact with lymphatic endothelial cells and the morphological changes this interaction involves. Moreover, they want to compare this specific interaction with the one between T-cells and other stromal cell types to determine the dynamics of such interactions. Cells were observed over 30 minutes at RT in transparent cell culture media composed of 1×PBS, 1 g/L glucose, and 25 mM HEPES. One image per second was recorded, and the result- ing video (60×speed) shows the interaction of a T-cell (the smaller cell) with a lymphatic endothelial cell (the bigger cell) expressing an antigen (https://www.youtube. com/watch?v=bWhiOmtdXEU). Figure 4 shows the 3D recon- struction of a living mouse fibroblastic reticular cell obtained with the 3D Cell Explorer. The cell nucleus, nucleolus, lipid vesicles, and membrane were stained in contrasting colors. Digital staining can also be accomplished for each frame of a video sequence. Figure 5 shows four stills from a video of a mouse fibroblastic reticular cell in the process of dying.
Comparison with traditional methods. The 3D Cell Explorer
can be used for routine cell analysis such as the identification of different cell parts in 3D.
Figure 6a shows an example of a standard immunostaining procedure, which requires expen- sive reagents and long procedures to stain the nucleus and membrane respectively with DAPI and GFP labeled antibody. The same results that required more than 4 hours of preparation with traditional fluorescence microscopy were achieved with the 3D Cell Explorer in less than five minutes (Figure 6b).
Figure 5: Four stills from a video of a mouse fibroblastic reticular cell in the process of dying. Times of the frames are (a) 0 hours, (b) 2.7 h, (c) 7.8 h, and (d) 9.8 h. Scale bar = 10 µm.
Figure 6: Comparison between (a) a fixed mouse fibroblastic reticular cell (FRC) imaged with a traditional fluores-cence microscope in 2D and (b) the same cell type with the 3D Cell Explorer in a 3D dataset. Scale bar = 10 µm.
Cancer cells. The second prototype was delivered in 2015
to Harvard Medical School where the group of Dr. Clemens Grassberger is studying how gold nanoparticles make tumors
more susceptible to radiation. Gold nanoparticles refract the light in a specific way, and the 3D Cell Explorer can provide a 3D image of the cell and determine the fractions of the nanoparticles within the cell. It is not known so far where exactly these gold nanoparticles accumulate in the cell. This microscope could help in identifying which tumor cells take up the gold nanoparticles. The first results obtained with the microscope in this study are encouraging but too prelim-inary to be published.
Figure 7 shows a dividing breast cancer cell provided to us by Dr. Grassberger. The cells in this case were fixed with 4% PFA. The image shows the loss of internal structure typical of cancer cells, together with a large and irregular nucleus (pink). For this image the cell membrane was not visible, probably because of damage from fixation. Internal vesicles are stained in blue and green according to slightly different refractive indices.
Sperm cells. A potential application is related to in vitro
fertilization, a common clinical procedure with a low success rate: less the 30%. This is mainly due to a lack of contrast on sperm cells that are selected through observation with traditional white light microscopes because conventional staining of cells for human applications is not allowed. Nanolive’s technology enables a deeper analysis of the morphology of these cells (Figure 8) and thus a more accurate selection. This may lead to an improved success rate for this routine procedure.
Yeast cells. Smaller cells can be observed with the
Nanolive’s technology. Figure 9 shows a few living yeast cells imaged in 1×PBS where the nucleus, vacuole, and membrane are stained in yellow, red, and blue, respectively.
Figure 8:Comparison between (a) a classical 2D image of a fixed sperm cell obtained with a traditional phase contrast microscope and (b) a 3D image of a fixed sperm cell taken with the 3D Cell Explorer. The nucleus and membrane were digitally stained by the software. These images were taken at the IVF center at Hopital Cochin, Paris. Scale bar = 5 µm.
Figure 9: Living yeast cells imaged with the 3D Cell Explorer. Organelles have been digitally stained to reveal the nucleus (red), vacuoles (purple), and cell membrane (blue). Scale bar = 5 µm.
Figure 7: Fixed breast cancer cell caught during division. The abnormally large nucleus (pink) and the disorganized cytoplasmic vescicles (blue-green) are highlighted in the image. Scale bar = 5 µm.
Discussion
The cell is considered to be the smallest and most basic living entity. It is therefore crucial to explore and analyze it in order to understand the basis of life. The ability to see the cell without killing it, in 3D, and to identify its interior parts in color opens new avenues to further explore cells. Eventually, researchers will be able see and measure the impacts of drugs and stimuli on the cell.
Nanolive uses harmless light, which allows the researcher to “see” directly inside living cells in 3D, without any special preparation and without altering the cell integrity. It shows the cell from inside in real time thereby allowing observation of dynamics taking place within it. Thus, the internal pressures and external interactions of cells can be studied in a user-friendly way on mobile devices. Researchers also can upload their cell images to a dedicated cloud library, which will help them compare their data with pre-existing acquisitions from around the globe.
The technology behind this method is quite complex. Holography offers a new means of probing cells in their native environment that is label-free, non-invasive, manipu-lation-free, and interference-free. Rotational scanning allows real 3D reconstruction, noise robustness, and a resolution enhancement. The balanced combination between the high resolution (200 nm) of the system and the high sensitivity for different refractive indices (increments of 0.001) opens opportunities for seeing living cells with nanometric details.
It allows measurement of cellular processes in situ with real-time kinetics, enabling multi-parameter analysis at single-cell and sub-single-cellular scale.
Because the device does not require special sample preparation (no chemicals, no staining), and thanks to its straightforward handling, the 3D Cell Explorer gives researchers a head start for many applications: in-vitro fertilization, cell division, cell differentiation, bacteria identification, cell death, etc. Perhaps the most exciting application is the potential for monitoring the effect of drugs on patient-specific cells as an important part of the development of personal medicine.
Conclusion
Described here is a new technique for the analysis and differentiation of cell components without the need for conven-tional staining. Changes in refractive index within the cell itself provide the contrast for labeling various organelles with high precision and at a high resolution. The method can be applied to the 3D examination of living cells under various external stimuli or drugs.
References
[1] Cotte et al., Nature Photonics 7 (2013) 113–17. [2] D Gabor, Nature 208(5009) (1965) 422–23. [3] Cotte et al., J Biomed Opt 16(10) (2011) 106007. [4] AJ Devaney, Opt Lett 6 (1981) 374–76.