. Experience with the milk quota system in Switzerland
PETER RIEDER*
Institute of Agricultural Economics, Federal Institute of Technology, Zurich, Switzerland
Summary
The individual farmers' reactions have been threefold; they have made requests for higher quotas; they have filled up the quotas where gaps were available; and they have changed their production structure. The last-mentioned reaction was characterized by a reduction in the number of cows, by the production of more fodder crops and by heifer production in the plain region. Traditional heifer-producers in the mountain area reacted with a higher milk and beef production. As a consequence, the division of labour between plain and mountain regions in milk and heifer production is diminished.
1. Introduction
"
Switzerland introducedthe milk:quotasys~em eight years ago. The purpose of this paper is to report on our experiences and to study its effects. This will be done by examining administrative problems, the politics of agricultural interest groups and the reactions of the producers. Finally, we will analyse governmental behaviour during this period.
The milk-quota system was introduced because the public costs of milk pro-duction had become too high. Although it was originally drawn up as a short-term measure, it rapidly became a 'normal' instrument of Swiss agricultural policy.
A shortcterm evaluation concentrates on the problems of the stabilization of milk-policy costs and the executive problems. If both aspects are fulfilled, people generally consider the measure to be successful. Normally even producer
*
The majority of this paper has been drawn from unpublished works by U. Berneggerand L. Meyer, Institute of Agricultural Economics, Zurich.
Euro. R. agr. Eco. 12 (1985), 473-479 0165-1587/85/0012-0473 $2.00 © Mouton Publishers, Amsterdam
prices can be raised more than elsewhere. Has this been happening in Switzerland during the last eight years and what have been the long-term effects?
2. Goals of the quota system and the related costs
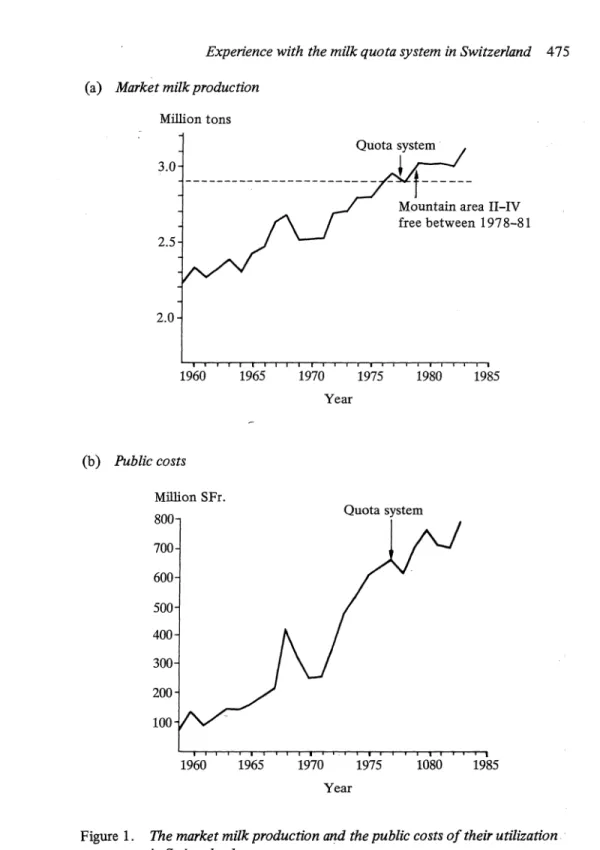
In 1976, the farmers delivered 2.8 million tons of milk. The aim of the quota system was to reduce this amount to 2.7 million tons. This figure has been increased during the implementation period to 2.9 million tons, and around 3.1 million tons are now distributed as a result of the single quotas. Reasons for this increase will be discussed later.
The public costs for the processing and marketing of the produced milk also increased continuously after the implementation of the quota system. There were cost reductions for a short time, but then costs increased again. Figures 1a and 1 b show the increases in amount of milk and the related public expenditures for the utilization of the milk.
3. Behaviour of the participants
The participants of the milk-quota programme are the milk producers, their organizations and the ·government. Each of these participants behaved in a specific way during the time observed.
3.1. Behaviour and influence of the milk producer organization
The support of the national milk producer organization was essential for imple-menting the quota system in Switzerland. Traditionally, in Swiss agricultural policy, central organizations are engaged in executing aspects of marketing orders. The organization of milk producers was given the governmental order to implement the milk-quota system. Certainly the government did keep the fmal decisions concerning the rules for distributing quotas to the individual producers in its hands. But, because of this, the organization of milk producers, of course, had a strong impact upon the rules of distribution. These had to be accepted by both the government and the organization.
The milk producer organization is very heterogeneous. There are groups with different interests, e.g. farmers from the plain region, from the grassland region, from the mountain region as well as the milk processing industry.
Given the fact that the milk production had grown rapidly before the imple-mentation of the quota system, there were farmers with high and those with rather low production levels. This situation in the reference year (1975/76) was the result of a short-run supply reaction of the plain region farmers caused by milk price increases since 1971.
(a) Market milk production Million tons 3.0 2.5 2.0 1960 1965 (b) Public costs Million SFr. 800 700 600 500 400 300 200 100 1960 1965 1970 1975 Year
Mountain area II-IV free between 1978-81
1980 1985
Quota system
1970 1975 1080 1985 Year
Figure 1. The market milk production and the public costs of their utilization in Switzerland
milk processing industry because the latter had built up its capacities a~ well. As a result, the most important groups of milk producer organizations obtained de facto a distribution of the quotas without reducing the amounts of milk they were already producing. The distorted production structures of 1975/76 became fixed. Some changes in distribution occurred within the local milk cooperatives, by the fixation of an upper limit of milk per hectare which could be delivered. Additionally, for the calculation of the quota per farm, the whole acreage was used to compare the farm's milk production per hectare with the local co-operative average. This means the more cash crop produced, the larger the absolute milk quota per farm could be requested. By the way, the acreage of vineyards was excluded while the intensive orchards were included! There is no milk lobby in the important wine regions.
The mountain region represents a minority in the national milk producer organization. Therefore their representatives have chosen another way to influence the regional distribution of the quota. They ordered parliamentarians to intervene directly in the parliament and the government. Their intervention was successful, arguing that the incomes of the mountain farmers would decrease because of decreasing prices for heifers which usually are sold by the mountain farmers to their colleages in the plain region. As a result, the quota system was given up in the mountain region and the milk production went up by one third within the three years! The quota system had to be reintroduced in the mountain region on the correspondingly higher level.
Summarizing, the national milk producer organization has had a strong impact on the total quota and on the manner of the implementation of the system. However, the quota system has also individualized the interest situation of farmers. As a result, there still are individual farmers whose interests are neither covered by their organizations nor by the government. Neglecting this part, both - organizations and government -are satisfied with the implemen-tation of the quota system. But let us now focus on the government's behaviour. 3.2. The role of the government
For implementing the milk-quota system, the government was dependent on the help of the milk producer organization. This means that interests of the dominant producer groups could not be neglected. Otherwise the system would have been jeopardized.
The government's main goal - as mentioned above - was to cut the public expenditures for rising milk surpluses. During a public voting campaign on this subject the government argued that it would be possible to increase the pro-ducer's milk price after having introduced the quota system. Indeed the milk price was raised between 1976 and 1983 by about 25% in order to partly fulfill the farmers' income claims. During the same period, export prices for milk products, especially for cheese, have fallen. For these reasons the public expenditures have been growing steadily as shown in Figure 1 b.
3.3. The reactions of the individual milk producer
The individual farmers reacted to the introduction of the milk quota system in three ways, namely (I) by requests for higher quotas, (2) by filling up the quotas where gaps were available and (3) by changing their production structure. First reaction:requests for higher milk quotas per farm
The implementation of the quota system took place in two stages. In the first stage each farmer received a quota based on his production during the reference years of 1974-1976. In the second stage, the former quotas were adapted by taking into account the acreage of the farms and the average milk yield of the local producers' cooperative. The result was a small redistribution of the quotas on the local level.
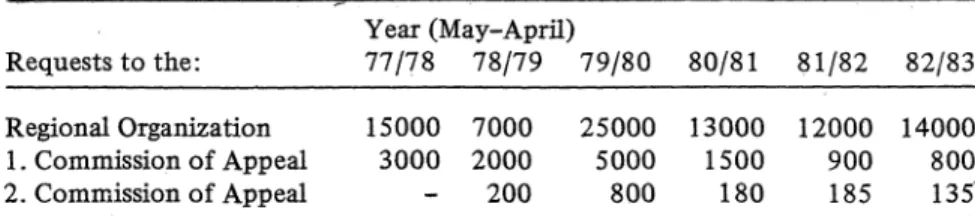
The second phase, in particular, was accompanied by many request possi-bilities. It was well known to each farmer, which arguments would be taken into account by evaluating his request. As shown in Table 1, a large number of the 70,000 milk producers asked for higher quotas.
Table 1. Requests and appeals for higher quotas per farm Year (May-April)
Requests to the: 77{78 78/79 79/80 80/81 81/82 82/83 Regional Organization 15000 7000 25000 13000 12000 14000 1. Commission of Appeal 3000 2000 5000 1500 900 800
2. Commission of Appeal 200 800 180 185 135
Source: . Sechster Landwirtschaftsbericht (1984 ).
This procedure has two aspects: on the one hand cases of undue hardship could be solved, on the other hand many farmers were given higher milk quotas with-out really needing them. Professional journals supplied the farmer with the information on whether he would qualify for a higher quota or not. The pro-cedure dealt with each farmer in the same manner, but it is questionable whether justice always means equity as well.
An alternative to this closed and well-defmed request system would have been an open one with more competence of the request- and appeal-commissions.
Second reaction: filling up the quotas
A result of the chosen reques.t system is that on the individual farms differences between quota and the effective production level often existed. In time, the farmers filled up these gaps for three reasons: First, the possession of a quota is - economically speaking - a property right. It can be capitalized through land sales or rents. Second, the farmers feared loosing unused quotas. Third, the milk prices were increased steadily by the government, so that milk production
became more and more profitable. Summarizing, it can be said that the reactions of the farmers are economically explainable.
Third reaction: changes in the agriculture structure
The changes in the agricultural structure after having introduced the milk-quota system are the theoretically expected ones~ Some ·of these changes are discussed here. To understand the observed changes, we need some basic infor-mation about Swiss agriculture: Milk production is about 31%, beef production 19%, hog production 19%, and cash crops about 8% of total agricultural pro-duction value. The regional distribution is governed by natural conditions. In the plain region we have predominantly milk production, beef production and cash crops. The farmers in the mountain region produce heifers and milk. The heifers are sold to milk producers in the plain areas. As a result, the reactions in these two main regions differ strongly.
With a regional dynamic simulation model (Bemegger, 1984; Lehmann, 1984) we isolated the influence of the milk-quota system. The results of this model explain very well the changes in the use of farm acreage. The plain farmers mainly increase fruit plantations, partly cash crops and also hog pro-duction. We point out that the production of fodder crops for own farm use increases heavily. Sugarbeet and rape acreage extend according to the increase of the quotas given for these products.
The changes in the dairy and beef herds during the six years between 1978 and 1983 are very important. Table 2 contains some indications. We have to Table 2. Development of cattle-herd structure in the plain and mountain
region, 1978-1983
Plain Mountain
Switzerland Region Region Herd structure 1978 cattle 2,023,700 77.5% ~2.5% cows 892,800 80.2% 19.8% heifers 167,100 64.1% 35.9% beef production 184,700 96.8% 3.2% rearing rate 0.19 0.15 0.34 Changes 1978-1983 cattle -4.5% -5.3%
-
1.6% cows -5.5% -7.2% + 1.4% heifers -6.1% -3.6% -10.4% beef production +8.4% +6.1% +78.0% rearing rate -0.6% +3.9% -11.7%distinguish between the plain and the mountain region. The plain farmers reduced the number of cows by 7%. Their rearing rate per cow and their beef herds increased. The farmers in the mountain region reacted in two ways: to compensate for the reduced sales of heifers, they initially increased the milk production as long as they were free to do this. After the introduction of the quota system in the mountain region in 1981, they increased the beef pro-duction. This was the only way to use their grassland, although neither the farmers nor the natural conditions are well suited for this production. It is a short-term reaction of relatively immobile farmers to an implemented coercion. For political reasons, the government has to prevent a decrease in the income of the mountain farmers and therefore it increases the subsidies for the growing but inefficient beef production in the mountain area.
We may summarize our observations as follows: The farmers in the plain region increase their self-sufficiency on fodder crops and heifers which means a loss of efficiency by giving up an economic division of labour between plain and mountain regions. The consequences are higher production costs for beef and milk. The mountain farmers increase production branches which, considering comparative costs, are uneconomical. At the same time surpluses of products other than milk arise. The costs to subsidize those products are increasing as · well, and in the long run the social costs also increase.
REFERENCES
Bernegger U. (1984). Wirkungsanalyse agrarwirtschaftlicher Massnahmen im Testkanton fUr das Berggebiet. Ziirich: Institut fUr Agraxwirtschaft.
Bundesrat (1984). Sechster Landwirtschaftsbericht. Bern: EDMZ. Bundesarnt fiir Statistik (1985). Nutztierbestand der Schweiz. Bern.
Hauser H., Koch K., Stahel F. (1983). Die EinjUhrung der einzelbetrieblichen Milchkontin-gentierung in der Schweiz. Bern: Haupt.
Lehmann B. (1984). Ein dynarnisches Simulationsmodell als Instrument zur Wirkungs-analyse agrarwirtschaftlicher Massnahmen irn Talgebiet. Ziirich: Diss. ETH:
Peter Rieder
Institute of Agricultural Economics Federal Institute of Technology 8092 Ziirich