HAL Id: insu-00442797
https://hal-insu.archives-ouvertes.fr/insu-00442797
Submitted on 23 Dec 2009HAL is a multi-disciplinary open access archive for the deposit and dissemination of sci-entific research documents, whether they are pub-lished or not. The documents may come from teaching and research institutions in France or abroad, or from public or private research centers.
L’archive ouverte pluridisciplinaire HAL, est destinée au dépôt et à la diffusion de documents scientifiques de niveau recherche, publiés ou non, émanant des établissements d’enseignement et de recherche français ou étrangers, des laboratoires publics ou privés.
Spherulite crystallization induces Fe-redox
redistribution in silicic melt
Jonathan M. Castro, Elizabeth Cottrell, H. Tuffen, Amelia V. Logan,
Katherine A. Kelley
To cite this version:
Jonathan M. Castro, Elizabeth Cottrell, H. Tuffen, Amelia V. Logan, Katherine A. Kelley. Spherulite crystallization induces Fe-redox redistribution in silicic melt. Chemical Geology, Elsevier, 2009, 268 (3-4), pp.272-280. �10.1016/j.chemgeo.2009.09.006�. �insu-00442797�
Spherulite crystallization induces Fe-redox redistribution in silicic
melt
Jonathan M. Castro a, Elizabeth Cottrellb, Hugh Tuffenc, Amelia V. Loganb and Katherine A. Kelleyc, d
aISTO, UMR 6113 Université d'Orléans-CNRS, 1a rue de la Férollerie, 45071 Orléans cedex
2, France
bDepartment of Mineral Sciences, Smithsonian Institution, 10th and Constitution Ave. NW,
Washington, DC 20560, USA
cDepartment of Environmental Science, Lancaster University, LA1 4YQ, UK
dGraduate School of Oceanography, University of Rhode Island, Narragansett, RI 02882,
USA
Abstract
Rhyolitic obsidians from Krafla volcano, Iceland, record the interaction between mobile hydrous species liberated during crystal growth and the reduction of ferric iron in the silicate melt. We performed synchrotron µ-FTIR and µ-XANES measurements along a transect extending from a spherulite into optically distinct colorless and brown glass zones.
Measurements show that the colorless glass is enriched in OH groups and depleted in ferric iron, while the brown glass shows the opposite relationship. The color shift between brown and clear glass is sharp, suggesting that the colorless glass zone was produced by a redox front that originated from the spherulite margin and moved through surrounding melt during crystallization. We conclude that the most likely reducing agent is hydrogen, produced by magnetite crystallization within the spherulite. The Krafla obsidians dramatically capture redox disequilibrium on the micoscale and highlight the importance of hydrous fluid liberation and late-stage crystallization to the redox signature of glassy lavas.
Keywords: Obsidian; Spherulite; Oxidation–reduction; FTIR; XANES
1. Introduction
The chemical and physical processes in magma are influenced by the concentration and reaction of hydrogen-bearing components in the silicate melt. It is well known that the concentrations of molecular H2O and OH− groups, hereafter referred to collectively as
“water,” dissolved in magma govern the positions of mineral liquidus curves and melt viscosities; both rise dramatically, resulting in crystallization (e.g., Geschwind and
Rutherford, 1995) and melt stiffening (Hess and Dingwell, 1996), as magma degasses. The relationship between water and the ratio of ferric to ferrous iron in silicate melts remains an active area of research. In H2-buffered systems, the dissociation of water (e.g.,
H2O → H2 + 1/2O2, Mueller, 1971) controls oxygen fugacity (fO2); thus aH2O controls
Fe3+/Fe2+. The effect of water as a chemical component at fixed P, T, and fO2 is more
nuanced. The study of (Baker and Rutherford, 1996) suggested that the Fe3+/Fe2+ ratio increased with the addition of water; however, as discussed by (Wilke et al., 2005) and (Gaillard et al., 2001), the study of Baker and Rutherford was not at constant oxygen fugacity
(fO2). Experimental studies on rhyolite (Moore et al., 1995) and basalt (Botcharnikov et al.,
2005) indicate that water, as a chemical component in a melt held at fixed T, P, and oxygen fugacity (fO2), has no effect on the Fe3+/Fe2+ ratio. By contrast, other experimental studies
indicate that as the bulk water content in increases so too does the Fe3+/Fe2+ in the melt ([Gaillard et al., 2001] and [Gaillard et al., 2003b]). The relationship between water and iron redox state in natural magmas is thus an important factor to consider when reconstructing redox history of degassing magma (e.g., [Mathez, 1984] and [Burgisser and Scaillet, 2007]) or deciphering the oxidation states of magma source regions (e.g., Carmichael, 1991).
Most natural magmas crystallize and vesiculate during their ascent towards and emplacement at the Earth's surface. Because these phase transformations redistribute and ultimately release volatile components from the system, they can drive oxidation–reduction (redox) reactions that will alter the speciation of iron in the magma. Crystallization of silicate minerals that preferentially incorporate ferrous iron in their structures, such as olivine and pyroxene, result in a relatively oxidized melt residuum. The manner by which crystallization of non-ferrous minerals such as quartz and feldspar affects the residual melt redox state is currently
unknown; however, because these phases are anhydrous, their growth must redistribute water in the melt ([Castro et al., 2008] and [Watkins et al., 2009]), thereby influencing the chemical environment of iron (Gaillard et al., 2003c).
The release of H2 from magma, either through its continuous outward diffusion or by
liberation of H2 gas in bubbles is widely thought to oxidize lavas (e.g., [Sato and Wright,
1966], [Sato, 1978], [Mathez, 1984], [Candela, 1986] and [Holloway, 2004]). The diffusive transport of hydrogen out of the melt (m) and into bubbles (v) displaces the following
equilibrium to the right: 2FeO(m) + H2O(m) = H2(v) + Fe2O3(m). Crystallization of magnetite may
similarly alter the oxidation state of basaltic and silicic systems by the “auto-oxidation” reaction as defined by Holloway (2004):
The net effect of this reaction on system redox will be determined by the degree to which H2
gas exits the system. If the hydrogen escapes the magmatic system completely (e.g. to bubbles or the atmosphere), the system is left relatively oxidized. If the hydrogen is retained within the system, however, it may generate relatively reducing fluids adjacent to the zone of
crystallization as proposed by Holloway (2004).
Here we describe adjacent zones of oxidation and reduction on a scale of only hundreds of microns in Krafla obsidians. Our observations and measurements link spherulitic plagioclase, quartz, and magnetite crystallization to reduction of ferric iron in the rhyolitic melt (Fig. 1). We show that reduced, colorless glass rims jacketing spherulites could have been produced by the expulsion of molecular water from growing spherulites, followed by crystallization of magnetite and concomitant production of hydrogen. The result is a boundary layer of reduced melt that grows with time. Given the considerable sizes (> 1 m; Smith et al., 2001) and high volume proportions of spherulites in many rhyolitic lavas and ignimbrites (~ 90 vol.%; [Stevenson et al., 1994] and [Tuffen and Castro, 2009]; Tuffen et al., in review) the interplay of crystallization and microscale adjustment of oxidation states has important implications for the post-emplacement chemical evolution of spherulite-rich lavas.
2. Geological background
Spherulites are radiating, often concentrically arranged crystalline aggregates set in a glassy matrix (Fig. 1). They occur in obsidian domes, vitrophyric ash-flow tuffs (e.g., Smith et al. 2001), large-volume rhyolite flows such as those at Yellowstone (e.g., Wright, 1915), and in shallow volcanic conduits (e.g., [Stasiuk et al., 1993] and [Tuffen and Castro, 2009]).
Spherulites nucleate and grow in response to large undercoolings (> 200 °C) rapidly imposed on the magma by its degassing and quenching (e.g., Swanson et al., 1989). As dictated by the thermal profile of a magma body ([Manley, 1992] and [Tuffen et al., in review]), spherulitic obsidian develops in spatially restricted zones (e.g., [Manley and Fink, 1987] and [Stevenson et al., 1994]), comprising a transitional facies that separates the rapidly quenched, outermost vitrophyric rhyolite from a devitrified microcrystalline core.
Anomalously high volatile contents exist within and just above the spherulitic zones in lava domes (e.g., Westrich et al. 1988). Castro et al. (2008) have recently shown that the OH− concentrations in glass around spherulites are elevated above the background level. They interpreted these OH− concentration gradients to reflect the combined advection and diffusion of H2O away from the growing spherulites and numerically modeled these processes in order
to estimate crystallization timescales. While their work confirms that spherulite crystallization drives volatile enrichment in silicic glass, it neither identifies the specific form of hydrous species ejected from the growing spherulite, nor constrains why an iron redox shift,
manifested as a sharp color difference in the obsidian matrix (Fig. 1), is superimposed on the OH− concentration gradient in the glass. In this paper, we use microscopic chemical and textural evidence collected from the same sample studied by Castro et al. (2008) to
demonstrate that regions of elevated OH− are linked to zones of iron reduction in the glass surrounding spherulites. This in turn suggests that spherulite growth may cause changes in the Fe-valence state in rhyolite melt.
3. Analytical and experimental techniques
All analyses were made on a decimeter-sized obsidian sample collected from the Hrafntinnuhryggur ridge system on Krafla volcano, Iceland (Tuffen and Castro, 2009). Spherulite mineralogy was determined by 1) microscopic observation, 2) sample magnetism to identify Fe-oxides as magnetite, and 3) compositional data from energy dispersive spectra (EDS) collected on a FEI NOVA nanoSEM600 FEG Variable Pressure Scanning Electron Microscope at the Smithsonian Institution National Museum of Natural History, operated at 7–12 keV, 5 mm working distance and beam current ranging from 0.5 to 1 nA.
Major element glass compositions were analyzed using a JEOL JXA-8900R electron microprobe (EPMA) running software with ZAF corrections at the Smithsonian National Museum of Natural History. Analyses were performed with an acceleration voltage of 15 keV, a 10 µm beam, and a 10 nA beam current. Standardization was performed on the following natural mineral standards: Quartz (Si), Anorthite (Ca), Bytownite (Al), Microcline (K), Albite (Na), and Hornblende (Fe, Mg). A natural rhyolitic glass (VG568, Obsidian Cliffs, Yellowstone, USA) of known major element composition was periodically analyzed to check for instrument drift.
Determination of ferrous iron content was via wet chemical analysis of a powdered (grain size ~ 180 µm) obsidian aliquot chipped from the same mass of sample on which all other measurements and observations were made. We attempted to separate out spherulite
fragments from the glass powder. However, some glass-encrusted spherulites may have been over looked. Furthermore, it was not possible to separate the thin, clear glass halos from the pervasive brown glass. Thus, these measurements provide an average FeO concentration for the bulk brown glass with very minor dilution by the clear glass fraction. A total of nine (9) analyses were performed following the technique of Peck (1964) with some minor
modifications in order to minimize oxidation during sample digestion. Digestion began in 8 ml of fluoroboric acid (HBF4) for 30 min in the ultrasonic bath. We then added 5 ml HF and 2 ml extra of HBF4 to the solution and completed the digestion under heat for
approximately 10 min. Three ferrous iron determinations were also made on the U.S.G.S. Glass Mountain Rhyolite standard RGM-1, which yielded a mean value of 1.19 wt.% FeO ± 0.03 (1σ). The nominal value for RGM-1 is 1.18 wt.% FeO.
H2O concentrations were determined by synchrotron-FTIR at the Advanced Light Source,
Lawrence Berkeley National Laboratory. Measurements were made along traverses oriented perpendicular to the spherulite–glass boundaries on a Thermo Nicolet Magna 760 FTIR spectrometer interfaced with a NicPlan IR microscope (at beamline 1.4.3). The IR beam has a diffraction-limited diameter of about 3 µm. The uncertainty in spot position is ± 2 µm.
Transmittance spectra were obtained over the mid-IR (1400–4000 cm− 1) to the near-IR
(3700–6500 cm− 1) regions with MCT detectors, KBr beam-splitters, and the synchrotron light source. 128 scans were used to obtain each spectrum and these spectra were corrected by subtracting a background spectrum collected every hour. We determined OH− concentrations from the intensity of the broad 3570 cm− 1 absorption band, utilizing an absorption coefficient of 100 L mol cm− 1 (Newman et al. 1986). We estimate the analytical uncertainty of OH−
concentration to be ± 10% of the measured value.
The oxidation state of Fe in the glass was determined at the microscale using Fe K-edge X-ray Absorption Near Edge Structure (µ-XANES) spectroscopy. The area-weighted average
energy of the two pre-edge peaks, or centroid, shifts to higher energy as the ratio of ferric to ferrous iron increases, allowing quantification of Fe3+/∑Fe in silicate glasses (e.g. [Berry et al., 2003], [Wilke et al., 2005] and [Cottrell et al., 2009]). Commensurate with this, the intensity of the peak corresponding to Fe3+ (at higher energy) grows proportionately larger relative to the intensity of the peak corresponding to Fe2+ (at lower energy); thus the ratio of peak intensities can also be used to quantify oxidation state ([Wilke et al., 2005] and [Cottrell et al., 2009]).
Spectra were collected in fluorescence mode using a 9 element Ge array detector and a silicon channel-cut (311) monochromator at station X26A (bending magnet) at the National
Synchrotron Light Source (NSLS), Brookhaven National Lab. The spot size on the sample was 9 × 5 µm. Spectra were recorded from 7020 to 7220 eV with a 0.1 eV step over the pre-edge from 7106 to 7118 eV at 5 s dwell. The pre-pre-edge was deconvolved from the background absorption edge by simultaneously fitting the background with a damped harmonic oscillator function plus a line constrained to have a positive slope and the pre-edge features with two Gaussian peaks. The oxidation state of the glass was quantified using the empirical
calibrations in Cottrell et al. (2009) based on pre-edge peak intensity ratios measured on a series of 16 basalt reference glasses with Fe3+/ΣFe ratios (0.088–0.601) independently
determined by Mössbauer spectroscopy and 7 rhyolitic glasses with Fe3+/ΣFe ratios (0.238– 0.806) independently determined by wet chemistry (Moore et al., 1995).
We performed a heating experiment on Krafla obsidian in order to induce spherulite
from this crystallization. Two cubes (2 cm-on-edge) of obsidian were subjected to
temperatures above the rheological glass transition (~ 690 °C) in a Lindberg Blue horizontal tube furnace with an internal Cromel–Alumel (CR–AL) thermocouple positioned in the middle of the chamber. We also used an external inconel-sheathed CR–AL thermocouple connected to a digital display to monitor the temperature of the cube at a position close to the center of the cube. The cubes were placed on a ceramic plate at the middle of the chamber, directly above the internal thermocouple. Target temperatures were 770 °C and 870 °C. Only the 770 °C experiment yielded useful results as the sample heated to 870 °C vesiculated making comparisons with the natural unvesiculated sample impossible.
The temperature path comprising the heating, dwell, and cooling stages was established by running a temperature calibration experiment using an equal-sized “dummy” cube of obsidian with a 3 mm diameter hole drilled to the center of the cube to accommodate the external thermocouple. This procedure allowed us to know the approximate temperature–time path of the center of the cube during heat treatment. We did not drill the cubes on which textural and analytical observations were made because of the possibility that the sample might outgas into the thermocouple hole, thereby affecting the viscosity of the melt and hence the reaction kinetics at the dwell temperature. Heat treatment consisted of a ramp to the target temperature (770 °C) at a rate of about 65 °C min− 1. We observed a temperature overshoot of about 10 °C above 770 °C that took about 5 min to relax. Once the temperature had stabilized, we left the sample in the furnace for 90 min and then rapidly removed the cube in order to quench it with a cold blast of compressed air. We estimated the cooling time on the dummy cube by leaving the external thermocouple in the hole while cooling the sample. It took about 3 min for the sample to cool from 770 °C to 25 °C.
Following the experiment, we extracted a thin (~ 225 µm), doubly polished wafer from the center of the cube and examined the glass and spherulites near the center of that wafer. We also measured a water concentration profile (via FTIR) along a traverse extending from one of the spherulites in the wafer center. Due to a lack of obsidian starting material, we could not repeat the experiment at 770 °C.
4. Results
4.1. Analytical measurements
Fig. 1A is a photomicrograph of a natural spherulitic obsidian wafer that is the subject of the measurements discussed in the following paragraphs. The spherulites in this sample are composed of plagioclase and quartz (~ 95 vol.%), and minor amounts of clinopyroxene (2– 3 vol.%) and magnetite (< 0.8 vol.%; Castro et al., 2008). All of the spherulites are enclosed in haloes of colorless to light brown glass, which separate them from the pervasive dark brown matrix glass. The transitions between brown and colorless glass tend to be sharp
around the larger spherulites (radii > 100 µm) whereas the boundaries are more diffuse around the smaller spherulites.
Fig. 1B shows a representative OH− concentration profile measured by Castro et al. (2008). The area under the profile is proportional to the amount of OH− groups in the silicate glass surrounding the spherulite. Castro et al. showed that the OH− concentration increases with the spherulite size, and typically matches the amount of water that would be ejected during complete crystallization of anhydrous minerals from a melt volume equal to that of the spherulite. Differences between the measured and predicted OH− contents show that some
spherulites retained water during their growth, consistent with the presence of glass and microvesicles (Castro et al., 2008).
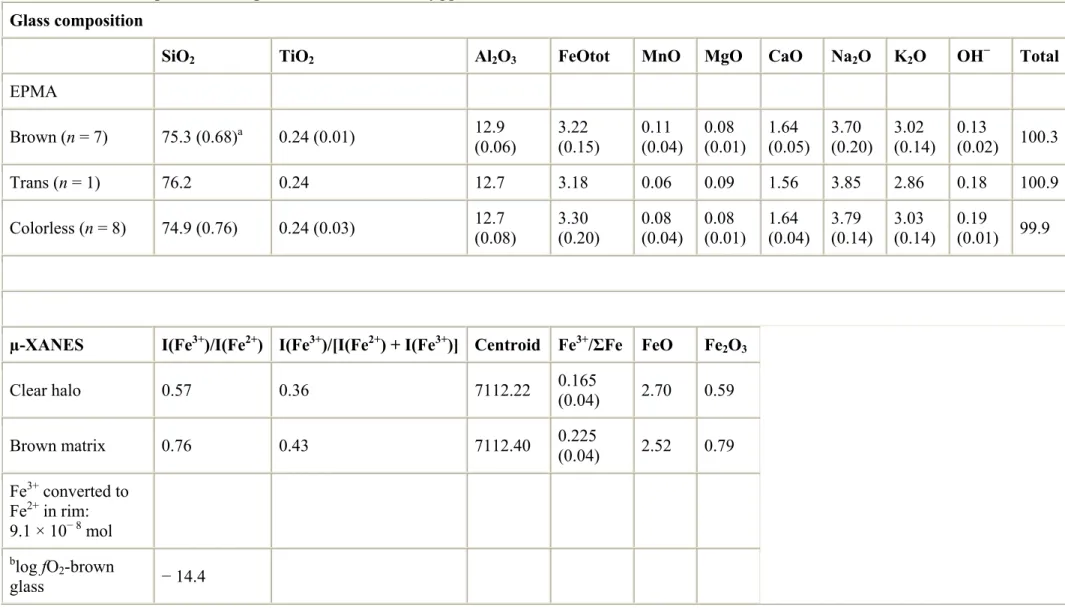
Table 1 shows representative major element glass compositions measured within and across the differently colored glass regions. These data show that the composition of glass in the colorless halo, the transitional zone, and the distal brown glass surrounding the spherulite in Fig. 1A are indistinguishable within analytical error. Most importantly, there is no discernable change in the total iron content as the spherulite–glass boundary is approached; i.e., glass color is not a function of the total iron content but rather the ratio of ferric to ferrous iron. Fig. 2 is a graph showing the major element compositions of glass along a line traverse emanating from the spherulite shown in Fig. 1A.
The color difference between the halo and distal glass in the natural sample was suspected to reflect the proportions of ferric and ferrous iron, with the darker brown glass having more ferric iron than the light-colored glass ([Gaillard et al., 2002], [Donald et al., 2006] and [Moriizumi et al., 2008]). This hypothesis was confirmed with μ-XANES measurements. Spectra were collected on the spherulite shown in Fig. 1A both within the clear glass rim, approximately 20 μm from the spherulite–glass border, and in the far-field brown matrix glass where the OH− concentration flattens out, about 330 µm from the spherulite edge. Fig. 3 shows the raw pre-edge spectra, model components, and total model fits to the spectra. The spectrum taken in the distal brown glass (spot 2) displays a proportionately larger Fe3+ peak, indicative of a greater contribution from ferric iron. This can be seen even more clearly in Fig. 3C when the baseline-subtracted spectra are superimposed. Quantitatively, the centroid (area-weighted average of the two pre-edge peaks) shifts to higher energy by 0.18 eV moving from the clear rim to the distal brown glass. Consistent with this, the ratio of pre-edge peak intensities (i.e. I(Fe3+)/I(Fe2+)I(Fe3+)/[I(Fe2+) + I(Fe3+)]) shift to reflect a greater contribution from ferric iron in the distal brown glass than in the halo, consistent with a relative change in the ratio of Fe3+/∑Fe of 0.06. The µXANES results clearly indicate a difference in the relative Fe-oxidation state of the two glass regions, with the clear glass halos demonstrably reduced relative to the brown matrix glass. The absolute ferric iron content determined for the distal brown glass (Fe3+/∑Fe = 0.23 ± 0.04) compares favorably with, but is more reduced than, the wet chemical determination of Fe3+/∑Fe = 0.29 ± 0.02, whereas Fe in the clear brown glass is more reduced (Fe3+/∑Fe = 0.17 ± 0.04).
4.2. Experimental results
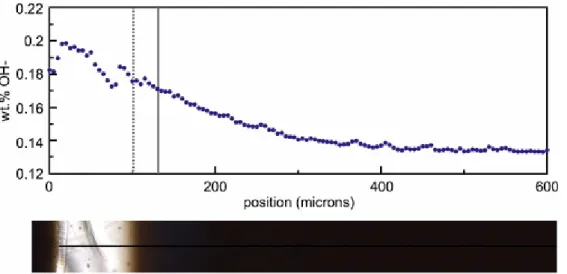
The optical character and OH− concentration of the heated obsidian are shown in Fig. 5 and Fig. 6. To aid comparisons with the natural state, we also include images of unheated
spherulite–rim combinations collected on the spherulite shown in Fig. 1. The transmitted-light photomicrographs were taken at the same illumination and focal depth, and the imaged wafers were about the same thickness.
The salient features and changes in the heated sample are: 1) thin, ~ 10 µm wide veneers of plagioclase (identified with EDS on an SEM) jacketing all spherulites in the sample, 2) thin brown fringes composed of glass, plagioclase, and magnetite crystals located just inboard of the plagioclase veneers, 3) the colorless glass rims became brighter, and on their outer periphery, thin, light brown glass zones developed that appear to have propagated toward the spherulites, 4) circumferential cracks formed parallel to the colorless–brown glass boundaries, in some cases directly on them, and 5) along many of these cracks, small, ~ 10–30 µm,
The most apparent changes that occurred during the heating experiment were crystallization and brightening of the colorless haloes (Fig. 5A,B). That the crystallization was “new” is indicated by the fact that none of the unheated spherulites have a jacket of feldspar around them. The crystallization rate implied by the amount of new plagioclase (~ 1.7 × 10− 9 m s− 1; i.e., width of plagioclase veneer divided by the experiment time) is similar to the average value (~ 1.9 × 10− 9 m s− 1) determined by Castro et al. (2008) from their diffusion models at 800 °C.
The circumferential fractures and small vesicle trains resulted from processes occurring, respectively, below and above the rheological glass transition (Tg). At the given heating rate,
the sample reached Tg (~ 700 °C; Castro et al., 2008) in ~ 10 min. During this short time the
glass may have fractured due to its greater thermal expansion compared to the mineral phases in the spherulite. If this were the case, then fractures formed in tension as the expanding glass pulled away from the spherulite. Once the fractures formed, and the glass passed through Tg,
bubble nucleation occurred preferentially along the fractures, which channeled volatile components to the growing bubbles. The cracks apparently served as conduits for degassing of the volatile-enriched boundary layers. An FTIR profile (Fig. 6) measured across one of these fractures indicates that the dissolved OH− content decreases in the vicinity of a fracture, suggesting degassing into that fracture.
5. Mechanism of Fe-reduction during crystallization
It is clear from the geometry of the colorless glass haloes, specifically their proportional increase in width with spherulite size (Fig. 4), and their mimicking of the spherulite shapes, that the colorless glass rims resulted from the growth of the spherulites. The µ-XANES spectra indicate that some (~ 5–7% absolute or 26% relative) of the ferric iron in the glass adjacent to the spherulites has been reduced to ferrous iron (Fig. 3). In this section we address how these redox changes could have occurred in light of the analytical and experimental evidence.
We first consider the possibility that the heterogeneous ferric–ferrous iron distribution in the glass is related to the cooling history. Métrich et al. (2006) showed that the ferric–ferrous ratio in peralkaline rhyolitic glass inclusions appeared to increase upon slow cooling over several hundred °C in high temperature µ-XANES experiments. They attributed the apparent oxidation in XANES spectra upon cooling to a change in the coordination environment of iron; high temperature favors tetrahedrally coordinated ferrous iron while lower temperatures stabilize octahedrally coordinated ferric iron. Métrich et al. conclude that the XANES spectra of slowly cooled samples will appear more oxidized due to this coordination shift. To account for the reduced halos in the spherulitic obsidian, the reduced halos would have had to cool much more rapidly than the more oxidized distal brown glass, which is physically unlikely because latent heat liberated from the growing spherulites would have slowed cooling of the melt adjacent to the spherulite (Tuffen et al., in review). Moreover, the color change in the glass supports a real difference in the oxidation state of iron, not a coordination change. For these reasons, this mechanism was probably not important for the formation of the colorless rims.
We next consider the possibility that the reduced-Fe signature in the rims arose from the late-stage crystallization of magnetite. The distribution of magnetite within spherulites, mainly as radial aggregates sandwiched between larger domains of plagioclase and quartz (Fig. 1), suggests that magnetite grains formed in the latest stage of crystallization, from an interstitial
melt that would have been enriched in water, further stabilizing magnetite (Sisson and Grove, 1993). Magnetite crystallization could act to reduce the melt adjacent to the spherulite via two potential mechanisms. First, hydrogen produced by magnetite crystallization in the presence of water (i.e., “auto-oxidation,” Reaction (1)) would necessarily diffuse out of the spherulite, and would have subsequently reduced ferric iron in the neighboring melt. Second, magnetite crystallization alone will reduce iron in the glass residuum by virtue of its higher
ferric/ferrous ratio (just as olivine crystallization would raise the ferric/ferrous ratio). We show below that either mechanism, or both in concert, could have generated the reduced halos.
“Auto-oxidation” as described by Holloway (2004) may proceed in hydrous silicates when magnetite with a higher ferric/ferrous ratio than the melt from which it is crystallizing becomes stable. Pure end-member magnetite has a Fe3+/∑Fe of about 0.67, compared to the
value of 0.22–0.29 in the brown glass; therefore magnetite precipitation could have resulted in “auto-oxidation” in this hydrous lava from Krafla. In this scenario, magnetite precipitation proceeds through the consumption of water, generating one mole of H2 for every mole of
magnetite crystallized (Reaction (1)). If H2 leaves the system completely through degassing
along fractures, the remaining material is left relatively oxidized. As H2 diffuses through a
melt, however, it necessarily results in a reduction front. We believe that these spherulites capture this disequilibrium state.
Simple mass balance arguments confirm the plausibility of this scenario. The modal
proportion of magnetite in the spherulites, determined by BSE image analysis on 10 different spherulites, is about 0.3 vol.% (± 0.12). The amount of Fe3+ now residing in the magnetite
grains within the large spherulite pictured in Fig. 1A is about 0.003 mg Fe3+ (5.4 × 10− 08 moles of Fe3+), and because these magnetite grains contain some Ti (Castro et al., 2008), this estimate of Fe3+ in magnetite is a maximum. If all of the Fe3+ residing in the magnetite were created by oxidation of Fe2+ in the liquid, magnetite crystallization would produce a
maximum of 2.7 × 10− 8 moles of H2 via Reaction (1). This hydrogen could, in turn, reduce
5.4 × 10− 8 moles of ferric iron (i.e. 0.003 mg) in the adjacent melt (and produce water) according to:
Subscripts above refer to: (s)—spherulite and (m/g)—melt/glass. If all of the H2 were
transferred to the 100 µm halo jacketing the spherulite in Fig. 1A, it would shift the
percentage of Fe3+ from ~ 22% (measured via XANES) to 9%. We observe Fe3+ in the halo equal to 16% (Table 1), indicating that “auto-oxidation” within the spherulite could actually be responsible for iron reduction in the halo. This calculation is a maximum because it assumes that 100% of the ferric iron in the magnetite had to be converted from FeO (i.e. Reaction (1)). We observe, however, that the brown glass contains about 22% ferric iron. Assuming that Reaction (1) proceeded at 78% efficiency (i.e. 22% of the ferric iron incorporated into the magnetite was already ferric), we still find that the percentage of Fe3+ would drop to 11%. Within the error of the XANES measurements, the uncertainty of the reaction efficiency and mass balance, and even taking into account that the magnetite is Ti-bearing, this scenario remains plausible.
The auto-oxidation scenario is also corroborated by the high concentration of water in the halos. We observe the number of moles of “H2-equivalent” water currently residing in the
measured by FTIR) equal to 5 × 10− 8. This is ~ 45% higher than the number of moles of H2
expected from magnetite crystallization via Reaction (1). We therefore observe more “water” (hydroxyl and molecular) in the glass surrounding these spherulites than produced by
magnetite crystallization. This “excess” water likely reflects water extruded as an
incompatible component from minerals growing within the spherulite (e.g., [Castro et al., 2008] and [Watkins et al., 2009]).
A second mass balance argument can be made that magnetite precipitation alone (i.e. not relying on the presence of water) could have caused the reduction halos. Magnetite
incorporates iron in a ratio of 2Fe3+:1Fe2+. Only 0.4% magnetite crystallization (as a percent of the volume of glass now occupied by the reduced halos) is required to cause the ferric iron to decrease from ~ 22 to the observed value of ~ 16%. If we assume that all the magnetite in the spherulites utilized components from the volume of glass now occupied by the reduced halos, we would expect 0.7% crystallization (which would reduce the ferric iron to 11%). If we assume that all of the magnetite in the spherulites crystallized from the combined volumes of glass now comprising the spherulites plus the reduced halos, we would expect 0.3%
crystallization (which would reduce the ferric iron to 18%). These two values therefore bracket the maximum and minimum extents of magnetite crystallization, and either extreme provides a reasonable mechanism by which the glass in the halos could have been reduced. Crystallization of 0.4% magnetite from the halo would simultaneously cause the total iron concentration (FeO) in the halo to fall from 3.2 to 2.8%. This is close to within the error of the microprobe measurements. Nevertheless, no decrease or gradient in the iron concentration is observed in the halos relative to the distal brown glass. This observation, combined with the demonstrable presence of water in the system and the likelihood of the auto-oxidation reaction proceeding, leads us to favor the auto-oxidation scenario as a means of generating the halos, but neither can be ruled out and in fact both could have contributed.
6. Experimentally induced Fe-reduction and spherulite growth
(Gaillard et al., 2003a) and (Gaillard et al., 2003c) simulated the process of hydrogen-flux iron reduction by exposing natural Fe-bearing rhyolitic melt and glass cylinders to reducing atmospheres of hydrogen and hydrogen–argon gas mixtures. Interestingly, their experiments produced many of the features we observe around the natural spherulites: 1) a sharp change in glass color bounding a zone of reduced Fe3+/Fetotal in hydrous glass, 2) sigmoidal OH−
concentration profiles emanating from the sample edge and attributable to hydrogen incorporation in the melt followed by diffusion of molecular water along the concentration gradient, and 3) an offset between the reaction front position and the point of elevated OH− in
the glass.
(Gaillard et al., 2003a) and (Gaillard et al., 2003c) proposed that because hydrogen is very reactive with iron in the silicate melt, the reaction front progress in the melt is governed by the solubility and diffusion of hydrogen in the melt. The effective diffusion rate of H2, in turn,
was limited by the fH2 of their experiments. Gaillard et al. observed that the rate of progress
of the reduction front (µm/h) was several orders of magnitude slower than the expected hydrogen diffusivity (µm/s) in the melt.
Gaillard et al. (2003a) performed time series experiments in order to characterize the rate of advancement of the reduction front with time. They observed a square root of time
dependence of the front position and, based on linear relationships between the square of the reduction front position and run duration, they extracted reduction rate constants, K = µ2/t,
where µ is the reaction front position, and t is time, for their experiments at 800 °C and a range of hydrogen fugacities (0.02–50 bars). They proposed that the reduction rate was limited by hydrogen incorporation, which in turn, is a function of the fugacity-dependent H2
solubility and diffusivity in the melt.
It is possible that the spherulites behaved in a similar manner, that is, they acted as hydrogen point sources to the neighboring melt. Although the boundary conditions are slightly different, e.g., the spherulites are an internal, as opposed to external hydrogen source, the empirical kinetic data of Gaillard et al. (2003c) can be used to assess whether the widths of the natural reduction rims are compatible with the timescales of spherulite growth. In other words, we assume that the reduction front started moving at the onset of spherulite growth and stopped when the growth ceased. By this simple scenario, the rim widths depend on the growth timescale, and therefore the duration that the expelled hydrogen had to react with the rhyolite melt according to the reaction rate constant K (Gaillard et al., 2003a).
Castro et al. (2008) estimated average spherulite growth rates by modeling the combined advection and diffusion of water away from the growing spherulites and fitting model profiles to the natural OH− concentration profiles. Even though their model did not account for
hydrogen incorporation in the melt and its unknown effect on the kinetics of H2O diffusion,
their growth rates match those determined experimentally on compositionally similar melts (e.g., Baker and Freda, 2001), and are probably accurate to an order of magnitude. According to their results at 800 °C the spherulites grew at an average rate of ~ 10− 9 m/s (Castro et al., 2008), which is similar to the rate determined in our spherulite growth experiments at 770 °C. Results of rim-width calculations are shown in Fig. 4. Individual spherulite growth timescales were determined by dividing the average growth rate (800 °C; Castro et al., 2008) by their spherulite radii. Using the individual growth timescales (t), we calculated rim widths (µ) using the relation µ = (K·t)1/2. The best match between the calculated and natural rim widths was attained with the K value derived from the lowest H2 fugacity (fH2 = 0.02 bar) in the
experiments of Gaillard et al. (2003a). We found a very large mismatch at their next highest
fH2 (~ 0.25 bar H2) and attribute this to the nearly one order of magnitude increase in K at
fH2 = 0.25 bar, which translates to comparatively rapid rim growth relative to the spherulite
growth timescales.
The agreement between the calculated and real Fe-reduction rim widths is good, suggesting that the natural rims could have developed under conditions of relatively low hydrogen fugacity (~ 0.02 bar according to Gaillard et al., 2003a). This match supports our hypothesis that it is molecular hydrogen that extrudes from the growing spherulite, thereby fluxing the ferric iron in the neighboring melt and causing the propagation of a redox front.
7. Conclusion
Our analysis indicates that the spherulitic growth of anhydrous phases can cause significant changes in Fe-oxidation state in the neighboring melt or glass around the growing crystals. Fe-redox reactions are driven by the liberation of hydrogen, and we propose that it is hydrogen produced as a product of magnetite crystallization. The result is an Fe-reduction reaction that propagates through the glass or melt with time. That spherulite crystallization can cause reduction of ferric iron in the silicate melt suggests that this phenomenon could prevent oxidation of silicic lavas during their emplacement despite extensive crystallization. For example, Carmichael (1991) indicates that voluminous post-caldera rhyolite lavas at
Yellowstone National Park, USA underwent little to no change in redox state compared to earlier-erupted ash flows. Carmichael (1991) used the apparent lack of oxidation of these lavas to support his hypothesis that “silicic magmas have redox states that reflect their source regions rather than H2 loss.” He further explained that the low bulk H2O content of the
post-caldera lavas could have suppressed the activity of the H2O as most of the water would be
speciated as OH groups (Stolper, 1982).
Spherulite crystallization is widespread in the interiors of the Yellowstone rhyolites ([Wright, 1915] and [Colony and Howard, 1934]), with some flows containing well over 50 vol.% spherulites (e.g., in the Nez Pierce flow). We suggest that the lack of variation in redox state may have been enabled by spherulite crystallization and local hydrogen solute rejection, but retention of generated hydrogen within the flows. Thus the conclusion of Carmichael (1991) that “silicic magmas with small amounts of iron and large amounts of water do not have their redox states reset” upon eruption may be a consequence of the offsetting effects of
crystallization and glass reduction.
Acknowledgements
We thank M.C. Martin for assistance with the SFTIR measurements and T. Gooding with sample preparation. Antonio Lanzirotti provided critical assistance at X26A, NSLS,
Brookhaven National Lab. We thank F. Gaillard and M. Rutherford for valuable discussions. Finally, we appreciate the help of Landsvirkjun and the staff at Krafla power station during our sampling campaign in Iceland.
References
Baker and Freda, 2001 D.R. Baker and C. Freda, Eutectic crystallization in the undercooled orthoclase–quartz–H2O system: experiments and simulations, European Journal of
Mineralogy 13 (2001), pp. 453–466.
Baker and Rutherford, 1996 L.L. Baker and M.J. Rutherford, The effect of dissolved water on the oxidation state of silicic melts, Geochimica et Cosmochimica Acta 60 (1996), pp. 2179– 2187.
Berry et al., 2003 A.J. Berry, H.S. O'Neill, K.D. Jayasuriya, S.J. Campbell and G.J. Foran, XANES calibrations for the oxidation state of iron in a silicate glass, American Mineralogist
88 (2003), pp. 967–977.
Botcharnikov et al., 2005 R.E. Botcharnikov, J. Koepke, F. Holtz, C. McCammon and M. Wilke, The effect of water activity on the oxidation and structural state of Fe in a ferro-basaltic melt, Geochimica Cosmochimica Acta 69 (2005), pp. 5071–5085.
Burgisser and Scaillet, 2007 A. Burgisser and B. Scaillet, Redox evolution of a degassing magma rising to the surface, Nature 445 (2007), pp. 194–197
Candela, 1986 P.P. Candela, The evolution of aqueous vapor from silicate melts: effect on oxygen fugacity, Geochimica Cosmochimica Acta 50 (1986), pp. 1205–1211.
Carmichael, 1991 I.S.E. Carmichael, The redox states of basic and silicic magmas: a
reflection of their source regions µ, Contributions to Mineralogy and Petrology 106 (1991), pp. 129–141.
Castro et al., 2008 J.M. Castro, P. Beck, H. Tuffen, A.R.L. Nichols and M. Martin,
Timescales of spherulite crystallization in obsidian inferred from water concentration profiles,
American Mineralogist 93 (2008), pp. 1816–1822.
Colony and Howard, 1934 R. Colony and A.D. Howard, Observations on spherulites,
American Mineralogist 19 (1934), pp. 515–524.
Cottrell et al., 2009 E. Cottrell, K.A. Kelley, A.T. Lanzirotti and R. Fischer, High-precision determination of iron oxidation state in silicate glasses using XANES, Chemical Geology (2009) 10.1016/j.chemgeo.2009.08.008.
Donald et al., 2006 S.B. Donald, A.M. Swink and H.D. Schreiber, High-iron ferric glass,
Journal of Non-crystalline Solids 352 (2006), pp. 539–543.
Gaillard et al., 2001 F. Gaillard, B. Scalliet, M. Pichavant and J.-M. Beny, The effect of water and fO2 on the ferric–ferrous ratio of silicic melts, Chemical Geology 174 (2001), pp. 255–
273.
Gaillard et al., 2002 F. Gaillard, B. Scalliet and M. Pichavant, Kinetics of iron oxidation– reduction in hydrous silicic melts, American Mineralogist 87 (2002), pp. 829–837. Gaillard et al., 2003a F. Gaillard, B. Schmidt, S. Mackwell and C. McCammon, Rate of hydrogen–iron redox exchange in silicate melts and glasses, Geochimica et Cosmochimica
Acta 67 (2003), pp. 2427–2441.
Gaillard et al., 2003b F. Gaillard, M. Pichavant and B. Scaillet, Experimental determination of activities of FeO and Fe2O3 components in hydrous silicic melts under oxidizing conditions,
Geochimica et Cosmochimica Acta 67 (2003), pp. 4389–4409.
Gaillard et al., 2003c F. Gaillard, M. Pichavant, S. Mackwell, R. Champallier, B. Scaillet and C. McCammon, Chemical transfer during redox exchanges between H2 and Fe-bearing
silicate melts, American Mineralogist 88 (2003), pp. 308–315.
Geschwind and Rutherford, 1995 C.H. Geschwind and M.J. Rutherford, Crystallization of microlites during magma ascent: the fluid mechanics of 1980–1986 eruptions at Mount St. Helens, Bulletin of Volcanology 57 (1995), pp. 356–370.
Hess and Dingwell, 1996 K.U. Hess and D.B. Dingwell, Viscosities of hydrous leucogranitic melts: a non-Arrhenian model, American Mineralogist 81 (1996), pp. 1297–1300.
Holloway, 2004 J.R. Holloway, Redox reactions in seafloor basalts: possible insights into silicic hydrothermal systems, Chemical Geology 210 (2004), pp. 225–230.
Kress and Carmichael, 1991 V. Kress and I.S.E. Carmichael, The compressibility of silicate liquids containing Fe2O3 and the effect of composition, temperature, oxygen fugacity and
pressure on their redox states, Contributions to Mineralogy and Petrology 108 (1991), pp. 82– 92.
Manley, 1992 C.R. Manley, Extended cooling and viscous flow of large, hot rhyolite lavas: implications of numerical modeling results, Journal of Volcanology and Geothermal
Research 53 (1992), pp. 27–46.
Manley and Fink, 1987 C.R. Manley and J.H. Fink, Internal textures of rhyolite flows as revealed by research drilling, Geology 15 (1987), pp. 549–552.
Mathez, 1984 E.A. Mathez, Influence of degassing on oxidation states of basaltic magmas,
Nature 310 (1984), pp. 371–374.
Métrich et al., 2006 N. Métrich, J. Susini, E. Foy, F. Farges, D. Massare, L. Sylla, S. Lequien and M. Bonnin-Mosbah, Redox state of iron in peralkaline rhyolitic glass/melt: X-ray
absorption micro-spectroscopy experiments at high temperature, Chemical Geology 231 (2006), pp. 350–363.
Moore et al., 1995 G. Moore, K. Righter and I.S.E. Carmichael, The effect of dissolved water on the oxidation state of iron in natural silicate liquids, Contributions to Mineralogy and
Petrology 120 (1995), pp. 170–179.
Moriizumi et al., 2008 M. Moriizumi, S. Nakashima, S. Okumura and Y. Yamanoi, Color-change processes of a plinian pumice and experimental constraints on color-Color-change kinetics in air of an obsidian, Bulletin of Volcanology (2008) 10.1007/s00445-0080202-5.
Mueller, 1971 R.F. Mueller, Oxidative capacity of magmatic components, American Journal
of Science 270 (1971), pp. 236–243.
Newman et al., 1986 S. Newman, E.M. Stolper and S. Epstein, Measurement of water in rhyolitic glasses: calibration of an infrared spectroscopic technique, American Mineralogist
71 (1986), pp. 1527–1541.
Peck, 1964 L.C. Peck, Systematic analysis of silicates: U.S.G.S, Bulletin 1170 (1964), p. 80. Sato and Wright, 1966 M. Sato and T.L. Wright, Oxygen fugacities directly measured in magmatic gases, Science 153 (1966), pp. 1103–1105.
Sato, 1978 M. Sato, Oxygen fugacity of basaltic magmas and the role of gas-forming elements, Geophysical Research Letters 5 (1978), pp. 447–449.
Sisson and Grove, 1993 T.W. Sisson and T.L. Grove, Experimental investigations of the role of H2O in calc-alkaline differentiation and subduction zone magmatism, Contributions to
Mineralogy and Petrology 113 (1993), pp. 143–166.
Smith et al., 2001 R.K. Smith, R.L. Tremallo and G.E. Lofgren, Growth of megaspherulites in a rhyolitic vitrophyre, American Mineralogist 86 (2001), pp. 589–600.
Stasiuk et al., 1993 M.V. Stasiuk, J. Barclay, M.R. Carroll, C. Jaupart, J.C. Ratte, R.S.J. Sparks and S.R. Tait, Degassing during magma ascent in the Mule Creek vent (USA), Bulletin
of Volcanology 58 (1993), pp. 117–130.
Stevenson et al., 1994 R.J. Stevenson, R.M. Briggs and A.P.W. Hodder, Physical volcanology and emplacement history of the Ben Lomond rhyolite lava flow, Taupo Volcanic Centre, New Zealand, New Zealand Journal of Geology and Geophysics 37 (1994), pp. 345–358.
Stolper, 1982 E.S. Stolper, The speciation of water in silicate melts, Geochimica et
Cosmochimica Acta 46 (1982), pp. 2609–2620.
Swanson et al., 1989 S.E. Swanson, M.T. Naney, H.R. Westrich and J.C. Eichelberger,
Crystallization history of Obsidian Dome, Inyo Domes, California, Bulletin of Volcanology 51 (1989), pp. 161–176.
Tuffen and Castro, 2009 H. Tuffen and J.M. Castro, The emplacement of an obsidian dyke through thin ice: Hrafntinnuhryggur, Krafla, Iceland, Journal of Volcanology and Geothermal
Research (2009) 10.1016/j.jvolgeores.2008.10.021.
Tuffen et al., in review Tuffen, H., Castro, J.M., Wilson, L., in review. The thermal effects of spherulite crystallization in rhyolitic lava. Earth and Planetary Science Letters.
Watkins et al., 2009 J. Watkins, M. Magma, C. Huber and M. Martin, Diffusion-controlled spherulite growth in obsidian inferred from H2O concentration profiles, Contributions to
Mineralogy and Petrology 157 (2009), pp. 163–172.
Westrich et al., 1988 H.R. Westrich, H.W. Stockman and J.C. Eichelberger, Degassing of rhyolitic magma during ascent and emplacement, Journal of Geophysical Research 93 (1988), pp. 6503–6511.
Wilke et al., 2005 M. Wilke, G.M. Partzsch, R. Bernhardt and D. Lattard, Determination of the iron oxidation state in basaltic glasses using XANES at the K-edge, Chemical Geology
220 (2005), pp. 143–161.
Wright, 1915 F.E. Wright, Obsidian from Hrafntinnuhryggur, Iceland: its lithophysae and surface markings, Bulletin of the Geological Society of America 26 (1915), pp. 255–286.
Fig. 1. A) Photomicrograph of spherulites (round and elliptical, black) in obsidian (brown). Various analytical points and traverses are shown (emp = electron probe microanalyzer; FTIR = Fourier Transform Infrared Spectroscopy; XANES = X-ray absorption near-edge
spectroscopy). Black diamonds indicate approximate locations of µ-XANES measurements. Broader dark swaths are tracks left by a laser ablation ICPMS (these data are not discussed here). B) A backscattered electron image showing typical internal spherulite texture. Bright phases are clinopyroxene and magnetite. C) An OH− concentration profile determined by
FTIR collected along the lower right traverse in frame A. The vertical grey line is the approximate location of the colorless–brown glass boundary.
Fig. 2. Major element compositions of glass leading up to a spherulite margin (at
position = 0 µm). All analyses were collected with an electron probe microanalyzer. The vertical grey bars demarcate the approximate (± 10 µm) position of the colorless–brown glass boundary.
Fig. 3. Raw μ-XANES spectra of the pre-edge region, model components, and model fits for two points within the glassy matrix depicted in Fig. 1A. A) Point 1 inside the colorless glass halo and (B) point 2 in the distal brown glass. C) Model fits of the spectra in A and B
baseline-subtracted and superimposed. Approximate positions of analysis points are shown on the inset photomicrograph. These data show the relative changes in the ratio of Fe2+ to Fe3+ in the colorless and brown matrix glass. Iron in the glass near the spherulite (point 1) is
Fig. 4. Colorless glass rim width versus the apparent spherulite radius, measured on
photomicrographs of the Krafla obsidian (solid dots). Error in rim width, shown as vertical bars, ranges from about 10 to 20%, and originates from the diffuse nature of the colorless– brown glass boundaries. Regression curve is a power law function of the form: y = 2x0.69;
R2 = 0.97. Solid triangles are the predicted rim widths based on the experimentally constrained hydrogen–iron reaction rate constant of Gaillard et al. (2003b), and the assumption that the rims developed during the interval of time that the spherulites grew, which in turn, is taken from the growth rate data of Castro et al. (2008).
Fig. 5. Photomicrographs (500×; 200 µm f.o.v.) collected on: (A) a natural spherulite–glass combination, and (B–D) an experimentally heated spherulitic obsidian. Frame A shows the natural appearance of the spherulite margin (at top) and colorless and brown glass as viewed in transmitted, plane polarized light. The wafer is 197 µm thick. Frame B shows the typical appearance of the spherulite and colorless and brown glass after heating a similar piece of obsidian to 770 °C for approximately 90 min. This wafer is about 202 µm thick. Note the thin veneer (~ 10 µm) of plagioclase coating the spherulite margin (upper right) and the relative brightening of the colorless glass halo. Note also the crack running roughly in the center of the colorless halo with a string of small vesicles on its tip. Frame C shows another view of the incipient crystallization and vesiculation that occurred during heat treatment. The vesicles here formed along a fracture in the colorless glass zone. Frame D is a backscattered electron image of the three zones developed at the spherulite margin: the brown microlite rich fringe (a), plagioclase veneer (b), and the colorless and Fe-reduced matrix glass (c).
Fig. 6. An OH− concentration profile measured along a traverse extending from a spherulite in the heated obsidian sample. The position of traverse is shown on the subjacent
photomicrograph. The vertical dashed and solid grey lines on the profile bound the light brown glass zone that may have formed as a result of degassing of hydrogen into the crack shown in the photomicrograph. Note the coincidence between the depression in the OH− concentration profile and the position of the crack at ~ 75–80 µm.
Table 1. Glass and spherulite composition in Hrafntinnuhryggur obsidian.
Glass composition
SiO2 TiO2 Al2O3 FeOtot MnO MgO CaO Na2O K2O OH− Total
EPMA Brown (n = 7) 75.3 (0.68)a 0.24 (0.01) 12.9 (0.06) 3.22 (0.15) 0.11 (0.04) 0.08 (0.01) 1.64 (0.05) 3.70 (0.20) 3.02 (0.14) 0.13 (0.02) 100.3 Trans (n = 1) 76.2 0.24 12.7 3.18 0.06 0.09 1.56 3.85 2.86 0.18 100.9 Colorless (n = 8) 74.9 (0.76) 0.24 (0.03) 12.7 (0.08) 3.30 (0.20) 0.08 (0.04) (0.01) 0.08 1.64 (0.04) 3.79 (0.14) 3.03 (0.14) 0.19 (0.01) 99.9
µ-XANES I(Fe3+)/I(Fe2+) I(Fe3+)/[I(Fe2+) + I(Fe3+)] Centroid Fe3+/ΣFe FeO Fe 2O3 Clear halo 0.57 0.36 7112.22 0.165 (0.04) 2.70 0.59 Brown matrix 0.76 0.43 7112.40 0.225 (0.04) 2.52 0.79 Fe3+ converted to Fe2+ in rim: 9.1 × 10− 8 mol blog fO2-brown glass − 14.4
Glass composition
SiO2 TiO2 Al2O3 FeOtot MnO MgO CaO Na2O K2O OH− Total
blog fO2-clear glass − 13.7
Wet chemistry: FeO of brown matrix (n = 7): 2.31 ± 0.02 wt.%. Fe2O3 implied: 1.04 wt.%. Fe3+/ΣFe: 0.29.Log fO2 of brown glass due to
exposure to fH2 = 0.02 bar: − 14.6.Spherulite characteristicsMineralogy (vol.%): plagioclase (45%); quartz (45%); clinopyroxene (5%);
magnetite (< 0.5%); interstitial glass (< 5%).Colorless glass rim width: 140 µm (+ 10 µm).mass OH− in clear glass rim: 0.00052 mg moles OH− in the colorless rim: 3.0 × 10− 8 mol.a Values in parentheses represent 1 s.d. about the mean value.
b fO