HAL Id: hal-00301304
https://hal.archives-ouvertes.fr/hal-00301304
Submitted on 22 Jun 2004HAL is a multi-disciplinary open access
archive for the deposit and dissemination of sci-entific research documents, whether they are pub-lished or not. The documents may come from teaching and research institutions in France or abroad, or from public or private research centers.
L’archive ouverte pluridisciplinaire HAL, est destinée au dépôt et à la diffusion de documents scientifiques de niveau recherche, publiés ou non, émanant des établissements d’enseignement et de recherche français ou étrangers, des laboratoires publics ou privés.
High ozone at rural sites in India
D. Chand, S. Lal
To cite this version:
D. Chand, S. Lal. High ozone at rural sites in India. Atmospheric Chemistry and Physics Discussions, European Geosciences Union, 2004, 4 (3), pp.3359-3380. �hal-00301304�
ACPD
4, 3359–3380, 2004
High ozone at rural sites in India
D. Chand and S. Lal
Title Page Abstract Introduction Conclusions References Tables Figures J I J I Back Close
Full Screen / Esc
Print Version Interactive Discussion
© EGU 2004
Atmos. Chem. Phys. Discuss., 4, 3359–3380, 2004 www.atmos-chem-phys.org/acpd/4/3359/
SRef-ID: 1680-7375/acpd/2004-4-3359 © European Geosciences Union 2004
Atmospheric Chemistry and Physics Discussions
High ozone at rural sites in India
D. Chand1, 2and S. Lal11
Physical Research Laboratory, Navrangpura, Ahmedabad, India 2
Now at Max Planck Institute for Chemistry, Mainz, Germany
Received: 22 April 2004 – Accepted: 1 June 2004 – Published: 22 June 2004 Correspondence to: D. Chand ([email protected])
ACPD
4, 3359–3380, 2004
High ozone at rural sites in India
D. Chand and S. Lal
Title Page Abstract Introduction Conclusions References Tables Figures J I J I Back Close
Full Screen / Esc
Print Version Interactive Discussion
© EGU 2004 Abstract
Past observations of O3 at urban, rural and lower free tropospheric sites in India have shown generally low values rarely exceeding 60 ppbv. We show that this can not be generated to all over India. Surface ozone (O3) concentrations are obtained from mea-surements in rural, urban and free tropospheric environments in January 2001 and 5
2002 as a part of Mobile Lab Experiments (MOLEX) conducted in western India. El-evated O3 from 70 to 110 ppbv (nmole/mole) are recorded during afternoon hours at rural sites in downwind of major industrial region of Gujarat adjoining the Arabian Sea. Repeated observations during both the years indicate that this is a regular process in this region. The average background ozone is found to be 42±6 ppbv. The elevated 10
ozone in the downwind site is about 60% higher than that in the major urban center and its surroundings and by a factor of 2 higher than the background levels of O3 in this region. In comparison to the downwind observations; the ozone observed at the continental stations in rural (Gadanki), urban (Ahmedabad) and free tropospheric (Mt. Abu) sites in India are low and rarely exceeded 60 ppbv during the month of January. 15
Forward trajectory analysis shows that the polluted plumes from this urban area can get transported more than 3000 km to the marine boundary layer over the Arabian Sea and the Indian Ocean within a week. Similar transport of pollutants from major urban sites like Delhi and other cities can enhance O3in their downwind rural sites and can affect the human health as well as vegetation significantly.
20
1. Introduction
Ground level ozone, one of the gaseous air pollutants, is significantly exceeding the permissible concentrations in several regions (Proyou et al., 1991; Ballaman, 1993). Its background concentrations have been reported to increase during the last decades and it is expected that its concentration will continue to rise further during the coming years 25
ACPD
4, 3359–3380, 2004
High ozone at rural sites in India
D. Chand and S. Lal
Title Page Abstract Introduction Conclusions References Tables Figures J I J I Back Close
Full Screen / Esc
Print Version Interactive Discussion
© EGU 2004
at Ahmedabad, India is observed to have increased significantly from 1954–1955 to 1991–1993 (Naja and Lal, 1996).
High ozone concentrations have long been known to affect many physiological and biochemical characteristics (Reich and Amundson, 1985) as well as growth yield of agricultural crops (Krupa et al., 1995; Chameides et al., 1999) and natural vegetation 5
(Hogsett et al., 1997). Ozone is a reactive oxidant gas and its high dose has adverse effect on human health (Miller, 1995). Absorption of O3 occurs in all regions of the respiratory system causing many health problems (Chang et al., 1991). The tropo-spheric O3 is also important in determining the oxidizing capacity of the atmosphere, both through its direct role, and through its role as a precursor of the hydroxyl radi-10
cal OH. Details of the chemistry of tropospheric ozone and its budget are described elsewhere (Kelly et al., 1984; Crutzen et al., 1999; Brasseur et al., 1999; Kley et al., 1999).
Recently, considerable attention has been given to the transport and transformation of pollutants from south and south-east Asia to their surrounding marine environments 15
(Lelieveld et al., 2001; Chand et al., 2003). The Indian Ocean Experiment (INDOEX) results have shown a pollution haze over the Arabian Sea and the Indian Ocean as a result of transport of pollutants from the Indian subcontinent (Ramanathan et al., 2001). Elevated ozone levels (60–70 ppbv) were observed in a remote marine envi-ronment over the Arabian Sea during INDOEX 1999. However, it was not discern-20
able whether these elevated levels were transported from the free troposphere or were produced and/or transported from the continental source regions (Lal and Lawrence, 2001). Limited observations available from the continental stations in India at urban, rural and free tropospheric sites generally show low levels of ozone over the Indian subcontinent (Varshney and Aggarawal, 1992; Khemani et al., 1995; Lal et al., 2000; 25
Lal and Lawrence, 2001; Nair et al., 2002; Naja and Lal, 2002). Ozone observations in downwind of urban environment in India are not reported so far to our knowledge.
In this article, we present the first O3 observations at urban city, its downwind and surroundings in the Indian subcontinent. Section 2 describes the experimental
meth-ACPD
4, 3359–3380, 2004
High ozone at rural sites in India
D. Chand and S. Lal
Title Page Abstract Introduction Conclusions References Tables Figures J I J I Back Close
Full Screen / Esc
Print Version Interactive Discussion
© EGU 2004
ods briefly followed by the results, discussions and conclusions in Sects. 3, 4 and 5, respectively.
2. Experimental methods
2.1. Monitoring sites
The first mobile lab experiment (MOLEX) was conducted in downwind of Ahmedabad 5
(capital urban city of Gujarat) during 22–27 January 2001. Two instrumented mobile vans were employed to increase the data set in the limited observational period. Each mobile van carried one ozone analyzer and the third ozone analyzer was kept at the Physical Research Laboratory (PRL) in Ahmedabad. In addition to the observations in January 2001, the repeatability of the observations was made by making measure-10
ments from 30 December 2001 to 5 January 2002 at the same sites (Ahmedabad and Khambat).
Ozone observations were made at polluted site (Ahmedabad) and its surroundings in urban, rural and free tropospheric environments at Ahmedabad (23◦N, 72.6◦E, 49 m), Khambat (22.2◦N, 72.4◦E, 15 m) and Mt. Abu (24.6◦N, 72.6◦E, 1680 m), respectively. 15
The heights of all the stations mentioned at the geographical locations are above mean sea level. Measurements made at rural site in south India Gadanki (13.5◦N, 79.2◦E, 375 m) are also used for an inter-comparison. Continuous measurements of ozone were made at a remote mountaintop called Guru Shikhar at Mt. Abu (hereafter, only Mt. Abu will be mentioned) in January of 2000 and 2001. This region comes under 20
the southern end of Aravali range of mountains and is the highest in the entire western central Indian region. It is about 200 km north of Ahmedabad. In winter, the average wind pattern is such that Ahmedabad is in downwind of Mt. Abu. Details of this station and some results of ozone measurements are discussed elsewhere (Chand, 2002; Naja et al., 2003).
25
ACPD
4, 3359–3380, 2004
High ozone at rural sites in India
D. Chand and S. Lal
Title Page Abstract Introduction Conclusions References Tables Figures J I J I Back Close
Full Screen / Esc
Print Version Interactive Discussion
© EGU 2004
very little traffic to avoid the sampling from vehicle exhausts. The circles in Fig. 1 are the main urban centers and the sizes of the circles are proportional to the population of these urban centers. The numbers along the track indicate the date of observations in mobile phase during daytime. All the night-time observations during the campaign were made at stationary (pre-planed) sites without using the electrical generators. Khambat 5
is a small town, about 80 km south of Ahmedabad as shown in Fig. 1. Ozone mea-surements were taken at Khambat for more than 20 h on 25–26 January 2001. We had to stop these measurements due to a severe earthquake on 26 January 2001 in this region. These observations at Khambat along with observations at urban center at Ahmedabad were repeated for longer time in the same season during 30 December 10
2001 to 6 January 2002 to confirm the repeatability of results from the first campaign. Background levels of ozone are obtained from the observations made at the remote free tropospheric site Mt. Abu. Ahmedabad (urban site) and its downwind measure-ments are used to assess the magnitude of ozone production in out flow of the urban plume. Mt. Abu and Khambat observations in upwind (free-troposphere) and downwind 15
of Ahmedabad, respectively, are used for estimating the excess ozone in downwind outflow of urban plumes.
2.2. Instrumentation and data reduction
The ozone measurements were made using Dasibi (Model 1008, USA) and Environ-mental S.A. (Model 41M, France) analyzers, based on the principle of UV absorption 20
by ozone at 253.7 nm. All the analyzers are calibrated and inter-compared before the campaign. Uncertainties of the measurements among all analyzers are within ±3%. The details of the calibrations of these analyzers are discussed elsewhere (Lal et al., 2000; Chand, 2002). Air inlets were taken from the front of the vans to avoid the contamination from exhaust of vans and power generators. The data from the national 25
highways, Ahmedabad-Bagodra-Rajkot and Ahmedabad-Vadodara are not used in this study. The ambient air was sampled at the height of about 20 m from the ground into the ozone analyzer at PRL, Ahmedabad. Stainless steel and teflon tubes of1/4and1/2
ACPD
4, 3359–3380, 2004
High ozone at rural sites in India
D. Chand and S. Lal
Title Page Abstract Introduction Conclusions References Tables Figures J I J I Back Close
Full Screen / Esc
Print Version Interactive Discussion
© EGU 2004
inch diameters are used for the sampling lines. The lengths of sampling tubes were kept short within 6 meters for all the observations. Maximum loss of O3in the sampling lines is less than 2% of its concentration and the data are corrected for these losses.
The time mentioned in this study is local Indian Standard Time (IST) which is 5.5 h ahead of GMT. The sampling intervals at Ahmedabad and in mobile vans were taken 5
as 1 min whereas the data were stored at every 5 min interval at Mt. Abu. Diurnal amplitude of O3is calculated by taking difference in maximum average O3levels in the afternoon hours and minimum O3 before sunrise. The increase rate of O3 (dO3/dt) is calculated using least square fit to O3 concentrations at hourly interval between 07:00 to 12:00 h. The averaged values are shown with a dispersion of (1 sigma) σ.
10
2.3. Meteorology
The wind pattern in India changes dramatically from south-west to north-east during the pre-winter months. In western India, pre-winter months show weak winds whereas the winter is dominated by relatively stronger winds (Chand, 2002; Naja et al., 2003). Such changes in wind patterns are observed each year (Asnani, 1993). The consis-15
tently stronger continental wind flow from north and north-eastern direction swaps the pollutants from the Indian region and transport them to the remote land and marine en-vironments in this region. In winter, when the winds are northerly or north-easterly, the polluted air from Ahmedabad and Vadodara passes over Khambat on the way to the Arabian Sea. Figure 2 displays the movement of air parcel shown by forward trajectory 20
(FT) originated from Ahmedabad. The air has descending motion most of the times in the boundary layer. The data from National Center for Environmental Prediction (NCEP) are used for wind field analysis. Hybrid Single Particle Lagrangian Integrated Trajectory (HySPLIT-4) Model (version-4) is used for getting the FTs. Details of the model description are given in Draxler and Hess (1998). Faint gray lines in Fig. 1 show 25
the average NCEP wind fields during the MOLEX period. The NCEP winds are at coarse resolution and give rough estimate only. The average wind speed was in the
ACPD
4, 3359–3380, 2004
High ozone at rural sites in India
D. Chand and S. Lal
Title Page Abstract Introduction Conclusions References Tables Figures J I J I Back Close
Full Screen / Esc
Print Version Interactive Discussion
© EGU 2004
range of 2–6 m/s.
3. Results
3.1. Ozone at urban and surrounding sites
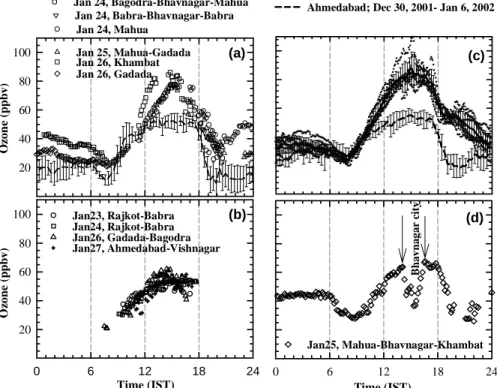
Figure 3a depicts the average diurnal variation of ozone at urban site (Ahmedabad) and at different routes in its surroundings on mobile track during 22–26 January 2001 5
(see Fig. 1 for track). The average diurnal variations of ozone at Ahmedabad during 22–26 January 2001 show maximum O3of about 52 ppbv in the afternoon hours. High ozone levels persisted for more than 4 h from 12:30 h to 17:00 h. Lowest levels of ozone (12±3 ppbv) were observed before sunrise. Generally, the boundary layer is most shallow and isolated with the free troposphere at this time with stronger inversion. 10
Ozone losses by dry deposition and chemistry during the night hours result decrease in ozone concentration until the sun rises.
The observed amplitude of diurnal variation in ozone in daytime at Ahmedabad is about 40 ppbv. After sunrise, ozone increased at the rate of 6.7 ppbv h−1 and it takes about six hours to attain the peak levels. The ozone values observed in the downwind 15
of urban center on 24, 25 and 26 January are 20–30 ppbv higher compared to the values at Ahmedabad (Fig. 3a). The ozone levels for these three consecutive days at Bagodra-Bhavanagar-Mahua, Mahua-Gadada and Khambat tracks show higher ozone levels of 78–86 ppbv. The net daytime increase of ozone in downwind is about 65 ppbv, which is about 60% higher than the ozone increase at urban site Ahmedabad. Ozone 20
levels increased at a rate of ∼10 ppbv h−1 after sunrise. It takes 5–7 h to attain the maximum levels after sunrise at these sites. All the three consecutive days on mobile track showed high ozone concentrations than at Ahmedabad. There are some varia-tions in the daytime and nighttime ozone levels possibly due to variavaria-tions in the levels of pollutants at these sites.
25
ACPD
4, 3359–3380, 2004
High ozone at rural sites in India
D. Chand and S. Lal
Title Page Abstract Introduction Conclusions References Tables Figures J I J I Back Close
Full Screen / Esc
Print Version Interactive Discussion
© EGU 2004
Ahmedabad-Vishnagar tracks, which do not fall in the downwind of the pollution plume, are in the range of 50–60 ppbv (Fig. 3b). The observed average increase rate in ozone at these sites is about 4.2 ppbv h−1, which is lower than that observed at Ahmedabad.
Figure 3c shows the average diurnal variation of ozone at Ahmedabad and its down-wind side at Khambat during the second campaign from 30 December 2001 to 6 Jan-5
uary 2002. The average peak ozone of about 55±6 ppbv is observed in the after-noon hours at Ahmedabad. The observed increase rate in ozone is about 4.2 ppbv h−1 adding 27 ppbv of ozone in daytime hours. There is some difference in average di-urnal variation in ozone particularly the night time values being lower during 2002 at Ahmedabad (see Table 1). However, the maximum ozone levels are similar for both 10
the years.
Highest ozone levels were observed again at Khambat in the afternoon hours rang-ing from 70 to 110 ppbv through out the observational period durrang-ing the second cam-paign. The mean of the peak ozone for all the observational data during afternoon hours is 88 ppbv. The average ozone increase rate from sunrise to afternoon hours is 15
about 10 ppbv h−1 leading to high ozone buildup with an amplitude of about 58 ppbv. There is very less day-to-day ozone variability during 08:00–12:00 h and 17:00–19:00 h comparing the variability at night and afternoon hours. The observed ozone levels at Khambat are about 63% higher than the urban site Ahmedabad. The ozone variations and its amplitude are consistent with the observations made during the first campaign 20
in January 2001.
Figure 3d shows diurnal variation of ozone observed on 25 January along the north-ern coast of the Arabian Sea from Mahua to Khambat across the Bhavnagar city (see Fig. 1 for the mobile track). The ozone levels dropped from 63 ppbv to about 37 ppbv and came back almost to its original level when the observations were taken across 25
the city of Bhavanagar. The difference in the ozone values outside and inside the city was around 26 ppbv. The difference in ozone inside and outside of the Bhavnagar city is similar with the ozone difference from urban center (Ahmedabad) to its downwind regions observed during both the mobile campaigns (Figs. 3a–3c). This indicates that
ACPD
4, 3359–3380, 2004
High ozone at rural sites in India
D. Chand and S. Lal
Title Page Abstract Introduction Conclusions References Tables Figures J I J I Back Close
Full Screen / Esc
Print Version Interactive Discussion
© EGU 2004
the net production efficiency of O3in urban environments is significantly lower than its downwind out flow regions.
Figure 4 shows the correlations of O3 at urban site (Ahmedabad) and its downwind rural location at Khambat in shape of hysteresis loop as shown by curves 1, 2 and 3. The buildup of ozone in morning to afternoon hours in downwind site is more pro-5
nounced than at urban site Ahmedabad. The magnitude of increase rate in O3 from morning to afternoon hours is higher than the decrease rate from afternoon to evening hours at both sites. The higher increase rate in morning hours is as a result of O3 production by in-situ photochemistry and by mixing the ozone rich air from the free troposphere to the boundary layer. Summary of the increase rates of ozone is given in 10
Table 1.
3.2. Ozone at other stations in India
The ozone levels at Ahmedabad and its downwind sites are compared with observa-tions from free tropospheric site at Mt. Abu and a rural site at Gadanki in winter of 2001. Figure 5 shows a comparison of the diurnal variations of ozone observed at Mt. Abu, 15
Gadanki, Ahmedabad and downwind of urban environment at Khambat. The observed ozone levels at Mt. Abu in night hours are higher than daytime. Also, there is a net ozone loss (4 ppbv) at Mt. Abu during the daytime without any significant change in ozone levels during the night hours. The decrease in O3 concentration in day time at Mt. Abu is attributed to mixing of ozone poor air from boundary layer to the free tropo-20
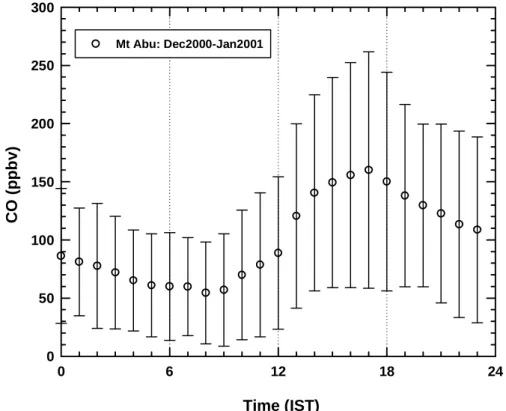
sphere. Carbon monoxide (CO) is used as a tracer for this mixing. Figure 6 shows the average diurnal variation of CO at Mt. Abu in winter. The observed nitric oxide (NO) levels at Mt. Abu are too low to lead a significant O3 production (Naja et al., 2003; Chand, 2002). The average ozone during night time in the month of January is about 42±6 ppbv and there is no significant difference in ozone levels in this season during 25
2000 and 2001. Gadanki is a rural environment in south India exhibiting diurnal varia-tion similar to the rural sites upwind of Ahmedabad with noontime maximum of 45 ppbv and a minimum of 8 ppbv before sunrise. All these unpolluted rural sites do not show
ACPD
4, 3359–3380, 2004
High ozone at rural sites in India
D. Chand and S. Lal
Title Page Abstract Introduction Conclusions References Tables Figures J I J I Back Close
Full Screen / Esc
Print Version Interactive Discussion
© EGU 2004
ozone greater than 60 ppbv during January of 2001 and 2002.
4. Discussion
The stable levels of ozone at Mt. Abu [d(O3)/dt≈0] in night can be used to show that this site has a signature of free troposphere in the month of January. This is further supported by low levels of CO in night and its high levels in day time (see Fig. 6). The 5
O3poor and CO rich air from boundary layer mixes with the air in the free troposphere and leads to increase in CO and decrease in O3concentrations after sunrise. Using O3 and CO variations as a tracer of air mass, ozone levels in night hours (18:00–06:00 h) at this site can be taken as background level for this region. The mean night time ozone at this site is 42±6 ppbv in the month of January 2000 and 2001. There is no significant 10
difference in average ozone levels in January of 2000 and 2001. This indicates that this site is free from the small scale (local) perturbations.
The observed ozone levels at Ahmedabad during the first and second campaigns of MOLEX in January 2001 and 2002, as shown in the Figs. 3a and 3c, are consistent and repeating in magnitude. Also, these ozone observations at Ahmedabad are in general 15
conformity of earlier measurement by Lal et al. (2000) at this site.
Ozone levels observed at Mt. Abu, Gadanki and the coastal environment at Thumba (Nair et al., 2002) have rarely crossed 60 ppbv in the month of January. Back trajectory analyses at Mt. Abu in January 2000 and 2001 (not shown here) indicate that the air descended from the free troposphere almost all the times without showing any 20
significant high levels of ozone. Khambat, in the downwind of Ahmedabad, is also an entry point of pollutants to the Arabian Sea (see Fig. 1). Forward trajectory analysis shows that the polluted plumes from this region can get transported more than 3000 km to the marine boundary layer over the Arabian Sea and the Indian Ocean within a week. Comparing this site with the other rural sites and free tropospheric site, it is most likely 25
that high levels of ozone at Khambat are results of photochemical production from the urban pollutants. The excess ozone concentration in the plums downwind of urban site
ACPD
4, 3359–3380, 2004
High ozone at rural sites in India
D. Chand and S. Lal
Title Page Abstract Introduction Conclusions References Tables Figures J I J I Back Close
Full Screen / Esc
Print Version Interactive Discussion
© EGU 2004
(O3in downwind – Background O3) is 46 ppbv. The ozone level in downwind of urban environment is more than a factor of 2 higher than the background ozone in this region.
5. Summary and conclusions
Surface ozone (O3) levels are observed in rural, urban and free troposphere environ-ments in winter (January) of 2001 and 2002 as a part of a Mobile Lab Experiment 5
(MOLEX) in western India. Elevated O3 up to 110 ppbv were recorded in afternoon hours at rural sites in downwind of major industrial region of Gujarat (India) adjoining the Arabian Sea during these campaigns. These are the first O3observations at urban center and its upwind and downwind sites over the Indian subcontinent.
The observations at urban centers (Ahmedabad and Bhavnagar city) show low levels 10
of ozone (<60 ppbv). The ozone levels at rural site are found to be about 60% higher than its upwind urban center at Ahmedabad (Table 1). The repeated observations in January 2001 as well as 2002 indicate that the elevated ozone in the downwind of urban centers of Gujarat is a regular process in this season. Khambat, being an entry point to the Arabian Sea, is feeding high levels of ozone over this marine environment. 15
Seven days forward trajectories show polluted air transporting more than 3000 km in the boundary layer from Ahmedabad over the Arabian Sea and the Indian Ocean reaching up to inter-tropical convergence zone (ITCZ) near 5◦S. It is highly possible that the elevated ozone observed during INDOEX 1999 over the Arabian Sea downwind of western India was the result of outflow of pollutants transported from the urban centers. 20
Observations at Mt. Abu, Ahmedabad and its downwind sites suggest that the elevated ozone in downwind of urban centers is a result of photochemical production by outflow of urban pollutants. The background ozone in free troposphere at a height of 1680 m in this regions is 42±6 ppbv in month of January. The observed ozone level in downwind of urban center is a factor of 2 higher than the background ozone concentration. The 25
net excess ozone in the plumes downwind of urban center is about 46 ppbv.
ACPD
4, 3359–3380, 2004
High ozone at rural sites in India
D. Chand and S. Lal
Title Page Abstract Introduction Conclusions References Tables Figures J I J I Back Close
Full Screen / Esc
Print Version Interactive Discussion
© EGU 2004
observed fact in the North America and Europe, these observations suggest that ele-vated ozone downwind of urban centers in India can significantly affect the composition of air on the way at land as well as over the marine environments in the winter season. Similar to the horizontal transport in downwind of urban centers, ozone and its precur-sors can lead high O3in the free troposphere under convection and turbulent activities 5
during the summer. Ozone has longer lifetime over the marine environment and the free troposphere and it may get transported to regional or even at global scales. Apart from the climatic implications, the landlocked polluted urban centers like Delhi, etc may have significant health and crop implications in the rural areas in their downwind sites in the Indian subcontinent.
10
Since these are the first limited observations in downwind of urban environment in India, it is difficult to assess the magnitude of the ozone production by other major ur-ban centers in their downwind areas. In order to better understand the budget of the tropospheric ozone and its impact on human health and vegetation, the study of trans-port of pollutants in India has to be suptrans-ported by extensive measurements at the urban 15
centers as well as their downwind regions. Systematic observations of ozone and its precursors at elevated site (e.g. at Mt. Abu) along with measurements in rural, urban and marine environments over Indian subcontinent can be valuable for assessment of tropospheric ozone budget in this region.
Acknowledgements. We are thankful to Messers S. Venkataramani, K. S. Modh, T. K. Sunil, 20
and S. Desai for the active support in experiments. The corresponding author, D. Chand ac-knowledges M. O. Andreae, P. Crutzen and M. G. Lawrence for helpful discussions. We thank National Oceanic and Atmospheric Administration (NOAA) for providing free access for down-loading the forward trajectories and wind fields from the site http://www.arl.noaa.gov/ready/ hysplit4.html andhttp://www.cdc.noaa.gov/cdc/data.nmc.reanalysis.html.
ACPD
4, 3359–3380, 2004
High ozone at rural sites in India
D. Chand and S. Lal
Title Page Abstract Introduction Conclusions References Tables Figures J I J I Back Close
Full Screen / Esc
Print Version Interactive Discussion
© EGU 2004 References
Asnani, G. C.: Climatology of the tropics, in Tropical Meteorology, Indian Institute of Tropical Meteorology, Pune, India, I, 100–204, 1993.
Ballaman, R.: Transport of ozone in Switzerland, Science of the Total Environment, 134, 103– 115, 1993.
5
Brasseur, G. P., Orlando, J. J., and Tyndall, G. S. (Eds.): Atmospheric Chemistry and Global Change, 13, 465–486, Oxford Univ. Press, New York, 1999.
Crutzen, P. J., Lawrence, M. G., and P ¨oschl, U.: On the background photochemistry of tropo-spheric ozone, Tellus, 51 A-B, 123–146, 1999.
Chameides, W. L., Kasibhata, P. S., Yienger, J., and Levy II, H.: Growth of continental-scale 10
metro-plexes, regional pollution and world food production, Science, 264, 74–77, 1994. Chameides, W. L., Xingsheng, L., Xiaoyan, T., Xiuji, Z., Chao, L., Kiang, C. S., St. John, J.,
Saylor, R. D., Liu, S. C., Lam, K. S., Wang, T., and Giorgi, F.: Is Ozone Pollution Affecting Crop Yields in China?, Geophys. Res. Lett., 26, 867–870, 1999.
Chand, D.: Study of trace gases in the tropical troposphere, Ph.D. Thesis, MLS University, 15
Udaipur, India, July, 2002.
Chand, D., Lal, S., and Naja, M.: Variations of ozone in the marine boundary layer over the Ara-bian Sea and the Indian Ocean during the 1998 and 1999 INDOEX campaigns, J. Geophys. Res., 108, D6, 4190, doi:10.1029/2001JD001589, 2003.
Chang, L., Miller, F. J., Ultman, J., Huang, Y., Stockstill, B. L., Grose, E., Graham, J. A., Ospital, 20
J. J., and Crapo, J. D.: Alveolar epithetlial cell injuries by subchronic exposure to low concen-trations of ozone correlate with cumulative exposure, Toxicology and Applied Pharmacology, 109, 219–234, 1991.
Draxler, R. R. and Hess, G. D.: An overview of the HySPLIT-4 modeling system for trajectory, dispersion and deposition, Aust. Met. Mag., 47, 295–308, 1998.
25
Hogsett, W. E., Weber, J. E., Tingey, D. T., Herstrom, A. A., Lee, E. H., and Laurence, J. A.: An approach for characterizing tropospheric ozone risk to forests, Environmental Management, 21, 105–120, 1997.
Jonson, J. E., Sundet, J. K., and Tarrason, L.: Model calculations of present and future levels of ozone and ozone precursors with a global and a regional model, Atmos. Env., 35, 525–537, 30
2001.
ACPD
4, 3359–3380, 2004
High ozone at rural sites in India
D. Chand and S. Lal
Title Page Abstract Introduction Conclusions References Tables Figures J I J I Back Close
Full Screen / Esc
Print Version Interactive Discussion
© EGU 2004
Env., 18, 1251–1266, 1984.
Khemani, L. T., Momin, G. A., Rao, P. S. P., Vijayakumar, R., and Safai, P. D.: Study of surface ozone behavior at urban and forested sites in India, Atmos. Environ., 29, 2021–2024, 1995. Kley, D., Kleinmann, M., Sanderman, H., and Krupa, S.: Photochemical oxidants: state of the
science, Environmental Pollution, 100, 19–42, 1999. 5
Krupa, S. V., Gr ¨unhage, L., J ¨ager, H.-J., Nosel, M., Manning, W. J., Legge, A. H., and Hanewald, K.: Ambient ozone (O3) and adverse crop response: a unified view of cause and effect, Environmental Pollution, 87, 119–126, 1995.
Lal, S., Naja, M., and Subbaraya, B. H.: Seasonal variations in surface ozone and its precursors over an urban site in India, Atmos. Environ., 34, 2713–2724, 2000.
10
Lal, S. and Lawrence, M. G.: Elevated mixing ratios of surface ozone over the Arabian Sea, Geophys. Res. Lett., 28, 1487–1490, 2001.
Lelieveld, J., Crutzen, P. J., Ramanathan, V., et al.: The Indian Ocean Experiment: Widespread Air Pollution from South and Southeast Asia, Science, 291, 1031–1036, 2001.
Miller, F. J.: Uptake and fate of ozone in the respiratory tract, Toxicology Letters 82, 277–285, 15
1995.
Nair, P. R., Chand, D., Lal, S., Modh, K. S., Naja, M., Parameswaran, K., Ravindran, S., and Venkataramani, S.: Temporal variations in surface ozone at Thumba (8.6◦N, 77◦E) – a trop-ical coastal site in India, Atmos. Environ., 36, 603–610, 2002.
Naja, M. and Lal, S.: Changes in surface ozone amount and its diurnal and seasonal patterns, 20
from 1954–1955 to 1991–1993, measured at Ahmedabad (23◦N), India, Geophys. Res. Lett., 23, 81–84, 1996.
Naja. M. and Lal, S.: Surface ozone and precursor gases at Gadanki (13.5◦N, 79.2◦E), a tropical rural site in India, J. Geophys. Res., 107, D14, 4197, doi:10.1029/2001JD000357, 2002.
25
Naja, M., Lal, S., and Chand, D.: Diurnal and seasonal variabilities in the surface ozone at a high altitude station Mt. Abu (24.6◦N, 72.7◦E, 1680 m) in India, Atmos. Env., 37, 4205–4215, 2003.
Proyou, A. G., Toupance, G., and Perros, P. E.: A two year study of ozone behaviours at rural and forested sites in eastern France, Atmos. Env., 25, 2145–2153, 1991.
30
Ramanathan, V., Crutzen, P. J., Kiehl, J. T., and Rosenfeld, D.: Aerosols, climate and the hydrological cycle, Science, 294, 2119–2124, 2001.
ACPD
4, 3359–3380, 2004
High ozone at rural sites in India
D. Chand and S. Lal
Title Page Abstract Introduction Conclusions References Tables Figures J I J I Back Close
Full Screen / Esc
Print Version Interactive Discussion
© EGU 2004
and crop species, Science, 230, 566–570, 1985.
Varshney, C. R. and Aggarawal, M.: Ozone pollution in the urban atmosphere of Delhi, Atmos. Environ., 26, 291–294, 1992.
ACPD
4, 3359–3380, 2004
High ozone at rural sites in India
D. Chand and S. Lal
Title Page Abstract Introduction Conclusions References Tables Figures J I J I Back Close
Full Screen / Esc
Print Version Interactive Discussion
© EGU 2004
Table 1. Average ozone parameters at Ahmedabad (urban) and Khambat (rural) during MOLEX. The minimum ozone is observed before sunrise and maximum in the afternoon hours.
Campaign period Average observed Observations at Observations at
Parameter Ahmedabad Khambat
(Urban site) (Downwind site) Afternoon Max O3 52±4 ppbv 80 ppbv
22–27 January 2001 Morning Min O3 12±3 ppbv 25 ppbv Amplitude of O3 40 ppbv 65 ppbv O3increase rate 6.7 ppbv h−1 10.0 ppbv h−1 (hourly dO3/dt)
30 December 2001 – Afternoon Max O3 55±6 ppbv 88±13 ppbv 5 January 2002 Morning Min O3 28±4 ppbv 24±3 ppbv
Amplitude of O3 27 ppbv 63 ppbv O3increase rate 4.2 ppbv h−1 9.9 ppbv h−1 (hourly dO3/dt)
ACPD
4, 3359–3380, 2004
High ozone at rural sites in India
D. Chand and S. Lal
Title Page Abstract Introduction Conclusions References Tables Figures J I J I Back Close
Full Screen / Esc
Print Version Interactive Discussion
© EGU 2004
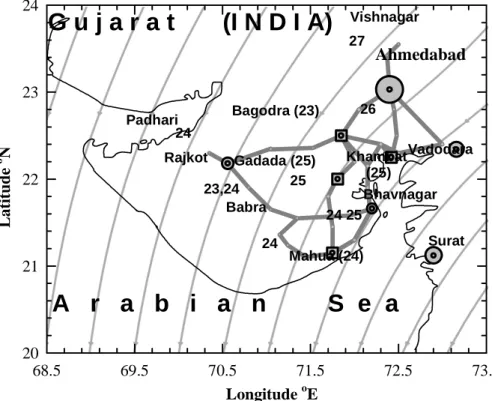
Figure 1. Geographical location of the tracks covered by the mobile vans in January 2001.
Circle represents the urban centers, size of the circle is proportional to the population of the urban center. Numbers on track indicate the date of the observations. Observations taken at stationary phase are the sites represented by the square symbols on the dates embedded in the brackets. Faint thin curved lines are the average NCEP wind flow at 925 mb during the observational period. Longitude oE 68.5 69.5 70.5 71.5 72.5 73.5 La ti tude o N 20 21 22 23 24
A r a b i a n S e a
Bagodra (23) Rajkot Vadodara Surat Bhavnagar Ahmedabad Padhari Gadada (25) Mahua (24) Khambat (25) 23,24 24 24 25 24 25 26G u j a r a t (I N D I A)
Vishnagar 27 BabraFig. 1. Geographical location of the tracks covered by the mobile vans in January 2001. Circle
represents the urban centers, size of the circle is proportional to the population of the urban center. Numbers on track indicate the date of the observations. Observations taken at sta-tionary phase are the sites represented by the square symbols on the dates embedded in the brackets. Faint thin curved lines are the average NCEP wind flow at 925 mb during the observational period.
ACPD
4, 3359–3380, 2004
High ozone at rural sites in India
D. Chand and S. Lal
Title Page Abstract Introduction Conclusions References Tables Figures J I J I Back Close
Full Screen / Esc
Print Version Interactive Discussion © EGU 2004 Longitude oE 50 60 70 80 90 100 L a ti tu de -10 0 10 20 30 Forward Days 0 1 2 3 4 5 6 7 8 A lt itu de (k m ) 0 1 2 3 I N D I A
I N D I A N O C E A N
Figure 2. Seven days, three dimensional forward trajectories showing the air parcel flow
started from the urban center Ahmedabad at an altitude of 500m to its downwind rural areas and farther over the Arabian Sea and Indian Ocean during January 23-27, 2000.
Fig. 2. Seven days, three dimensional forward trajectories showing the air parcel flow starting
from the urban center Ahmedabad at an altitude of 500 m to its downwind rural areas and farther over the Arabian Sea and the Indian Ocean during 23–27 January 2000.
ACPD
4, 3359–3380, 2004
High ozone at rural sites in India
D. Chand and S. Lal
Title Page Abstract Introduction Conclusions References Tables Figures J I J I Back Close
Full Screen / Esc
Print Version Interactive Discussion © EGU 2004 Time (IST) 0 6 12 18 24 O zo n e ( ppbv ) 20 40 60 80 100 Jan23, Rajkot-Babra Jan24, Rajkot-Babra Jan26, Gadada-Bagodra Jan27, Ahmedabad-Vishnagar Time (IST) 0 6 12 18 24 (a) (b) (c) (d) O zo n e ( ppbv ) 20 40 60 80 100 Jan 24, Bagodra-Bhavnagar-Mahua Jan 25, Mahua-Gadada Jan 26, Khambat Jan 24, Mahua Jan 26, Gadada Jan 24, Babra-Bhavnagar-Babra Ahmedabad; Jan 23-26, 2001 (a)
Ahmedabad; Dec 30, 2001- Jan 6, 2002 Khambat; Dec 30, 2001- Jan 6, 2002
Bh a v n a g a r c ity Jan25, Mahua-Bhavnagar-Khambat
Figure 3. Diurnal variations in ozone at urban center (Ahmedabad) and its surrounding sites
during both the campaigns in 2001 and 2002; (3a) diurnal variations of ozone at Ahmedabad and its downwind sites; (3b) diurnal variations in west of Ahmedabad and upwind direction of Ahmedabad; (3c) diurnal variations of ozone at Ahmedabad and its downwind (Khambat) from December 30, 2001 to January 6, 2002. Dots represent the measurements at 1 minute time interval during the campaign period (7days) and the lines are the average diurnal variation of all the data for both sites; (3d) diurnal variations of ozone on Mahua-Bhavnagar-Khambat mobile track on January 25, 2001. The dip labeled between arrow lines is ozone levels measured in afternoon hours at the time when Bhavnagar city was crossed (as mentioned in 3d).
Fig. 3. Diurnal variations in ozone at urban center (Ahmedabad) and its surrounding sites
during both the campaigns in 2001 and 2002;(a) diurnal variations of ozone at Ahmedabad and
its downwind sites;(b) diurnal variations in west and upwind direction of Ahmedabad; (c) diurnal
variations of ozone at Ahmedabad and its downwind (Khambat) from 30 December 2001 to 6 January 2002. Dots represent the measurements at 1 min time interval during the campaign period (7 days). Dashed and continuous curve lines are the average diurnal variation of all the data for both sites;(d) diurnal variations of ozone on Mahua-Bhavnagar-Khambat mobile
track on 25 January 2001. The dip labeled between arrow marks is ozone levels measured in afternoon hours at the time when Bhavnagar city was crossed (as mentioned in d).
ACPD
4, 3359–3380, 2004
High ozone at rural sites in India
D. Chand and S. Lal
Title Page Abstract Introduction Conclusions References Tables Figures J I J I Back Close
Full Screen / Esc
Print Version Interactive Discussion
© EGU 2004 Ozone at Ahmedabad (urban site)
15 30 45 60 Oz on e at Kh am b a t ( ru ral sit e) 15 30 45 60 75 90
Hourly average ozone (ppbv)
Mo rnin g i nc rea se in O3 (07 -14 hrs ) Even ing de crea se in O3 (1 4-20 h rs) N ig ht O 3 (8 pm to 7 am ) 1 2 3
Figure 4. Correlations in O3 at urban (Ahmedabad) and its downwind rural (Khambat) sites.
The open circles are hourly average made from 7 days data. Curve 1, 2 and 3 show the increase in O3 from morning to afternoon hours, decrease in O3 from afternoon to evening
hours and decrease/increase in O3 during nighttime respectively at both the sites.
Fig. 4. Correlations in O3at urban (Ahmedabad) and its downwind rural (Khambat) sites. The open circles are hourly average made from 7 days data. Curve 1, 2 and 3 show the increase in O3 from morning to afternoon hours, decrease in O3 from afternoon to evening hours and decrease/increase in O3during nighttime, respectively at both the sites.
ACPD
4, 3359–3380, 2004
High ozone at rural sites in India
D. Chand and S. Lal
Title Page Abstract Introduction Conclusions References Tables Figures J I J I Back Close
Full Screen / Esc
Print Version Interactive Discussion © EGU 2004 Time (IST) 0 6 12 18 24 Ozone ( ppb v) 0 20 40 60 80 100 Ahmedabad Jan. 2001 Ahmedabad Jan. 2002 Khambat Jan. 2002 Khambat Jan, 26, 2001 Mt. Abu Jan. 2000 Mt. Abu Jan. 2001 Gadanki Feb. 2001
Figure 5. Comparison of the elevated ozone at rural site in downwind of the urban
environment (circles) along with the observations taken at other different sites in urban (triangles), rural (crosses) and free tropospheric environments (squares) in India. The data at Mt. Abu and Gadanki represent monthly averages.
Fig. 5. Comparison of the elevated ozone at rural site in downwind of the urban environment
(circles) along with the observations taken at other different sites in urban (triangles), rural (crosses) and free tropospheric environments (squares) in India. The data at Mt. Abu and Gadanki represent monthly averages.
ACPD
4, 3359–3380, 2004
High ozone at rural sites in India
D. Chand and S. Lal
Title Page Abstract Introduction Conclusions References Tables Figures J I J I Back Close
Full Screen / Esc
Print Version Interactive Discussion © EGU 2004 Time (IST) 0 6 12 18 24 CO (ppb v) 0 50 100 150 200 250 300 Mt Abu: Dec2000-Jan2001
Figure 6. Diurnal variation in average concentration of CO at Mt Abu for December 2000
and January 2001. The vertical bars show variability of 1σ in CO concentrations for both the months.
Fig. 6. Diurnal variation in average concentration of CO at Mt. Abu for December 2000 and
Jan-uary 2001. The vertical bars show variability of 1 σ in CO concentrations for both the months.