HAL Id: hal-00316608
https://hal.archives-ouvertes.fr/hal-00316608
Submitted on 1 Jan 1999
HAL is a multi-disciplinary open access
archive for the deposit and dissemination of sci-entific research documents, whether they are pub-lished or not. The documents may come from teaching and research institutions in France or abroad, or from public or private research centers.
L’archive ouverte pluridisciplinaire HAL, est destinée au dépôt et à la diffusion de documents scientifiques de niveau recherche, publiés ou non, émanant des établissements d’enseignement et de recherche français ou étrangers, des laboratoires publics ou privés.
Doppler sounder
D. M. Wright, T. K. Yeoman, T. B. Jones
To cite this version:
D. M. Wright, T. K. Yeoman, T. B. Jones. ULF wave occurrence statistics in a high-latitude HF Doppler sounder. Annales Geophysicae, European Geosciences Union, 1999, 17 (6), pp.749-758. �hal-00316608�
ULF wave occurrence statistics in a high-latitude HF Doppler sounder
D. M. Wright, T. K. Yeoman, T. B. Jones
Department of Physics and Astronomy, University of Leicester, University Road, Leicester, LE1 7RH, UK Received: 28 October 1996 / Revised: 2 November 1998 / Accepted: 16 November 1998
Abstract. Ultra low frequency (ULF) wave activity in the high-latitude ionosphere has been observed by a high frequency (HF) Doppler sounder located at Tromsù, Norway (69.7°N, 19.2°E geographic coordi-nates). A statistical study of the occurrence of these waves has been undertaken from data collected between 1979 and 1984. The diurnal, seasonal, solar cycle and geomagnetic activity variations in occurrence have been investigated. The ®ndings demonstrate that the ability of the sounder to detect ULF wave signatures maximises at the equinoxes and that there is a peak in occurrence in the morning sector. The occurrence rate is fairly insensitive to changes associated with the solar cycle but increases with the level of geomagnetic activity. As a result, it has been possible to characterise the way in which prevailing ionospheric and magnetospheric con-ditions aect such observations of ULF waves.
Key words. Ionosphere (auroral ionosphere; ionosphere -magnetosphere interactions) á Magnetospheric physics (MHD waves and instabilities).
1 Introduction
Ultra low frequency (ULF) waves are an important coupling mechanism between the magnetosphere and the ionosphere since they transfer energy and momentum. These processes are most signi®cant in the high-latitude ionosphere, where the magnetosphere-ionosphere interaction is strongest. The waves also act as an important diagnostic of magnetospheric morphol-ogy and dynamics. The ionosphere determines the boundary conditions for magnetospheric
magnetohy-drodynamic (MHD) wave modes and hence controls the transfer of energy and momentum. It also modi®es the magnetospheric wave signature, leading to rotation and attenuation of the wave magnetic signature detected on the ground. HF Doppler sounders oer an important experimental technique for investigating the ionospheric signatures of magnetospheric ULF waves.
The initial motivation for this study was to establish the optimum con®guration for a new high-latitude Doppler sounder experiment, called DOPE (Wright, 1996; Wright et al., 1997), and to determine the likelihood of the experiment observing pulsation eects at a given time of year for a given sounding frequency. The study has also enabled the eects of sunspot number, geomagnetic activity and season on the e-ciency of the Doppler system and on the intrinsic rate of ULF wave occurrence at high latitudes to be examined. The auroral zone is a new region for HF Doppler observations of ULF waves and Tromsù, Norway, is a site of unique scienti®c importance due to the colloca-tion of supporting EISCAT instrumentacolloca-tion. Thus the data presented here are of signi®cant importance to those performing experiments at this location. The comparison between the HF Doppler data set and data from other experimental techniques has also allowed some insight into the ULF wave modes and sources at high latitudes.
Previous ground-based studies of ULF wave occur-rence have involved high-latitude magnetometers (e.g. Gupta, 1973; Rao and Gupta, 1978; Gupta and Niblett, 1979; Ziesolleck and McDiarmid, 1995) and coherent VHF auroral radars such as the Scandinavian Twin Auroral Radar Experiment (STARE; Greenwald et al., 1978) (e.g. Walker and Greenwald, 1981) and the Sweden And Britain Radar-auroral Experiment (SA-BRE; Nielsen et al., 1983) (e.g. Mao Tian et al., 1991; Yeoman et al., 1992). In addition, similar studies employing satellite data have been published. For example, Arthur and McPherron (1981), Kokubun (1985), Kokubun et al. (1989), Anderson et al. (1990) and Takahashi and Anderson (1992) all made
observa-Correspondence to: D. M. Wright
tions of ULF waves in the magnetosphere with satellite borne magnetometers.
Field line resonances (Southwood, 1974; Chen and Hasegawa, 1974; given the nomenclature ``A-class'' by some authors because of their azimuthal polarisation) are toroidally polarised waves and as a result they are often observed simultaneously in space and at the ground. The magnetic perturbations associated with these waves are larger away from the magnetic equator (Kokubun, 1985) and are therefore thought to be resonating in the fundamental mode. The diurnal distribution of occurrence of these waves (Arthur and McPherron, 1981; Kokubun, 1985; Kokubun et al., 1989) as observed at geostationary orbit is reported to be bimodal with the occurrence rate maximising at dawn with a secondary peak at dusk. It has been suggested that the Kelvin-Helmholtz instability on the dawn and dusk ¯anks of the magnetopause is the driving mechanism for this type of wave. This sugges-tion is supported by ground-based observasugges-tions since the same bimodal asymmetrical occurrence distribution over local time is observed by high-latitude magnetom-eter stations (Gupta, 1973; Rao and Gupta, 1978; Gupta and Niblett, 1979; Ziesolleck and McDiarmid, 1995), and by the STARE VHF radar (Walker and Greenwald, 1981).
The type of ULF wave commonly known as giant (Pg) pulsations have been studied in some detail (Green, 1979; Hughes et al., 1979; Chisham and Orr, 1991). These waves are compressional in nature and their diurnal occurrence distribution peaks in the early morning (Chisham and Orr, 1991) and few, if any, have been observed after noon. They exhibit very large azimuthal wave numbers (Chisham and Orr, 1991, calculated an average value of 26) which explains why they are rarely observed by ground magnetometers which are insensitive to waves of small spatial scale sizes (Hughes and Southwood, 1976). Hughes et al. (1979) reported multi-satellite observations of a giant pulsation with an m-number of 100.
Gupta (1973) has studied the seasonal occurrence of Pc5s employing high-latitude magnetometer data over an interval of one year. This author reported that more observations of Pc5s occurred in the summer months than in the winter. However, subsequent studies by Gupta and Niblett (1979) report the seasonal variations in what they describe as ``quiet time Pc5s'' which are ®eld line resonances. Using a few high-latitude Canadi-an observatories they determined, from Canadi-an 11 year data set, that most events occurred between December and March of each year and a that a minimum of occurrence appeared around May±July. Rao and Gupta (1978) analysed Pc5 characteristics in an 11 year data set from a high-latitude magnetometer station. Their cumulative occurrence statistics had maxima at the equinoxes. More recently, Ziesolleck and McDiarmid (1995) analysed one year of data from four CANOPUS high-latitude obser-vatories. They concluded that there was no strong seasonal dependence on Pc5 occurrence rates. However, more events were recorded in the winter months January±March.
The variation of pulsation occurrence with the phase of the solar cycle has not, so far, been studied in great detail due to the lack of a data base which extends over many years. Gupta and Niblett (1979) examined 11 years of data from high-latitude magnetometer stations and concluded that if a relationship does exist, then it is a complex one. The number of events did increase with sunspot number but there were large perturbations from this trend. Rao and Gupta (1978) presented a statistical view of solar cycle related eects on Pc5 characteristics from an 11 year data set, span-ning 1962 to 1972, obtained at a high-latitude magne-tometer station. They found that the diurnal variation of wave occurrence, amplitude and period varied little with sunspot number although the measured Pc5 wave periods showed a strong correlation with sunspot number through the solar cycle. A prenoon occurrence peak, centred on 8 LT was consistent throughout the interval studied.
Several of the statistical studies previously discussed have attempted to link event occurrence to geomagnetic activity. Gupta and Niblett (1979) established that their quiet time events generally occurred at Kp£ 3 (Ap£ 15)
at all stations. Gupta (1973) found that the Pc5 events recorded over one year at high latitude had an occur-rence rate which appeared to increase linearly with Kp
up to 5 and with SKp(the sum of Kpindex over the day)
up to around 37. Walker and Greenwald (1981) reported that the occurrence of Pc5s in STARE data was proportional to Kp up to ~4 only and the dependence
became complicated at high values of Kp.
2 Instrumentation and data acquisition and selection 2.1 The high-latitude Doppler sounder
Radio wave techniques are a well-established method of probing the ionosphere. Some of these methods are better suited for observing changes in the ionosphere than others and can therefore detect the transient eects produced by ULF waves originating in the magneto-sphere. For this investigation an instrument known as a high frequency (HF) Doppler sounder was deployed at high latitude. It consisted of a frequency stable trans-mitter and a receiver which had a ground-separation of about 100 km, roughly along a magnetic meridian. A ®xed frequency continuous wave signal was radiated and after re¯ection by the ionosphere received at the ground. The Doppler technique utilises the fact that variations in the refractive index or bulk motion of the plasma along the path of the radio wave cause small shifts in the received frequency, due to changes in the phase path of the wave. Thus, the frequency shift, Df, is given by
Df ÿ1kdPdt 1 where P is the phase path of the signal and k is the free space signal wavelength. The measured Doppler shifts, which are typically less than 1 Hz, can thus indicate the characteristics of waves aecting the ionospheric plasma in the region being sounded. Fenwick and Villard (1960)
®rst suggested that changes in the Earth's magnetic ®eld were associated with observed shifts in the frequency of HF radio signals. Since then, short period oscillations of HF wave signal frequency have been correlated with magnetospheric ULF pulsations (which have periods in the range 0.1 s to 600 s) measured by ground magnetometers (e.g Jacobs and Watanabe, 1966; Klos-termeyer and RoÈttger, 1976; Menk, 1992). For a more detailed description of the Doppler technique see Georges (1967) and for a discussion on its application to observing ULF waves see Wright et al. (1997).
The HF Doppler sounder employed during this study did not have the ability to discriminate O- and X-mode signals. However, the results of observations from the DOPE sounder (Wright et al., 1997), which did dis-criminate these polarisations, demonstrate statistical observations which agree with those presented in sub-sequent sections of this study. Also, although the various modes of propagation (e.g. E, F1 or F2) are not distinguished, these statistics are still important from a purely operational point of view.
2.2 Sensitivity as a function of sounder frequency The sensitivity of a HF Doppler sounder increases as the sounder frequency approaches the ionospheric critical frequency (foF2). This is because small changes in the ionospheric electron density at the F-region peak lead to large changes in the group and phase path of the radio wave as it approaches its re¯ection point, and hence give a large Doppler frequency shift as indicated by Eq. (1). Thus, this eect acts as a magnifying mechanism for observations of ionospheric signatures. The amplitude of a ULF wave would therefore appear larger when the HF re¯ection point is nearer the F-region peak. 2.3 The high-latitude data set
Between 1979 and 1984 a ®xed frequency, continuous wave (CW) sounder situated in the vicinity of Tromsù,
Norway (69.7°N, 19.2°E geographic coordinates) was operated by the Leicester group (Robinson and Jones, 1980). The HF CW signal was transmitted at a low power (~20 W) over a near vertical path. The signal frequency was ®xed at 4.4 MHz prior to September 1979 and at 3.5 MHz after this time which provided a ray re¯ection point in the F-region ionosphere in both cases. In this instrument the received linear-mode signal was mixed with a secondary signal at an intermediate frequency (IF) in the receiver until an audio tone at less than 12 Hz (which represented the Doppler shift plus some arbitrary frequency oset) was obtained. This tone was recorded on a very slow moving analogue magnetic tape. The tapes were subsequently converted to analogue records on a paper roll by utilising a `Rayspan' analogue frequency analyser (Robinson, 1983). The output displayed the shift in frequency of the ionospherically re¯ected signal as a function of time. Time marks provided by a time code generator were also recorded on the tape. These appeared as marks every 10 min on the `Rayspan' traces. The sounder which recorded the data analysed in the present study formed part of a spaced multiple transmitter-receiver system originally deployed for studies of acoustic gravity wave (AGW) propagation (e.g. Hines, 1960; Georges, 1967). The data from this experiment during this interval have been re-examined in order to identify ULF wave signatures and a statistical study of the occurrence of these waves has been undertaken.
2.4 Event selection
In total, 42 whole or partial months of data were available for study. This comprised all data in the interval 1979±84 which was available on paper records. Events were selected visually following the criteria that the wave periods were greater than 60 s and less than 1000 s; and that the peak-to-peak Doppler shift was at least 0.2 Hz. The smallest waves which could be visually identi®ed on the paper records de®ned the lower wave period limit. The upper limit for the wave period covers
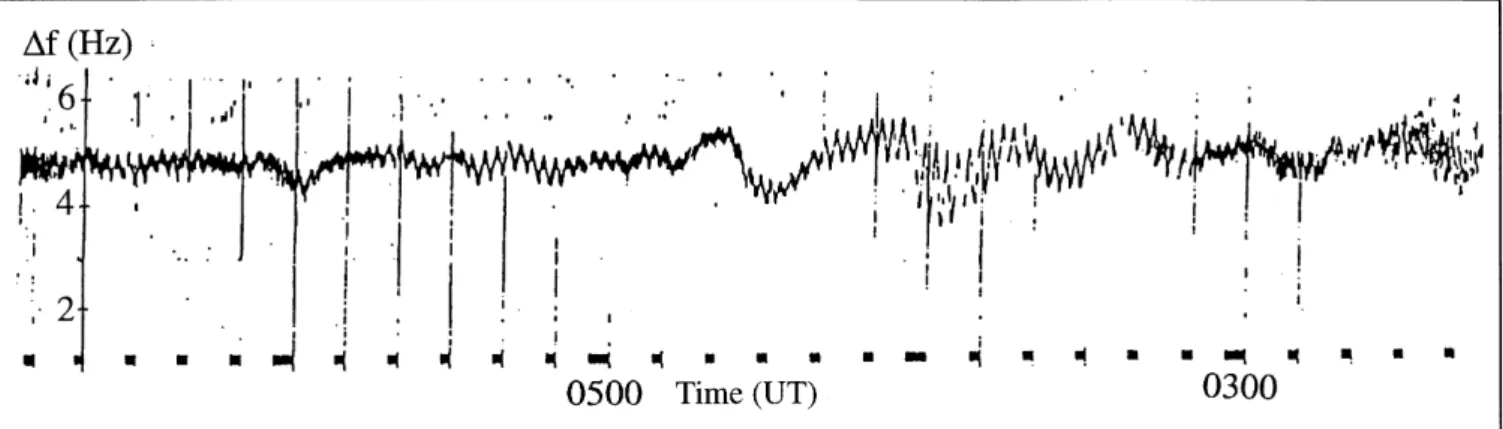
Fig. 1. A typical example of ULF wave signature in the analogue Doppler records from Tromsù between 1979 and 1984. A ULF wave with period of about 2 min is modulated by an acoustic gravity wave
with a period of about 30 min. Time runs from right to left on this record (after Robinson and Jones, 1980)
the longest periods of Pc5 waves (exhibiting the period range 150±600 s) which is smaller than the Brunt-VaÈisaÈlaÈ period (Hines, 1960) which governs the low period cut-o of about 12±15 minutes for the AGWs at F-region heights (Georges, 1967). Thus, atmospheric AGWs are excluded from this study. An example of the type of event selected for this study is reproduced in Fig. 1. Note that on this Fig. time runs from right to left. The Fig. illustrates the temporal variation of frequency shift in the received signal. An AGW with period around 30 min is modulated by a shorter period ULF oscillation (about 2 min) commencing some time soon after 03:00 UT. This pulsation lies in the Pc4 period range (45±150 s).
2.5 Compiling the statistical data set
Analogue records such as that in Fig. 1 were examined visually in 3 h Universal Time (UT) sections. The intervals were categorised in one of three ways. Firstly,
they were either periods when a good signal was being received or periods when a poor signal was being received. A `poor' signal is de®ned as one where the signal had either penetrated the ionosphere, which would lead to a very low received signal amplitude, or was spread in frequency, most probably due to geo-magnetic disturbance. A `good' signal was one where a reasonably clear trace, resulting from a ray path with a specular ionospheric re¯ection, is apparent. It is necessary to make such a de®nition as no amplitude information was included on the original analogue paper records. The intervals with good signals have been further subdivided into two additional categories, depending on whether waves matching the selection criteria were observed during each 3 h interval. This method was applied only to times when the system was operating normally and not, say, when the transmitter was inoperational. If a ULF wave was observed at any time during (or throughout) the 3 h interval then the occurrence of waves in that UT bin was incremented by one.
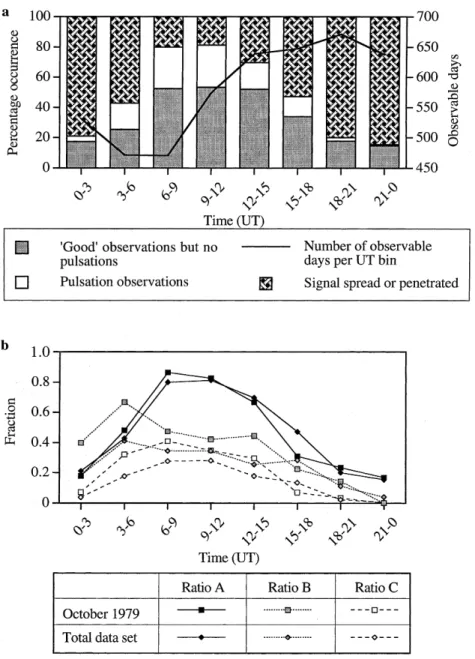
Fig. 2. a The occurrence distribution for the whole data set. Data include all available observations between January and December from 1979 to 1984. b The relative occurrence of ratios A, B and C (see Table 1) for October 1979 and for the whole data set
A typical occurrence plot for the three categories of observation obtained from this data set is given in Fig. 2a. This Fig. represents the total data set for this study and illustrates the relative occurrence of each of the three categories de®ned above for each of the three hour UT bins. Each bin is scaled to 100% which refers to the total number of observations made for that bin value. The total number of days of observation for each UT bin is represented by the overlaid line.
3 Results of the occurrence statistics
Figure 2b illustrates the relative occurrences of `good' observations to all observations, henceforth to be known as ratio A, and is a measure of the suitability of the ionosphere for Doppler studies at this frequency. Ratio B indicates the number of pulsations recorded out of all the `good' observations. Whilst several previous authors (e.g. Menk, 1992; Tedd et al., 1989) have demonstrated that geomagnetic pulsations can be present without the occurrence of an observable ionospheric signature, ratio B still provides a measure of the intrinsic occurrence of the ionospheric signatures of pulsations. Ratio C is that of the number of pulsations to all observations. This is a measure of the `eectiveness' of the Doppler system for pulsation observation. These ratios are summarised in Table 1 and displayed, in Fig. 2b, for the total data set and for the example month of October 1979, considered purely for comparative purposes. The total data set represents the average picture over all months and includes data taken at dierent phases of the solar cycle. The data points displayed in Fig. 2b and subsequent plots of this type have associated standard deviations in the range 0.025 to 0.039.
3.1 Diurnal variation in ULF wave occurrence
Ratios A and B exhibit very dierent behaviour and are consistent for both the intervals investigated in Fig. 2b. There is a marked diurnal variation in the occurrence of useful observations. No data were obtained at night when the signals had penetrated the ionosphere. The form of ratio A is similar to that of the diurnal variation of foF2 (e.g. see Fig. 3), the maximum frequency at which an O-mode signal can re¯ect in the ionosphere. However, ratio B does not follow this pattern. In both
cases, the ratio of the number of observed pulsation type events to the number of useful observations peaks in the 03 to 06 UT bin and tails o throughout the day approaching zero in the 21 to 00 UT bin. The sensitivity of the Doppler diagnostic is expected to modulate, to some extent, the behaviour of ratio B by being insensitive to wave signatures at certain times of day
Table 1. De®nitions of the three ratios utilised in the statistical study and their interpretation in the context of the Doppler sounder
Ratio De®nition Interpretation A The relative occurrence of `good'
observations to all the observations made (including intervals when the signal had penetrated)
The suitability of the ionosphere for Doppler studies
B The fraction of `good' observations
which are pulsations The intrinsic occurrence of theionospheric signatures of ULF waves C The ratio of pulsation occurrence to
all observations made The `eectiveness' of the sounderfor observing ULF waves
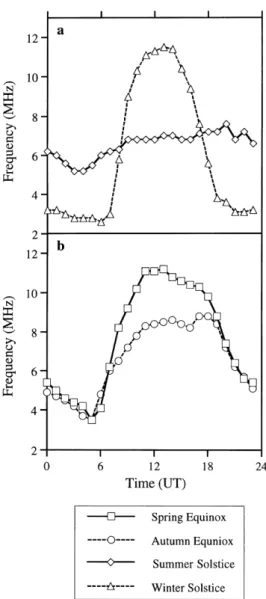
Fig. 3a, b. The diurnal variation of the ionospheric critical frequency (foF2) typical during a the solstices and b the equinoxes. The data were recorded at SodankylaÈ, Finland (67.4°N, 26.6°E geographic) in 1982
(see Sect. 2.2). This is particularly the case for ULF wave signatures which have smaller eects on the ionosphere than AGWs (Hines, 1960). The value of ratio C in Fig. 2b represents the relative number of pulsation events in all observations per UT bin. It is a convolution of ratios A and B.
3.2 Seasonal eects
Figure 4 illustrates the occurrence of waves during the solstices and equinoxes in the same format as Fig. 2b. Table 2 indicates the months included in the four panels of Fig. 4. In each case data from the two months around the equinox or solstice for each year were selected if available.
Although the full width at half maximum of ratio A for each season is dierent, the shape of the distribution of ratio A is similar for the equinoxes and winter solstice, with a UT distribution for each which resembles that in Fig. 2b. However, the form of ratio A around the summer solstice is broader. Figure 3 illustrates median foF2 values around the equinoxes and solstices at SodankylaÈ, Finland, which is at a similar latitude to Tromsù. Data for the summer solstice are considerably dierent to those in the other seasons, a fact which supports the suggestion in the previous section that ratio A is dependent on foF2.
Ratio B in Fig. 4 demonstrates that although the number of useful observations made in the summer (ratio A) is, averaged over all UT, the highest, pulsation occurrence is optimised at the equinoxes and ratio B peaks there. Ratio C is also displayed in Fig. 4. It gives an indication of the best season for the DOPE exper-iment operating at a similar frequency and suggests that the worst time for making useful measurements at the sounder frequency employed in this study is in the summer.
3.3 Variations associated with the solar cycle
Figure 5a, b illustrates averaged distributions for two separate intervals in the 11 year cycle. For each panel four months of data from January to April are included. One panel is for 1980 (Fig. 5a) and the other is for 1984 (Fig. 5b). The average sunspot numbers for these intervals were about 160 and 60 respectively.
The most apparent feature of Fig. 5a,b is that the ratio of useful observations to total observations (ratio A) is much larger in the 1980 interval than in the 1984 interval. Consideration of the typical foF2 values during these intervals helps to explain this observation. Median foF2 values corresponding to the 1980 data, which is close to sunspot maximum, have a peak value in excess of 11 MHz and are consistently higher throughout the day than in 1984. The overall change in foF2 is considerably greater than those correspond-ing to the 1984 interval, which have a peak value of about 7 MHz. This would suggest that the ®xed frequency diagnostic in the 1984 interval would have penetrated the F-layer more and reduced the number of useful observations. In contrast, the fraction of `good' observations which are pulsations (ratio B) is much higher for the 1984 interval.
Fig. 4a±d. The diurnal variation of ratios A, B and C (see table 1) observed at Tromsù around a spring equinox, b summer sol-stice, c autumn equinox and d winter solstice
Table 2. Data from 1979±84 taken to compile the four panels of Fig. 4
Panel Data utilised to compile panel Spring equinox 7 months of March/April data Summer solstice 7 months of June/July data
Autumn equinox 7 months of September/October data Winter solstice 8 months of December/January data
3.4 Comparison with levels of geomagnetic activity The average level of the Ap index, a measure of
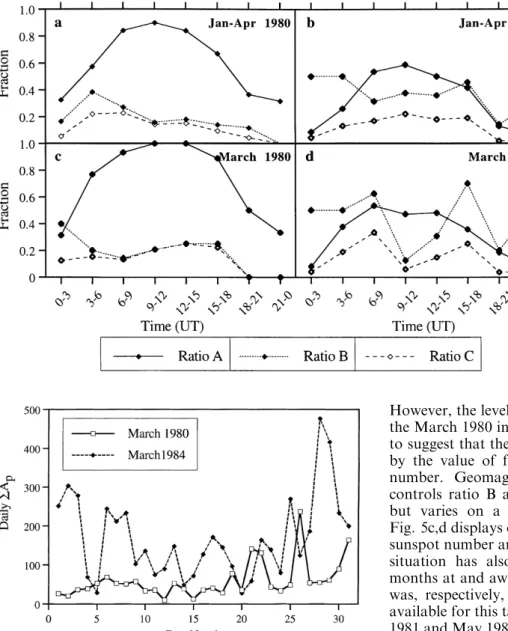
geomagnetic activity, was considerably higher in the whole interval January±April 1984 than the equivalent period in 1980. In order to make a reasonable determi-nation of the variation of ratio B with activity, two monthly intervals, March 1980 and March 1984 (Fig. 5c,d), have been chosen for study. By selecting the same month for the two dierent years, seasonal variations have been suppressed. Ap has been summed
over all three hour bins each day for each of these months and is illustrated in Fig. 6. This method allows the average activity level over the month to be plotted and demonstrates that March 1984 was much more active than March 1980.
The number of observed pulsation events relative to the number of useful observations (ratio B) is clearly larger for the 1984 interval than for that of March 1980.
However, the level of ratio A is considerably greater for the March 1980 interval. From this, it seems reasonable to suggest that the value of ratio A is mainly controlled by the value of foF2 which is dependent on sunspot number. Geomagnetic activity, on the other hand, controls ratio B and is also related to the solar cycle, but varies on a much shorter time scale. Although Fig. 5c,d displays data for intervals where there is a high sunspot number and low Apand vice versa, the opposite
situation has also been tested employing data from months at and away from sunspot maximum, where Ap
was, respectively, high and low. The amount of data available for this task was limited but the intervals April 1981 and May 1983 were compared. The former interval had an average value of daily summed Apof 28 and an
average diurnal value of ratio B of 0.213 for the month. This compares to values of 22 and 0.165 respectively for the later interval. The hypothesis that geomagnetic activity controls ratio B, thus, remains consistent with the behaviour determined from the months of March 1980 and March 1984.
4 Discussion
4.1 Diurnal occurrence distributions
The diurnal variation of the ionospheric critical frequen-cy (foF2) aects the ability of the Doppler system to observe ULF wave signatures throughout the day. Ratio A, illustrated in Fig. 2b, follows the same form as the diurnal variation of foF2 (e.g. Fig. 3). As the foF2 decreases below the sounder frequency the signal pene-trates the ionosphere and observations are impossible, leading to a corresponding decrease in ratio A. Also, the peak value of ratio A approximately coincides with the maximum diurnal value of foF2. In order to evaluate
Fig. 5a±d. The diurnal varia-tion of ratios A, B and C (see Table 1) observed at Tromsù during the intervals a January± April 1980, b January±April 1984, c March 1980 and d March 1984.
Fig. 6. The variation of the daily sum of Ap(SAp) over the months of
March 1980 and March 1984
the intrinsic ULF wave occurrence rate it is, then, important to consider the relative number of events which occur for conditions when good data, as de®ned earlier, are available (ratio B). From this point of view, ratio B gives a better indication of the intrinsic distribu-tion of occurrence of pulsadistribu-tion events than does ratio C. The total data set (Fig. 2a) for this study does not discriminate between particular types of wave in the Pc4 or Pc5 period range. The data consistently display a morning peak in ratio B (Fig. 2b), although events are observed throughout all UT (LT for these results is equal to UT + 1). It is reasonable to suggest that the morning peak is related to either the resonant excitation of ®eld lines by the action of the solar wind generating a Kelvin-Helmholtz instability on the dawn ¯ank of the magnetosphere or by a particle driven mechanism such as that suggested to be responsible for the occurrence of giant (Pg) pulsation signatures observed in the morning
sector (Green, 1979, Chisham and Orr, 1991).
There are many documented examples of observa-tions of ®eld line resonances in the morning sector by high-latitude ground magnetometers (Gupta, 1973; Rao and Gupta, 1978; Gupta and Niblett, 1979; Ziesolleck and McDiarmid, 1995). Ionospheric signatures of these waves have also been observed by VHF (Walker and Greenwald, 1981) and HF (Provan and Yeoman, 1997; Provan, Private Communication, 1998) radars and have also been detected by orbiting satellites (e.g. Kokubun, 1985). In addition, it has been demonstrated (Chisham and Orr, 1991) that giant pulsations have small spatial scale sizes in the ionosphere. Although ground magne-tometers often do not resolve such waves (Hughes and Southwood, 1976), the Doppler sounder at Tromsù could have done so, as this instrument has a far higher spatial resolution (Georges, 1967; Wright, 1996; Wright et al., 1997). Thus the HF Doppler system is sensitive to ionospheric oscillations with a very small horizontal scale length.
It is important to note that the sounders response to the diurnal variation of foF2 will in¯uence ratio B. During intervals such as winter, where the peak daily foF2 is larger than the transmitted frequency, the sounder sensitivity would maximise in the morning and evening as foF2 passes close to the signal frequency and this could contribute to the diurnal variation of ratio B. However, an examination of Fig. 4a, b indi-cates that there is little dierence between the shape of the diurnal distributions of ratio B at the spring equinox and the summer solstice, despite the fact that the diurnal foF2 response is much ¯atter in the summer (see Fig. 3). The morning peak is more pronounced at the equinoxes than at the summer solstice, a feature which may be the result of Doppler sounder sensitivity enhancements.
The diurnal distribution of ratio C in Fig. 2b (also Fig. 4) has a daytime peak which is broader than that for ratio A in all cases and an amplitude which is lower than that for either ratio A or ratio B. This is a consequence of the fact that ratio C is a convolution of the other two. That is, ratio C includes information on both the intrinsic pulsation occurrence rate and the
diurnal variation of foF2. It indicates that the eec-tiveness of the Doppler sounder for ULF wave observations under these conditions and at this sound-er frequency, is restricted to the 03 to 18 UT (0405 to 1920 LT) interval and is a maximum in the 06 to 09 UT (0708 to 1011 LT) range.
4.2 Seasonal variations
The shape of the diurnal distribution of ratio A for each equinox and solstice, as illustrated in Fig. 4, is a response to the seasonal change in the diurnal foF2 variation. Each distribution is dierent but that ob-served at the summer solstice is noticeably broader than any of the others. As can be seen in Fig. 3, foF2 varies much less throughout the day in summer relative to that in the winter. Thus, where foF2 is high enough for signal propagation in summer, the signal will not penetrate so quickly in the evening or appear as suddenly in the morning.
Fig. 4 illustrates that the equinoxes provided the largest number of events relative to the available amount of good data (ratio B). At the winter solstice this ratio was higher than at the summer solstice. The intrinsic occurrence of ULF waves reaches a maxi-mum at the autumn equinox and is minimaxi-mum in summer. These results suggest that the Doppler observations are not inconsistent with those of other authors, except Gupta (1973), and are in good agreement with the ®ndings of Rao and Gupta (1978). Conditions for observing ULF waves and their signatures are at an optimum at the equinoxes because at these times the ionospheres of the two terrestrial hemispheres are nearest to being equal with similar ionospheric conductivities. In addition, ratio C clearly demonstrates that the Doppler sounder operating at these frequencies is least eective at making high-latitude ULF wave observations during the summer months.
4.3 Changes throughout the solar cycle
Figure 5a, b illustrates the occurrence distributions for the intervals January±April 1980 and January± April 1984, respectively at solar maximum and near solar minimum. Ratio A, for these distributions is signi®cantly higher in January±April 1980 than for that in January±April 1984. The sunspot number slowly, but strongly, modulates the diurnal change in foF2 and this, in turn, leads to the observed change in ratio A.
The diurnal distribution of ratio B does not change appreciably between the intervals in Fig. 5a, b and as such con®rms the observation by Rao and Gupta (1978) that the diurnal occurrence distribution changes little throughout a solar cycle. Despite the fact that the number of pulsation observations at the ground are observed to be higher at solar maximum (Gupta and Niblett, 1979), the amplitude of ratio B is higher for the
1984 interval than for that in 1980 and, therefore, does not follow the same response to the solar cycle variation demonstrated by ratio A. This fact is consistent with the suggestion, in Sect. 3, that the intrinsic occurrence of ULF waves is controlled by the level of geomagnetic activity, as reported by Gupta and Niblett (1979), and will be discussed further in Sect. 4.4. Ratio C is roughly the same for each interval.
4.4 Geomagnetic activity
The data illustrated in Fig. 5 and 6 demonstrate that the intrinsic occurrence of ULF waves in HF Doppler data (ratio B) for a given month is dependent on the level of geomagnetic activity and increases with the value of Ap.
Ratio A is strongly dependent on the local foF2 which is related to the variation of sunspot number over an 11 year cycle. Geomagnetic activity, on the other hand, varies on a much shorter time scale and controls the form of ratio B. Thus, it is possible to separate out these two eects in the data set. The fact that ratio B is signi®cantly decoupled from the phase of the solar cycle explains why the occurrence of ULF waves, observed over a solar cycle (Gupta and Niblett, 1979), varies so much around the general trend. The dierence in ratio B between the intervals of March 1980 and March 1984 (Fig. 5c, d respectively) is followed by ratio C which indicates that the eectiveness of the Doppler sounder to observe ULF wave signatures increases considerably during such a period. In addition, there is evidence that the equinoxes are also, on average, geomagnetically active (e.g. Bartels, 1932; McIntosh, 1959) and this activity dependence will aect the seasonal variation of ratio B discussed in Sect. 4.2.
Although this work cannot provide an in-depth study of the relationship between event occurrence in the Doppler data and the level of Ap or Kp, it is still in
agreement with the observations of Gupta (1973) and Walker and Greenwald (1981) who all found a linear increase in occurrence with Kp up to around 4 or 5.
These authors oer work on Pc5 waves, however. It is unclear how the Pc4 events, which are undoubtedly present in this data set, aect this comparison. The work of previous authors has made it clear that dierent classes of waves have dierent dependencies on activity, so it is not appropriate to pursue this here.
5 Summary
The statistical study presented here has characterised the occurrence of wave signatures, in the ULF range, in high-latitude Doppler sounder data and the way in which prevailing ionospheric and magnetospheric conditions aect observations. The eects of season, solar cycle and level of geomagnetic activity on Doppler system sensi-tivity and pulsation occurrence are determined from a sizeable data set covering an interval of ®ve years.
The relative number of useful observations (ratio A) made by the sounder during the period when data were
recorded are strongly related to the diurnal, seasonal and solar cycle variations in the ionospheric critical frequen-cy, foF2. The diurnal variation of ratio A consistently peaks before 12:00 UT and has a minimum around midnight. Bearing in mind that it has not been possible to subdivide the observed events into types according to suggested generation mechanisms, it is concluded that the intrinsic diurnal distribution of event occurrence when useful data are available (ratio B) is consistent with those reported earlier by other authors utilising alterna-tive ground and space-based instrumentation. The dis-tribution peaks in the morning sector which suggests that a signi®cant contribution to the observed signatures are related to ®eld line resonances generated by either the Kelvin-Helmholtz instability at the dawn ¯ank of the magnetopause or by waves generated by a particle driven mechanism such as that responsible for giant pulsations. Ratio B is controlled by the level of geomagnetic activity. This highlights the need for care when deconvolving the eects of solar cycle from those of geomagnetic activity. To date, there have been few studies into the relationship between solar cycle phase and ULF wave observations, and hence this study adds signi®cantly to current knowledge on the subject.
Ratio C is a measure of the eectiveness of the system for observing ULF waves. It demonstrates that a complex convolution of ionospheric and geomagnetic conditions ultimately controls the ability of a Doppler sounder to observe ULF wave signatures. Information on which conditions and times give the best results for such observations are provided by ratio C. It is clear that a Doppler sounder operating on a ®xed frequency is least eective at observing ULF waves during the summer months.
The results presented in this work have been impor-tant in the development of a new experiment, called DOPE, designed to investigate ULF waves at high latitudes. With the assistance of the results presented in this study, two papers (Wright et al., 1997; 1998) regarding data from the DOPE system have already been published. Despite the fact that the observations detailed here are only applicable at the geographical location of Tromsù, this site inside the auroral zone is of unique scienti®c importance due to the wealth of collocated supporting instrumentation.
Acknowledgements. The authors wish to thank the Particle Phys-ics and Astronomy Research Council (PPARC) for funding the work presented in this paper, sta at the World Data Centre WDC-C1 for providing data and Prof. Terry Robinson of the Radio and Space Plasma Physics group, Leicester, for his involve-ment in the original collection of the Doppler data.
Topical Editor K.-H. Glassmeier thanks A. Rodger, P. Sutclie and E. Neilsen for their help in evaluating this paper.
References
Anderson, B. J., M. J. Engebretson, and S. P. Rounds, A statistical study of Pc3±5 pulsations observed by the AMPTE/CCE magnetic ®elds experiment-1. Occurrence distributions, J. Geo-phys. Res., 95, 10 495, 1990.
Arthur, C. W., and R. L. McPherron, The statistical character of Pc4 magnetic pulsations at synchronous orbit, J. Geophys. Res., 86, 1325, 1981.
Bartels, J., Terrestrial-magnetic activity and its relations to solar phenomena, Terr. Magn. Atmos. Elect., 37, 1, 1932.
Chen, L., and A. Hasegawa, A theory of long period magnetic pulsations, 1. Steady State Excitation of Field Line Resonances, J. Geophys. Res., 79, 1024, 1974.
Chisham, G., and D. Orr, Statistical studies of giant pulsations (Pgs): harmonic mode., Planet. Space Sci., 37, 999, 1991. Fenwick, R. C., and O. G. Villard, Continuous recordings of
frequency variation of the WWV-20 signal after propagation over a 4000 km path., J. Geophys. Res., 67, 3249, 1960. Georges, T. M., Ionospheric eects of atmospheric waves, E. S.
S. A. technical report, Institute of Environmental Research (Boulder, Colorado), I. E. R. 57-I. T. S. A. 54, October 1967.
Green, C. A., Observations of Pg pulsations in the northern auroral zone and at lower latitude conjugate regions., Planet. Space Sci., 27, 63, 1979.
Greenwald, R. A., W. Weiss, E. Nielsen, and N. P. Thomson, STARE: a new radar auroral backscatter experiment in northern Scandinavia, Radio Sci., 13, 1021, 1978.
Gupta, J. C., Occurrence studies of geomagnetic micropulsa-tions Pc5 at high latitudes, J. Atmos. Terr. Phys., 35, 2217, 1973.
Gupta, J. C., and E. R. Niblett, On the quiet-time Pc5 pulsation events (spacequakes), Planet. Space Sci., 27, 131, 1979. Hines, C. O., Internal atmospheric gravity waves at ionospheric
heights, Can. J. Phys., 38, 1441, 1960.
Hughes, W. J., and D. J. Southwood, The screening of micropul-sation signals by the atmosphere and ionosphere, J. Geophys. Res., 81, 3234, 1976.
Hughes, W. J., R. L. McPherron, J. N. Bar®eld, and B. H. Mauk, A compressional Pc4 pulsation observed by three satellites in geostationary orbit near local midnight., Planet. Space Sci., 27, 821, 1979.
Jacobs, J. A., and T. Watanabe, Doppler frequency changes in radio waves propagating through a moving ionosphere., Radio Sci., 1, 257, 1966.
Klostermeyer, J., and J. RoÈttger, Simultaneous geomagnetic and ionospheric oscillations caused by hydromagnetic waves. Plan-et. Space. Sci., 24, 1065, 1976.
Kokubun, S., Statistical characteristics of Pc5 waves at geostation-ary orbit, J. Geomag. Geoelectr., 37, 759, 1985.
Kokubun, S., K. N. Erickson, T. A. Fritz, and R. L. McPherron, Local time asymmetry of Pc4±5 pulsations and associated particle modulations at synchronous orbit, J. Geophys. Res., 94, 6607, 1989.
Mao Tian, T. K. Yeoman, M. Lester, and T. B. Jones, Statistics of Pc5 pulsation events observed by SABRE, Planet. Space Sci., 39, 1239, 1991.
McIntosh, D. H., On the annual variation of magnetic distur-bances, Philos. Trans. R. Soc. London Ser. A, 251, 525, 1959. Menk, F. W., Characterization of ionospheric Doppler oscillations
in the Pc3±4 and Pi2 pulsation frequency range., Planet. Space Sci., 40, 495, 1992.
Nielsen, E., W. Guttler, E. C. Thomas, C. P. Stewart, T. B. Jones, and A. Hedburg, SABRE: a new radar auroral backscatter experiment., Nature, 304, 712, 1983.
Provan, G., and T. K. Yeoman, A comparison of ®eld-line resonances observed at the Goose Bay and Wick radars., Ann. Geophysicae, 15, 231, 1997.
Rao, D. R. K., and J. C. Gupta, Some features of Pc5 pulsations during a solar cycle, Planet. Space Sci., 26, 1, 1978.
Robinson, T. R., Modi®cation of the high-latitude ionosphere by high power radio waves., Ph D Thesis, University of Leicester, UK, June 1983.
Robinson, T. R., and T. B. Jones, A preliminary report on the Tromsù Doppler experiment, Ionospheric Physics Group Inter-nal Technical Report, 25, January 1980.
Southwood, D. J., Some features of ®eld line resonances in the magnetosphere., Planet. Space Sci., 22, 483, 1974.
Takahashi, K., and B. J. Anderson, Distribution of ULF energy (f < 80 mHz) in the inner magnetosphere: a statistical analysis of AMPTE CCE magnetic ®eld data, J. Geophys. Res., 97, 10 751, 1992.
Tedd, B. L., K. D. Cole, and P. L. Dyson, The association between ionospheric and geomagnetic pulsations in the Pc3±4 range at mid-latitudes, Planet. Space Sci., 37, 1079, 1989.
Walker, A. D. M., and R. A. Greenwald, Statistics of occurrence of hydromagnetic oscillations in the Pc5 range observed by the STARE auroral radar, Planet. Space Sci., 29, 293, 1981. Wright, D. M., HF Doppler observations of ULF waves: system
development and high-latitude results, Ph D Thesis, University of Leicester, UK, August 1996.
Wright, D. M., T. K. Yeoman, and P. J. Chapman, High-latitude HF Doppler observations of ULF waves: 1. Waves with large spatial scale sizes, Ann. Geophysicae, 15, 1548, 1997.
Wright, D. M., T. K. Yeoman, and J. A. Davies, A comparison of EISCAT and HF Doppler observations of a ULF wave, Ann. Geophysicae, 16, 1190, 1998.
Yeoman, T. K., Mao Tian, M. Lester, and T. B. Jones, A study of Pc5 hydromagnetic waves with equatorward phase propaga-tion., Planet. Space Sci., 40, 797, 1992.
Ziesolleck, C. W. S., and D. R. McDiarmid, Statistical survey of auroral latitude Pc5 spectral and polarization characteristics, J. Geophys. Res., 100, 19 299, 1995.