HAL Id: hal-00301893
https://hal.archives-ouvertes.fr/hal-00301893
Submitted on 1 Nov 2005HAL is a multi-disciplinary open access
archive for the deposit and dissemination of sci-entific research documents, whether they are pub-lished or not. The documents may come from teaching and research institutions in France or abroad, or from public or private research centers.
L’archive ouverte pluridisciplinaire HAL, est destinée au dépôt et à la diffusion de documents scientifiques de niveau recherche, publiés ou non, émanant des établissements d’enseignement et de recherche français ou étrangers, des laboratoires publics ou privés.
Wind-profiler observations of gravity waves produced by
convection at mid-latitudes
Y. G. Choi, S. C. Lee, A. J. Mcdonald, D. A. Hooper
To cite this version:
Y. G. Choi, S. C. Lee, A. J. Mcdonald, D. A. Hooper. Wind-profiler observations of gravity waves produced by convection at mid-latitudes. Atmospheric Chemistry and Physics Discussions, European Geosciences Union, 2005, 5 (6), pp.11029-11054. �hal-00301893�
ACPD
5, 11029–11054, 2005 Convective gravity waves at mid-latitudes Y. G. Choi et al. Title Page Abstract Introduction Conclusions References Tables Figures J I J I Back CloseFull Screen / Esc
Print Version Interactive Discussion
EGU
Atmos. Chem. Phys. Discuss., 5, 11029–11054, 2005 www.atmos-chem-phys.org/acpd/5/11029/
SRef-ID: 1680-7375/acpd/2005-5-11029 European Geosciences Union
Atmospheric Chemistry and Physics Discussions
Wind-profiler observations of gravity
waves produced by convection at
mid-latitudes
Y. G. Choi1, S. C. Lee2, A. J. McDonald3, and D. A. Hooper4 1
Geophysical Prospecting Laboratory, Seoul National University, Korea
2
Department of Physics, Kangnung National University, Korea
3
Department of Physics and Astronomy, University of Canterbury, Private Bag 4800, Christchurch, New Zealand
4
Rutherford Appleton Laboratory, Chilton, Didcot, Oxon, OX11 0QX, UK
Received: 12 September 2005 – Accepted: 13 October 2005 – Published: 1 November 2005 Correspondence to: A. J. McDonald ([email protected])
ACPD
5, 11029–11054, 2005 Convective gravity waves at mid-latitudes Y. G. Choi et al. Title Page Abstract Introduction Conclusions References Tables Figures J I J I Back CloseFull Screen / Esc
Print Version Interactive Discussion
EGU Abstract
This work presents a case study which includes regions of large rapidly varying vertical velocities observed by a VHF wind-profiler at Aberystwyth (52.4◦N, 4.1◦W). Analysis indicates that this region is associated with gravity waves above the tropopause level and simultaneous regions of convective activity below the tropopause level. This case
5
study also suggests that convective activity can be identified effectively by finding peri-ods of large uncertainties on the derived velocities. These regions are hypothesized to be related to regions of small-scale inhomogeneity in the wind field.
Examination suggests that the large vertical velocity fluctuations above these con-vective regions are short period gravity wave packets as expected from theory. In
10
addition the vertical flux of the horizontal momentum associated with the gravity waves also displays the pattern of reversal observed in previous studies.
1. Introduction
The aim of this study is to show a case study observed with wind profiler data from a mid-latitude site where convection has been identified as the probable cause of
en-15
hanced gravity wave activity and compare this measurement with previous observa-tions and theory. Observaobserva-tions identified as convective activity at mid-latitudes have previously been discussed inHooper et al.(2005). As indicated inHooper et al.(2005) a number of different signals are generally observed during periods of atmospheric convection, these include large rapidly varying vertical velocities, large values of
verti-20
cal spectral width and occasionally enhanced signal powers in the upper troposphere. However, unusually during this event large vertical velocity perturbations are also ob-served above the tropopause level. It is proposed that these enhanced vertical velocity perturbations are associated with internal gravity waves which are considered to be generated by the convection at lower altitudes.
25
ACPD
5, 11029–11054, 2005 Convective gravity waves at mid-latitudes Y. G. Choi et al. Title Page Abstract Introduction Conclusions References Tables Figures J I J I Back CloseFull Screen / Esc
Print Version Interactive Discussion
EGU
generated gravity waves on the large scale circulation of the middle atmosphere (Song
et al.,2003;Alexander and Holton,2004). In particular, the importance of short period gravity waves which are preferentially produced by convection has been highlighted (Beres et al.,2002). These waves have been singled out because of the large vertical fluxes of the horizontal momentum associated with these waves. In addition,Song et al.
5
(2003) has indicated that more work is necessary to understand these waves impacts and generation mechanisms. The global importance of convective gravity waves has also been highlighted byTsuda and Hocke(2004) which reviewed a number of studies using the GPS radio occultation technique. In particular, their study indicates that the gravity wave energy in the stratosphere is largely enhanced over the region of active
10
convection in the tropics, such as Indonesia, South America, and Africa, indicating that convection is the major source of gravity waves at low latitudes. This interpretation has also been supported by model studies (Alexander et al.,2002;Kawatani et al.,2003).
Convection and gravity waves associated with convection have previously been ob-served at tropical latitudes by wind-profilers, aircraft and radiosondes. The work in
15
the tropics includesVincent et al.(2004) which discuss observations of gravity waves made by a wind profiler during the Darwin Area Wave EXperiment (DAWEX) campaign which are shown to be generated by convection. Alexander et al. (2000) used wind measurements from the ER2 aircraft in the stratosphere to obtain information on the horizontal momentum flux carried by gravity waves. Their study compared the cloud
20
top brightness temperature below the aircraft, which is assumed to be an indicator of deep convective activity, with momentum flux data taken by the ER2 aircraft during the STEP project. Their work indicated a striking correlation between cold, high clouds and large wave momentum flux.Dewan et al.(1998) explained concentric circles observed in satellite data as gravity waves originating from isolated thunderstorms.Karoly et al.
25
(1996) examined gravity wave activity associated with tropical convection detected in TOGA COARE sounding data.
Wind-profiler observations with some similarities to those indicated inVincent et al.
ACPD
5, 11029–11054, 2005 Convective gravity waves at mid-latitudes Y. G. Choi et al. Title Page Abstract Introduction Conclusions References Tables Figures J I J I Back CloseFull Screen / Esc
Print Version Interactive Discussion
EGU
addition work discussed inDhaka et al. (2005) uses two days of continuous data ac-quired using the Equatorial Atmosphere Radar (EAR), Boundary Layer Radar (BLR), X-band radar, radiosonde and other co-located facilities to demonstrate the relation-ship between the evolution of strong convection and its role in forcing gravity waves that penetrate from the troposphere into the lower stratosphere. In addition another
5
recent study at mid-latitudes has indicated a region of convection and examined the potential of convective mixing for exchanging air between the boundary layer and a region associated with a tropopause fold (Reid and Vaughan,2004). That study con-firms that the convection interacts with the tropopause fold and potentially produces a subsequent mixing of stratospheric and tropospheric air. Sato et al. (1995) also
dis-10
play observations of convection which display enhanced vertical velocities, in one case up to the tropopause level. However, the magnitude of their vertical velocity fluctua-tions is significantly smaller than those described in Hooper et al.(2005). The study bySato et al.(1995) also displays possible wave generation from cumulus convection and possible absorption at a critical layer at higher altitudes.
15
As indicated previously, this study describes wind profiler observations which dis-play large vertical velocity variability. These observations are suggested to be associ-ated with periods of strong convective activity which closely approach the tropopause level defined by radiosonde and radar measurements and UK Met Office mesoscale model data. It is proposed that the enhanced vertical velocity perturbations above the
20
tropopause are associated with internal gravity waves generated by the convection. The possibility that the enhanced vertical velocities are associated with convection above the tropopause level or mountain wave activity which displays a similar signa-ture (Prichard et al.,1995;Rottger, 2000) is also explored. Section 2 describes the Aberystwyth NERC MST radar and describes the processing scheme used on the raw
25
data to derive the observations of interest. The observations displayed are detailed in Sect.3and the interpretation of these observations is discussed in Sect.4.
ACPD
5, 11029–11054, 2005 Convective gravity waves at mid-latitudes Y. G. Choi et al. Title Page Abstract Introduction Conclusions References Tables Figures J I J I Back CloseFull Screen / Esc
Print Version Interactive Discussion
EGU
2. Method
The Natural Environment Research Council (NERC) MST radar at Aberystwyth (52.4◦N, 4.1◦W), described in Vaughan(2002), operates at a frequency of 46.5 MHz and has a peak transmitted power of 160 kW. The radar beam has a one-way half-power half-width of 1.5◦ and can be steered in sixteen possible directions. These
in-5
clude the vertical and at angles of 4.2, 6.0, 8.5 and 12.0◦ off-vertical in a variety of azimuths.
This radar derives parameters from Doppler spectra using a simple, single-peak spectral processing technique. The mean noise power spectral density (PSD) is first evaluated. The spectral limits of the signal are bound by those points at which the
10
PSD, to either side of the peak PSD, first drops below the mean noise PSD. For strong signals, the limits are further restricted by identifying those points at which the PSD first drops to 0.01 of the peak PSD. The principal spectral parameters of signal power, Doppler shift and spectral width are then calculated within these limits. In this study, zonal and meridional components of wind have been derived using beams at 6◦ o
ff-15
vertical in azimuths parallel to the diagonals of the array and in the zenith direction; measurements using two pairs of ±6◦ directions have also been used to derive esti-mates of the vertical flux of the horizontal momentum (Vincent and Reid,1983). In the present study for each radar cycle, observations were made twice in the vertical direc-tion and once each at 6◦in the off-vertical in the south-west, north-west, north-east and
20
south-east directions. This oversampling of the wind field allows the confidence inter-vals on the vertical velocity to be derived using the method described inAstin(1997). The confidence interval estimation uses the fact that to estimate three-dimensional wind vectors, three non-coplanar Doppler line-of-sight wind measurements are re-quired. Therefore, the use of measurements in six radar beam directions allows two
25
independent measurements of the wind vector. Alternatively, the wind field is oversam-pled and the six measurements can be combined to give confidence intervals. Briefly, this method uses a least squares approach based on the geometry of the beam
po-ACPD
5, 11029–11054, 2005 Convective gravity waves at mid-latitudes Y. G. Choi et al. Title Page Abstract Introduction Conclusions References Tables Figures J I J I Back CloseFull Screen / Esc
Print Version Interactive Discussion
EGU
sitions and a set of radial velocity measurements to determine the velocities in the cardinal directions and their confidence intervals.
3. Results
Observations of the mean vertical profiles of the zonal and meridional velocities aver-aged over 1 March 2003 are displayed in Fig.1. The spread of values at each altitude,
5
as represented by the standard deviation, is also displayed. Examination of Fig. 1a shows that the mean zonal wind remains westerly at all altitudes. The variation of the mean zonal wind is from 10 to 20 ms−1 with a maximum around 9.5 km; this maxi-mum is associated with the edge of a jet which is located approximately 200 km to the south of Aberystwyth. The mean meridional wind displayed in Fig.1b is southerly up
10
to 16 km altitude and again has a maximum close to 9.5 km. The mean tropopause altitude, identified using the radar signal power structure using a method similar to that discussed inGage and Green (1982), is located at 8.3 km. Examination of temper-ature data from UK Met Office mesoscale model temperature data is used to derive the altitude of the thermal tropopause as 8.8 km. Comparison of these values suggest
15
that there is a good correspondence between the tropopause height derived from the radar and radiosonde data (also see Fig.5). Close examination shows the zonal and meridional velocity profiles above 12 km display fluctuations with a vertical wavelength of approximately 1.2 km which are associated with an inertia gravity wave. However, it is important to note that this gravity wave is not considered to be associated with the
20
convection because the long apparent period of the wave would mean that it would not be observable at the location of the source (Alexander and Holton,2004).
Figure 2 displays time-altitude contour plots of the vertical velocity, the confidence interval on the vertical velocity and the vertical signal power for 1 March 2003. Exami-nation of Fig.2a shows a clear enhancement in the magnitude of the vertical velocities
25
observed at around 13:20 UT. These enhancements are most obvious between 2 and 9 km. A smaller enhancement in the vertical velocity field is also observed at around
ACPD
5, 11029–11054, 2005 Convective gravity waves at mid-latitudes Y. G. Choi et al. Title Page Abstract Introduction Conclusions References Tables Figures J I J I Back CloseFull Screen / Esc
Print Version Interactive Discussion
EGU
14:00 UT at altitudes between 2 and 6 km. Figure2b shows simultaneous enhance-ments in the uncertainty on the vertical velocity using the confidence interval as the measure of uncertainty. The confidence intervals are used in this study because large values can be used to indicate where the underlying assumption of local homogeneity in the Doppler Beam Swinging (DBS) technique used in the velocity estimation is no
5
longer valid (Astin, 1997). It is interesting to note thatVincent et al. (2004) indicates the absence of wind measurements during times when convection are strong. Their work suggests that these gaps may be associated with small-scale variations in the winds when convective cells pass over the radar causing spectral broadening of the echoes. Correspondingly, the correlation functions used in the spaced antenna Full
10
Correlation Analysis (FCA) are narrow, and the analysis breaks down. Work detailed in the recent study byDhaka et al.(2005) also indicates that during convection, measure-ments of horizontal winds using EAR when compared with radiosonde data showed error of about 10%. This discrepancy was thought to be due to a limitation of the DBS method during convection. Thus, this observation and previous work both suggest that
15
the uncertainties derived can be used to identify regions associated with convection.
Vincent et al. (2004) indicate that the horizontal scale necessary to produce such a heterogeneous wind field would be unlikely to be produced by gravity waves. Thus, we suggest that this method also allows the possibility of separating regions of large vertical velocities associated with convection and gravity waves.
20
The large uncertainties in the vertical velocity around 13:20 UT between 2 and 9 km are suggested to be related to a lack of local homogeneity in the wind-field which would be observed in a convective cell. Careful inspection also suggests that this inhomogeneity is not observed to such a great degree above the tropopause level. This strongly suggests that there is a fundamental difference between the vertical velocity
25
perturbations below and above the tropopause level (around 8–9 km). We believe that this suggests that the large vertical velocities in the troposphere are associated with convection and those above the tropopause are related to wave packets of short-period internal gravity waves.
ACPD
5, 11029–11054, 2005 Convective gravity waves at mid-latitudes Y. G. Choi et al. Title Page Abstract Introduction Conclusions References Tables Figures J I J I Back CloseFull Screen / Esc
Print Version Interactive Discussion
EGU
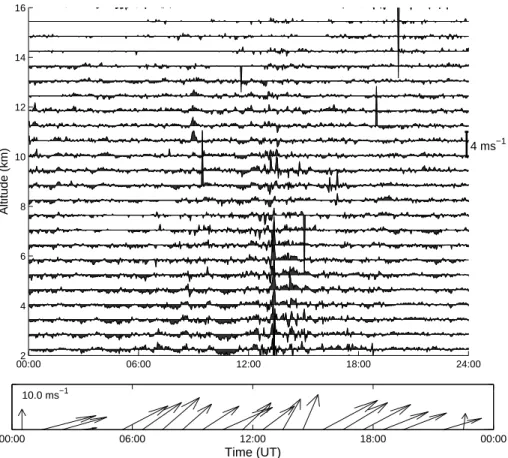
Figure3displays time series of the vertical velocity at a range of altitudes between 2 and 12 km. To ensure only good velocity estimates are utilized the velocity data related to low signal strengths are removed. Large vertical velocity fluctuations are observed throughout the period displayed in Fig.3. At lower altitudes, between 2 and 8.5 km, at around 13:30 UT a particularly large updraft with a maximum magnitude of 7.4 ms−1is
5
observed. The updraft is followed by a downdraft which is dominant up to approximately 4.5 km altitude. Above 4.5 km the updraft continues to be the dominant structure up to the tropopause level. The vertical velocities above the tropopause are also enhanced in this period. However, the average magnitude of the vertical velocities is much smaller above the tropopause level and inspection shows clear periodic wave-like structure in
10
the velocity data. In Fig.3the tropopause level is defined using the radar signal power structure (Gage and Green,1982). Examination suggests that the tropopause is poorly defined and is more variable in the region directly above the convective region. It seems likely that this poor definition is associated with the mixing of stratospheric and tropo-spheric air at the top of the convective region since large spectral widths, these being
15
related to the eddy dissipation rate, are also observed. It should be noted at these high altitudes the Doppler spectra are considered to be uncontaminated by precipita-tion echoes and can therefore be unambiguously related to turbulence. Observaprecipita-tions discussed inReid and Vaughan(2004) display similar observations which highlight the impact that convection can have on stratosphere-troposphere exchange. It is also
pos-20
sible that any gravity waves produced by the convection could produce mixing around the tropopause level (Pavelin et al.,2002).
In addition to the structure identified below the tropopause level, several wave-like fluctuations are observed in the vertical velocity field well above the tropopause altitude. These wave-like structures which are observed to have very short periods, 45 min or
25
below, seem likely to be triggered locally by the convective region. It should be noted that short period gravity waves are expected to be observed directly above convection based on theoretical considerations (Beres et al.,2002;Alexander and Holton,2004). In fact Alexander and Holton (2004) indicates that the locally observed response to
ACPD
5, 11029–11054, 2005 Convective gravity waves at mid-latitudes Y. G. Choi et al. Title Page Abstract Introduction Conclusions References Tables Figures J I J I Back CloseFull Screen / Esc
Print Version Interactive Discussion
EGU
a convective heat source depends strongly on the distance of the observer from the source. In particular, an observer (or wind profiler) close to the source will see long vertical wavelength waves with high frequencies lasting for a short time, while further from the source the dominant vertical wavelength would be smaller and the frequency lower, the waves would arrive later, and they would persist longer. This result can be
5
understood by noting that the ratio of intrinsic frequency to buoyancy frequency deter-mines the angle to the vertical at which the wave propagates. This is a general result common to all the possible sources of internal gravity waves discussed. However, the presence of vertical velocities in the lower troposphere and enhanced vertical veloci-ties both before and after the convective period is highly indicative of convection as the
10
source.
Ancillary information from satellite and radiosonde soundings (not shown) suggests that the interpretation of the large vertical velocity fluctuations in the troposphere as convective signatures is valid. In particular, the convective activity is confirmed by evi-dence of high-topped cumulus clouds in satellite imagery (not shown). These
enhance-15
ments are also related to a period of particularly heavy surface rainfall at Aberystwyth. A radiosonde launch at 05:00 UT on 1 March 2003 suggests that the atmosphere ex-amined is close to instability and could easily produce convective clouds later in the day. UK Met Office mesoscale unified model data has also been used to derive values of the Convective Available Potential Energy (CAPE). Examination suggests regions
20
with values of CAPE greater than 500 Jkg−1 are observed close to Aberystwyth previ-ous to the period of interest which confirms the expectation that the radar is observing a mildly convectively active region. However, a number of authors (Prichard et al.,
1995;Rottger,2000) have indicated that large vertical velocity perturbations are also produced by mountain waves. To examine the plausibility of the large vertical velocities
25
being associated with mountain waves, Fig.4displays the vertical velocity, along with vectors of the low-level background wind speed and direction. The low-level wind speed and direction were determined from wind-profiler data averaged over the lowest height gates of the radar (i.e. 1.7–2.7 km). The directions shown in Fig.4are those towards
ACPD
5, 11029–11054, 2005 Convective gravity waves at mid-latitudes Y. G. Choi et al. Title Page Abstract Introduction Conclusions References Tables Figures J I J I Back CloseFull Screen / Esc
Print Version Interactive Discussion
EGU
which the wind is blowing, in degrees clockwise from north. Simultaneous measure-ments of large mean vertical velocities and low-level wind directions over mountainous terrain are a good indicator of mountain wave activity. Examination of the low-level data indicates that during the period of largest vertical velocities the wind speed varies little and that the meteorological direction remains close to the southwesterly direction.
5
Prichard et al.(1995) indicates that at Aberystwyth the topography between the NNW and SW direction is less than 150 m height for several kilometers. Thus, the wind direc-tion is such that the flow will only produce significant mountain wave activity for periods of strong low-level winds.The fact that wind direction remains relatively unchanged and the low-level wind speed is small between 06:00 to 18:00 UT suggests similar amounts
10
of mountain wave activity throughout this period. Thus, the large increase observed for a brief period inside this time suggests seem to be unlikely to be related to mountain wave activity.
It is still possible that changes in the static stability of the atmosphere during this period could produce this pattern. However, mesoscale temperature structure data
15
from the UK Met Office Unified model (Cullen,1993;Lopez et al.,2003) does not sug-gest that the static stability of the atmosphere changes significantly in this period (see Fig.5). Comparison of the vertical signal power, displayed in Fig.5a, with the temper-ature structure data suggests that the tropopause level derived from the UK Met Office model data corresponds well to an enhancement in the vertical signal power observed.
20
The tropopause altitudes identified by both methods were located at heights between 7 and 9 km. The signature of the tropopause in the signal power can be attributed to the greater static stability of the stratosphere relative to the troposphere (Gage and Green,
1982). In addition the vertical signal power data displayed in Fig.5a shows a clear en-hancement around 13:20 UT between 4 and 8 km. This enen-hancement could be due to
25
a number of factors, but is one of the signatures of mid-latitude convection identified in
Hooper et al.(2005). However, it is worth indicating that enhanced radar return signal power is the least commonly observed signature of convection and thatHooper et al.
ACPD
5, 11029–11054, 2005 Convective gravity waves at mid-latitudes Y. G. Choi et al. Title Page Abstract Introduction Conclusions References Tables Figures J I J I Back CloseFull Screen / Esc
Print Version Interactive Discussion
EGU
likely to be present when a strong contrast in humidity exists between the in-cloud and surrounding air. Careful comparison of the vertical signal power data with the vertical velocity data, shown in Fig.2a, suggests that the region of vertical velocity enhance-ment displays a greater altitudinal extent than the vertical signal power enhanceenhance-ment. This fact seems to suggest that the vertical velocity enhancements above and below
5
the tropopause level may have a different character. This leads to the interpretation of large vertical velocities relating to a convective region up to the tropopause level over-laid by a region of enhanced vertical velocities which are more periodic in nature which are considered to be associated with high frequency internal gravity waves.
A time-altitude contour plot of the beam-broadening corrected spectral width is
dis-10
played in Fig.5b. The clearest feature in this contour plot is a region of large corrected spectral widths which are coincident with the enhancement in the vertical signal power previously discussed. Under normal conditions the value of the corrected spectral width can be used as a measure of turbulent intensity. However, it should be noted that the interpretation of large spectral widths as regions of turbulence is not valid in areas
15
associated with significant precipitation (Chu and Lin,1994). Surface rainfall data mea-sured by an ARG tipping bucket rain gauge suggests particularly heavy precipitation at approximately 13:20 UT (not shown). Thus, it is not possible to unambiguously identify this region as strong turbulence.
Based on the interpretation indicated above we have applied a spectral approach to
20
examine whether the periodic fluctuations in the vertical velocity field are more abun-dant above the convective region and to determine their dominant periodicity. The method utilized applies a Fast Fourier Transform algorithm to the vertical velocities in a 90 min segment and shifts the central time of the segment from the start to the end of the time series available. This method is repeated at altitudes between 12 and 16 km,
25
the individual frequency spectra from the 90 min segments are then averaged to form a set of representative frequency spectra. The upper altitude of the height range used (16 km) was chosen because this is the highest altitude which contains reliable vertical velocities without the need to interpolate the data. The lower altitude used (12 km) was
ACPD
5, 11029–11054, 2005 Convective gravity waves at mid-latitudes Y. G. Choi et al. Title Page Abstract Introduction Conclusions References Tables Figures J I J I Back CloseFull Screen / Esc
Print Version Interactive Discussion
EGU
selected in order to exclude the effect of the convective region itself by staying consid-erably above the local tropopause level. Figure6displays the power spectral density as a function of time for apparent periods ranging between 90 and 5 min. Examination of Fig.6suggests a number of regions where peaks in the power spectral density are observed. The increase of the spectral power around the convective region indicates
5
there are periodic fluctuations present, which coincide with the above hypothesis. In-spection suggests periods between 5 and 45 min are enhanced during the convective period. An enhancement in the power spectral density with an apparent period be-tween 90 and 45 min is also observed around 09:00 UT, but is not considered to be associated with convective generation.
10
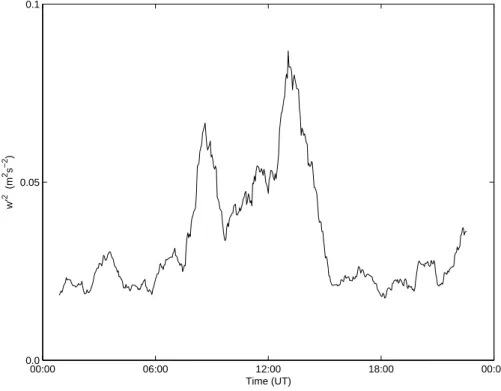
Both enhancements in the power spectral density observed in Fig. 6 can also be observed in an alternative form by calculating the mean vertical velocity variance as a function of time. The mean vertical velocity variance calculated over the altitude range 12 to 16 km is displayed in Fig.7. Figure7displays bandpass filtered vertical velocity variance data. The bandpass filters used have lower and upper limits of 6 and 60 min,
15
respectively. Examination of the bandpass filtered data shows a distinct enhancement in activity at around 13:30 UT, corresponding exactly to the convective period observed below the tropopause level. This means the waves at around 13:30 UT have only short periods below 1 h. This result is expected given that similar enhancements at short periods at around 13:30 UT were observed in Fig.6. A secondary maximum at around
20
09:00 UT is also observed.
The time variation of the vertical fluxes of horizontal momentum above the tropopause level has been calculated using data from two pairs of oppositely directed radar beams which are directed 6◦ off the vertical (Vincent and Reid,1983). The mo-mentum flux has been calculated for 90 min periods of data and averaged across
25
1.5 km. It should be noted that because the method is based on a statistical method, many data points are needed to minimize the statistical fluctuations. In an attempt to remove the effect of the inertia gravity wave previously discussed and displayed in Fig.1we have again applied a band-pass filter to the velocities when using theVincent
ACPD
5, 11029–11054, 2005 Convective gravity waves at mid-latitudes Y. G. Choi et al. Title Page Abstract Introduction Conclusions References Tables Figures J I J I Back CloseFull Screen / Esc
Print Version Interactive Discussion
EGU
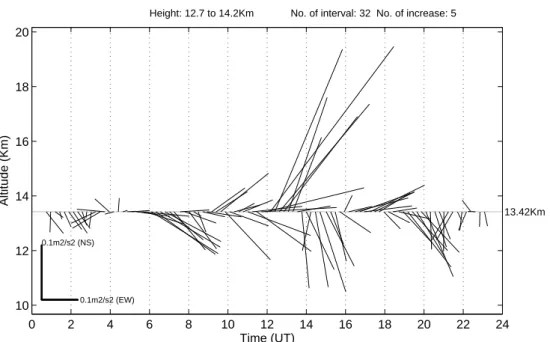
and Reid (1983) method. The results are shown in Fig.8. The calculation of the vertical flux of the horizontal momentum is made between 12.7 and 14.2 km above the local tropopause level. A more limited altitude range than that used in the previous analysis has been used because the momentum flux was observed to be highly impacted by outliers in the data. Below the tropopause level, very large momentum fluxes around
5
the convection region are observed. However, it should be noted that these momen-tum fluxes will have very large uncertainties because of the large uncertainties in the component velocities (see Fig.2b). In addition, it should be noted that this analysis is not discussed for observations below the tropopause level because of the difficulty of separating any gravity wave perturbations from the convective activity. Vincent et al.
10
(2004) notes this problem with this type of study.
Examination of the horizontal momentum data above the tropopause level, displayed in Fig.8, suggests that an enhanced region is observed during the convective period. Close inspection also indicates that the horizontal momentum vector changes direction from northward to southward between 13:00 and 14:00 UT. A similar sign change in
15
horizontal momentum has previously been observed using ER2 aircraft observations by Alexander et al. (2000) during periods associated with convective gravity waves. The vertical flux of horizontal momentum thus also shows evidence of the existence of gravity waves related to convection. The increase of the magnitude of the momentum flux and its change of sign also suggest that there should be waves propagating around
20
this region.
4. Discussion
Vertically propagating gravity waves generated by convection are known to provide an important contribution to the momentum budget of the middle atmosphere (Song
et al.,2003). Thus, understanding the wave field observed at higher altitudes relative
25
to particular convective sources is an important area of study. Theory predicts that isolated, sufficiently convective thunderstorms can launch waves and create a unique
ACPD
5, 11029–11054, 2005 Convective gravity waves at mid-latitudes Y. G. Choi et al. Title Page Abstract Introduction Conclusions References Tables Figures J I J I Back CloseFull Screen / Esc
Print Version Interactive Discussion
EGU
intensity pattern of concentric circles on a radiating surface of constant altitude above such a storm. This was confirmed byDewan et al.(1998) which presents observations from the MSX satellite which show structures that are due to gravity waves originating from isolated thunderstorms. Meteorological satellite images were also used inDewan
et al. (1998) to show that highly convective isolated thunderstorms occurred at the
5
locations and times of the expected generation zones. Close examination of Fig. 7
shows that the vertical velocity variance before and after the convective event is very similar with perhaps slightly more activity before 13:20 UT. This slight asymmetry is also observed in the magnitude of the horizontal momentum flux vector, which should be noted reverses between 13:00 and 14:00 UT, in Fig. 8. It should be noted that
10
recent work bySong et al.(2003) suggests that the equal propagation of internal gravity waves as a function of direction may only be relevant to the early stages of the lifecycle of convective structures and thus the slight asymmetry observed is not unexpected.
Alexander et al.(2004) also suggest that asymmetry in the wave field can be caused by upper tropospheric wind shear. However, the fact that the observations display a
15
momentum flux field that changes direction during the period of enhanced gravity wave activity and relatively little asymmetry seems to prohibit the topographic effect as the mechanism for wave generation since this mechanism is suggested to produce waves that propagate preferentially opposite to the background wind direction (Beres et al.,
2002).
20
Examination of the vertical velocity perturbations suggests these waves have a ver-tical wavelength of approximately 3–4 km. This is significantly shorter than that ex-pected by theory if thermal forcing by latent heating is the mechanism that produces these waves. For example,Holton et al.(2002) show that for fixed frequency and fixed vertical depth of thermal forcing, the vertical wavelength of maximum gravity wave
re-25
sponse to specified heating depends strongly on the horizontal scale of the forcing and a significant response occurs at wavelengths that greatly exceed twice the depth of the heating. In addition, work byAlexander and Holton(2004) indicates that a diabatic heating source preferentially produces waves with long vertical wavelengths. Thus, the
ACPD
5, 11029–11054, 2005 Convective gravity waves at mid-latitudes Y. G. Choi et al. Title Page Abstract Introduction Conclusions References Tables Figures J I J I Back CloseFull Screen / Esc
Print Version Interactive Discussion
EGU
relatively short vertical wavelengths observed are perhaps surprising. However, recent observations detailed inDhaka et al.(2005) have seen similar patterns. It is suggested that the characteristics of the wind profiler observations also play some role in this dis-parity, the importance of observational technique limitation being discussed previously inAlexander et al.(2004). While the frequencies and vertical wavelengths observed
5
in this study are similar to those indicated inDhaka et al. (2005) the magnitude of the momentum flux values are quite different. The significantly smaller values observed in this study may in part be explained by the filtering applied to our data which was necessary to remove the impact of the long period inertia gravity wave observed in the stratosphere (see Fig.1).
10
Examination of Fig. 5 suggests that the tropopause is poorly defined and is more variable in the region directly above the convective region. It was indicated that this is likely to be associated with the mixing of stratospheric and tropospheric air at the top of the convective region. This concurs with observations discussed inDhaka et al.
(2002) which indicates that there is a significant weakening of the tropopause above
15
convection, possibly due to mixing induced by penetrating convection. Work byReid
and Vaughan (2004) show observations which highlight the impact that convection can have on stratosphere-troposphere exchange. Sato et al.(1995) also display observa-tions of convectively generated gravity waves and possible absorption at a critical layer at higher altitudes. Thus, the impact of convective activity and gravity waves generated
20
by convective activity on mixing around the tropopause level seems to be worthy of continued study.
5. Conclusions and further work
It has been suggested that by examining the uncertainties on velocity data, derived using the method indicated in Astin (1997), it is possible to identify periods of active
25
convection. This interpretation of this data leads to the analysis of the large vertical velocity perturbations observed in the case study as a period of convection overlaid by
ACPD
5, 11029–11054, 2005 Convective gravity waves at mid-latitudes Y. G. Choi et al. Title Page Abstract Introduction Conclusions References Tables Figures J I J I Back CloseFull Screen / Esc
Print Version Interactive Discussion
EGU
short-period gravity waves. Enhanced vertical velocity variance and momentum flux, associated with short periods, at altitudes significantly above the local tropopause level are also observed. This suggests that the large vertical velocity perturbations observed above the tropopause are short-period gravity waves. Simulations byAlexander and
Holton (2004) indicate that the locally observed response to a convective heat source
5
depends strongly on the distance of the observer from the source. In particular their suggestion that an observer close to the source will see long vertical wavelength waves with high frequencies lasting for a short time seems to be partially validated by this study, though the vertical wavelengths observed are shorter than expected.
It is interesting to note that a number of other convective events have been observed
10
in the radar data and that none of the other events have shown similar patterns perhaps suggesting that this event is unusual in the magnitude of the waves observed. Further work will focus on identifying whether this is true by identifying more convective periods using regions associated with large uncertainties.
Acknowledgements. The MST Radar Facility at Aberystwyth is funded by the UK Natural
En-15
vironment Research Council and the data presented in this paper has been kindly provided through the British Atmospheric Data Centre. We would also like to thank the (UK) Met Office who kindly provided the UM mesoscale model data to the British Atmospheric Data Centre. A. J. McDonald would like to acknowledge grant U6518 from University of Canterbury. S. C. Lee has been supported by the research foundation of Kangnung National University.
20
References
Alexander, M. J. and Holton, J. R.: On the spectrum of vertically propagating gravity waves generated by a transient heat source, Atmos. Chem. Phys., 4, 923–932, 2004,
SRef-ID: 1680-7324/acp/2004-4-923. 11031,11034,11036,11042,11044
Alexander, M. J., Beres, J. H., and Pfister, L.: Tropical stratospheric gravity wave activity and
25
relationships to clouds, J. Geophys. Res., 105, 22 299–22 309, 2000. 11031,11041
Alexander, M. J., Tsuda, T., and Vincent, R. A.: Latitudinal variations observed in gravity waves with short vertical wavelengths, J. Atmos. Sci., 59, 1394–1404, 2002. 11031
ACPD
5, 11029–11054, 2005 Convective gravity waves at mid-latitudes Y. G. Choi et al. Title Page Abstract Introduction Conclusions References Tables Figures J I J I Back CloseFull Screen / Esc
Print Version Interactive Discussion
EGU
Alexander, M. J., May, P. T., and Beres, J. H.: Gravity waves generated by convection in the Darwin area during the Darwin Area Wave Experiment, J. Geophys. Res., 109, doi:10.1029/2004JD004729, 2004. 11042,11043
Astin, I.: Confidence interval estimation for VHF Doppler radar measurements of wind veloci-ties, Radio Sci., 32, 2221–2231, 1997. 11033,11035,11043
5
Beres, J. H., Alexander, M. J., and Holton, J. R.: Effects of Tropospheric wind shear on the spectrum of convectively generated gravity waves, J. Atmos. Sci., 59, 1805–1824, 2002.
11031,11036,11042
Chu, Y.-H. and Lin, C.-H.: The severe depletion of turbulent echo power in precipitation ob-served using the Chung-Li VHF Doppler radar, Radio Sci., 29, 1311–1320, 1994. 11039
10
Cullen, M. J. P.: The Unified Forecast Climate Model, Meteorol. Mag., 122, 81–94, 1993. 11038
Dewan, E. M., Picard, R. H., O’Neil, R. R., Gardiner, H. A., Gibson, J., Mill, J. D., Richards, E., Kendra, M., and Gallery W. O.: MSX satellite observations of thunderstorms-generated gravity waves in mid-wave infrared images of the upper stratosphere, Geophys. Res. Lett., 25, 939–942, 1998. 11031,11042
15
Dhaka, S. K., Choudhary, R. K., Malik, S., Shigabaki, Y., Yamanaka, M. D., and Fukao, S.: Ob-servable signatures of a convectively generated wave field over the tropics using Indian MST radar at Gadanki (13.5◦N, 79.2◦E), Geophys. Res. Lett., 29, doi:10.1029/2002GL014745, 2002. 11031,11043
Dhaka, S. K., Yamamoto, M. K., Shibagaki, Y., Hashiguchi, H., Yamamoto, M., and Fukao, S.:
20
Convection-induced gravity waves observed by the Equatorial Atmosphere Radar (0.20◦S, 100.32◦E) in Indonesia, Geophys. Res. Lett., 32, doi:10.1029/2005GL022907, 2005. 11032,
11035,11043
Gage, K. S. and Green, J. L.: An objective method for the determination of tropopause height from VHF radar observations, J. Appl. Meteorol., 21, 1150–1154, 1982. 11034, 11036,
25
11038
Holton, J., Beres, J., and Zhou, X.: On the vertical scale of gravity waves excited by localized thermal forcing, J. Atmos. Sci., 59, 2019–2023, 2002. 11042
Hooper, D. A., McDonald, A. J., Pavelin, E., Carey-Smith, T. K., and Pascoe, C. L.: The signa-ture of mid-latitude convection observed by VHF wind-profiling radar, Geophys. Res. Lett.,
30
32, doi:10.1029/2004GL020401, 2005. 11030,11032,11038
Karoly, D. J., Roff, G. L., and Reeder, M. J.: Gravity wave activity associated with tropical convection detected in TOGA COARE sounding data, Geophys. Res. Lett., 23, 261–264,
ACPD
5, 11029–11054, 2005 Convective gravity waves at mid-latitudes Y. G. Choi et al. Title Page Abstract Introduction Conclusions References Tables Figures J I J I Back CloseFull Screen / Esc
Print Version Interactive Discussion
EGU
1996. 11031
Kawatani, Y., Dhaka, S. K., Takahashi, M., and Tsuda, T.: Large potential energy of gravity waves over a smooth surface with little convection: Simulation and observation, Geophys. Res. Lett., 30, doi:10.1029/2003GL016960, 2003. 11031
Lopez, P., Finkele, K., Clark, P., and Mascart, P.: Validation and intercomparison of three
5
mesoscale models on three FASTEX cloud systems: Comparison with coarse-resolution simulations, Q. J. Royal Met. Soc., 129, 1841–1871, 2003. 11038
Pavelin, E., Whiteway, J. A., Busen, R., and Hacker, J.: Airborne observations of tur-bulence, mixing and gravity waves in the tropopause region, J. Geophys. Res., 107, doi:10.1029/2001JD000775, 2002. 11036
10
Prichard, I., Thomas, L., and Worthington, R. M.: The characteristics of mountain waves ob-served by radar near the west coast of Wales, Ann. Geophys., 13, 757–767, 1995,
SRef-ID: 1432-0576/ag/1995-13-757. 11032,11037,11038
Reid, H. J. and Vaughan, G.: Convective mixing in a tropopause fold, Q. J. Royal Met. Soc., 130, 1195–1212, 2004. 11032,11036,11043
15
Rottger, J.: ST radar observations of atmospheric waves over mountainous areas: a review, Ann. Geophys., 18, 750–765, 2000,
SRef-ID: 1432-0576/ag/2000-18-750. 11032,11037
Sato, K., Hashiguchi, H., and Fukao, S.: Gravity-Waves and Turbulence Associated with Cu-mulus Convection Observed with the UHF/VHF Clear-Air Doppler Radars, J. Geophys. Res.,
20
100, 7111–7119, 1995. 11032,11043
Song, I. S., Chun, H. Y., and Lane, T. P.: Generation mechanisms of convectively forced internal gravity waves and their propagation to the stratosphere, J. Atmos. Sci., 60, 1960–1980, 2003.
11031,11041,11042
Tsuda, T. and Hocke, K.: Application of GPS radio occultation data for studies of atmospheric
25
waves in the middle atmosphere and ionosphere, J. Met. Soc. Japan, 82, 419–426, 2004.
11031
Vaughan, G.: The UK MST radar, Weather, 57, 69–73, 2002. 11033
Vincent, R. A. and Reid, I. M.: HF Doppler Measurements of Mesospheric Gravity-Wave Mo-mentum Fluxes, J. Atmos. Sci., 40, 1321–1333, 1983. 11033,11040,11054
30
Vincent, R. A., MacKinnon, A., Reid, I. M., and Alexander, M. J.: VHF profiler observations of winds and waves in the troposphere during the Darwin Area Wave Experiment (DAWEX), J. Geophys. Res., 109, doi:10.1029/2004JD004714, 2004. 11031,11035,11041
ACPD
5, 11029–11054, 2005 Convective gravity waves at mid-latitudes Y. G. Choi et al. Title Page Abstract Introduction Conclusions References Tables Figures J I J I Back CloseFull Screen / Esc
Print Version Interactive Discussion EGU 0 10 20 30 2 4 6 8 10 12 14 16 zonal velocity (ms−1) Altitude (km) (a) −102 0 10 20 30 4 6 8 10 12 14 16 meridional velocity (ms−1) Altitude (km) (b)
Fig. 1. Altitude profiles of mean zonal (a) and meridional (b) wind velocity observed on 1 March
2003. The spread of values at each height, as represented by the standard deviation, is shown by dotted lines. Also shown are the mean tropopause altitude as derived from MST radar data (dash-dotted line) and UK Met Office mesoscale model temperature profiles (dashed line).
ACPD
5, 11029–11054, 2005 Convective gravity waves at mid-latitudes Y. G. Choi et al. Title Page Abstract Introduction Conclusions References Tables Figures J I J I Back CloseFull Screen / Esc
Print Version Interactive Discussion EGU 0:00 6:00 12:00 18:00 00:00 5 10 15 Altitude (km) (a) −1 −0.5 0 0.5 1 0:00 6:00 12:00 18:00 00:00 5 10 15 Altitude (km) (b) 0.5 1 1.5 0:00 6:00 12:00 18:00 00:00 5 10 15 Altitude (km) (c) 40 50 60
Fig. 2. Time-altitude contour plots of (a) vertical velocity (ms−1),(b) the confidence interval on
ACPD
5, 11029–11054, 2005 Convective gravity waves at mid-latitudes Y. G. Choi et al. Title Page Abstract Introduction Conclusions References Tables Figures J I J I Back CloseFull Screen / Esc
Print Version Interactive Discussion EGU 10:002 11:00 12:00 13:00 14:00 15:00 4 6 8 10 12 Time (UT) Altitude (km) 5 ms−1
Fig. 3. Time series of the vertical wind velocity on 1 March 2003 from 2 to 12 km. A bar which
displays the scale for the vertical velocity is shown along the right hand side in ms−1. The grey line on the figure indicates the level of the tropopause derived from radar data.
ACPD
5, 11029–11054, 2005 Convective gravity waves at mid-latitudes Y. G. Choi et al. Title Page Abstract Introduction Conclusions References Tables Figures J I J I Back CloseFull Screen / Esc
Print Version Interactive Discussion EGU 00:002 06:00 12:00 18:00 24:00 4 6 8 10 12 14 16 Altitude (km) 4 ms−1 00:00 06:00 12:00 18:00 00:00 Time (UT) 10.0 ms−1
Fig. 4. The vertical velocity and low-level wind speed and direction for 1 March 2003. The
upper panel depicts the variations of vertical velocity at approximately 1km intervals from 2 to 16 km. The lower panel indicates the mean horizontal wind vectors averaged over the height range 1.7–2.7 km, directions being those toward which the wind blowing degrees clockwise from north. The first arrow indicates a meridional wind of 10 ms−1as a scale.
ACPD
5, 11029–11054, 2005 Convective gravity waves at mid-latitudes Y. G. Choi et al. Title Page Abstract Introduction Conclusions References Tables Figures J I J I Back CloseFull Screen / Esc
Print Version Interactive Discussion EGU 06:002 09:00 12:00 15:00 18:00 6 10 14 Altitude (km) −50 −50 −50 −50 −50 −50 −50 −50 −40 −40 −40 −30 −30 −30 −20 −20 −20 −20 35 40 45 50 55 06:002 09:00 12:00 15:00 18:00 6 10 14 Time (UT) Altitude (km) −50 −50 −50 −50 −50 −50 −50−50 −40 −40 −40 −30 −30 −30 −20 −20 −20 0.2 0.4 0.6 0.8 (a) 06:002 09:00 12:00 15:00 18:00 6 10 14 Altitude (km) −50 −50 −50 −50 −50 −50 −50 −50 −40 −40 −40 −30 −30 −30 −20 −20 −20 −20 35 40 45 50 55 06:002 09:00 12:00 15:00 18:00 6 10 14 Time (UT) Altitude (km) −50 −50 −50 −50 −50 −50 −50−50 −40 −40 −40 −30 −30 −30 −20 −20 −20 0.2 0.4 0.6 0.8 (b) Fig. 5. Time-height contour plots of (a) vertical signal power (dB) and (b) corrected spectral
width (ms−1) measured by a VHF radar for 09:00 to 15:00 UT on 1 March 2003. Overplotted on each time-height plot are temperature contours (black lines) obtained from UK Met Office mesoscale Unified Model output over Aberystwyth. The values of tropopause altitude for each hour derived from UK Met Office data are also displayed as black squares. The tropopause altitude derived using radar data are displayed using a red line.
ACPD
5, 11029–11054, 2005 Convective gravity waves at mid-latitudes Y. G. Choi et al. Title Page Abstract Introduction Conclusions References Tables Figures J I J I Back CloseFull Screen / Esc
Print Version Interactive Discussion EGU 0 2 4 6 8 10 12 14 16 18 20 22 24 0.092 0.098 0.105 0.114 0.123 0.134 0.148 0.164 0.184 0.211 0.246 0.295 0.369 0.492 0.738 1.476 Power spectra Time (UT)
Height: 12.0−16.0Km No. of cycles for average: 32
Fig. 6. Time-period plots of spectral power of vertical velocities from 12–16 km using a Fast
Fourier Transform. The highest curve represents low frequency (1.5 h, long period) and the lowest curve indicates high frequency (5 min, short period).
ACPD
5, 11029–11054, 2005 Convective gravity waves at mid-latitudes Y. G. Choi et al. Title Page Abstract Introduction Conclusions References Tables Figures J I J I Back CloseFull Screen / Esc
Print Version Interactive Discussion EGU 00:00 06:00 12:00 18:00 00:00 0.0 0.05 0.1 Time (UT) w ′ 2 (m 2s − 2)
Fig. 7. Averaged vertical velocity squared plots averaged over the altitude range 12–16 km.
The vertical velocity used in this figure has been passed through a bandpass filter which has lower and upper boundaries of 1 h and 6 min, respectively.
ACPD
5, 11029–11054, 2005 Convective gravity waves at mid-latitudes Y. G. Choi et al. Title Page Abstract Introduction Conclusions References Tables Figures J I J I Back CloseFull Screen / Esc
Print Version Interactive Discussion EGU 0 2 4 6 8 10 12 14 16 18 20 22 24 10 12 14 16 18 20 13.42Km 0.1m2/s2 (EW) 0.1m2/s2 (NS)
No. of interval: 32 No. of increase: 5 Height: 12.7 to 14.2Km
Selected period for summation: 6.0 − 45.0 min
Time (UT)
Altitude (Km)
Fig. 8. Vector plots of the time variation of the horizontal momentum using the method
dis-cussed inVincent and Reid(1983) on 1 March 2003. The momentum fluxes are averaged over altitudes from 12.7 to 14.2 km.