HAL Id: hal-00351488
https://hal.archives-ouvertes.fr/hal-00351488
Submitted on 3 Mar 2015
HAL is a multi-disciplinary open access
archive for the deposit and dissemination of
sci-entific research documents, whether they are
pub-lished or not. The documents may come from
teaching and research institutions in France or
abroad, or from public or private research centers.
L’archive ouverte pluridisciplinaire HAL, est
destinée au dépôt et à la diffusion de documents
scientifiques de niveau recherche, publiés ou non,
émanant des établissements d’enseignement et de
recherche français ou étrangers, des laboratoires
publics ou privés.
Statistical correlation of spectral broadening in VLF
transmitter signal and low-frequency ionospheric
turbulence from observation on DEMETER satellite
A. Rozhnoi, M. Solovieva, O. Molchanov, O. Akentieva, Jean-Jacques
Berthelier, Michel Parrot, P.F. Biagi, M. Hayakawa
To cite this version:
A. Rozhnoi, M. Solovieva, O. Molchanov, O. Akentieva, Jean-Jacques Berthelier, et al.. Statistical
correlation of spectral broadening in VLF transmitter signal and low-frequency ionospheric turbulence
from observation on DEMETER satellite. Natural Hazards and Earth System Sciences, European
Geosciences Union, 2008, 8 (5), pp.1105-1111. �hal-00351488�
Nat. Hazards Earth Syst. Sci., 8, 1105–1111, 2008 www.nat-hazards-earth-syst-sci.net/8/1105/2008/ © Author(s) 2008. This work is distributed under the Creative Commons Attribution 3.0 License.
Natural Hazards
and Earth
System Sciences
Statistical correlation of spectral broadening in VLF transmitter
signal and low-frequency ionospheric turbulence from observation
on DEMETER satellite
A. Rozhnoi1, M. Solovieva1, O. Molchanov1, O. Akentieva2, J. J. Berthelier3, M. Parrot4, P. F. Biagi5, and
M. Hayakawa6
1Institute of the Earth Physics, RAS, Moscow, Russia 2Institute of Space Research, RAS, Moscow, Russia 3Institute CETP, Paris, France
4LPCE/CNRS, Orleans, France
5Department of Physics, University of Bari, Bari, Italy 6University of Electro-Communications, Chofu, Tokyo, Japan
Received: 24 June 2008 – Revised: 1 September 2008 – Accepted: 1 September 2008 – Published: 16 October 2008
Abstract. In our earlier papers we have found the effect
of VLF transmitter signal depression over epicenters of the large earthquakes from observation on the French DEME-TER satellite that can be considered as new method of global diagnostics of seismic influence on the ionosphere. At present paper we investigate a possibility VLF signal-ionospheric turbulence interaction using additional charac-teristic of VLF signal-spectrum broadening. This character-istic is important for estimation of the interaction type: linear or nonlinear scattering. Our main results are the following:
– There are two zones of increased spectrum broadening,
which are centered near magnetic latitudes 8=±10◦and
8=±40◦. Basing on the previous case study research and ground ionosonde registrations, probably it is evi-dence of nonlinear (active) scattering of VLF signal on the ionospheric turbulence. However occurrence rate of spectrum broadening in the middle-latitude area is higher than in the near-equatorial zone (∼15–20% in comparison with ∼100% in former area) that is proba-bly coincides with the rate of ionospheric turbulence.
– From two years statistics of observation in the selected
3 low-latitude regions and 1 middle-latitude region in-side reception area of VLF signal from NWC transmit-ter we find a correlation of spectrum broadening nei-ther with ion-cyclotron noise (f =150–500 Hz), which
Correspondence to: A. Rozhnoi
(rozhnoi@ifz.ru)
possibly means poor representation of the turbulence by the noise due to its mixture with natural ELF emis-sion (which correlates with whistler), nor with magnetic storm activity.
– We find rather evident correlation of ion-cyclotron
fre-quency noise, VLF signal depression and weak cor-relation of spectrum broadening with seismicity in the middle-latitude region over Japan. But in the low-latitude regions we do not find such a correla-tion. Statistical decrease of VLF signal supports our previous case study results. However rather weak spectrum broadening-seismicity statistical correlation means probably that passive scattering prevails upon nonlinear (active) one.
1 Introduction
In our earlier papers we have found the effect of VLF trans-mitter signal depression over epicenters of the large earth-quakes from observation on the French DEMETER satellite that can be considered as new method of global diagnos-tics of seismic influence on the ionosphere (Molchanov et al., 2006; Rozhnoi et al., 2007). In particular it was shown rather reliable decrease of Australian NWC transmitter sig-nal amplitude several days before and after three large earth-quakes (magnitude M>6) in Japan region both from satel-lite and simultaneously on the ground observation (Rozh-noi et al., 2007). We explained the effect by scattering
1106 A. Rozhnoi et al.: Correlation of signal broadening with ionospheric turbulence
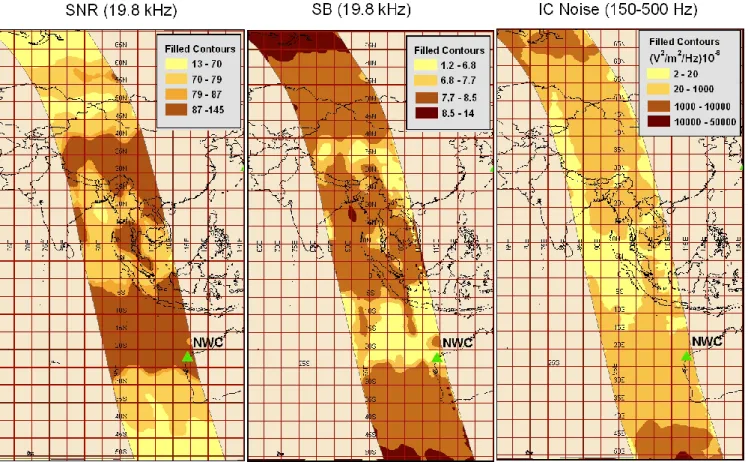
Fig. 1. Distribution of SNR and spectrum broadening for NWC transmitter (19.8 kHz) and ion-cyclotron noise (150–500 Hz) in the selected
longitude segment for the period November 2004–December 2006. The position of NWS transmitter is indicated by green triangle.
of VLF signal on ionospheric turbulence which in its turn was modified by seismicity. Such a modification was re-ported from statistical analysis of plasma density registra-tion on the Russian satellites Cosmos-900, Intercosmos-24 (Molchanov et al., 2002, 2004) and from plasma-wave ob-servation on the French-Russian satellite Aureol-3 (Hobara et al., 2005). Evidence of seismic ionospheric turbulence stimulation in the ELF frequency range (100–1000 Hz) near hydrogen ion-cyclotron frequency was discussed in the latter paper. It was found that aside of high-latitude regions (mag-netic latitudes |8|>60◦) the regular ionospheric turbulence intensification existed near Equatorial Anomaly of plasma density (magnetic latitudes 8=±10–15◦) and in the middle-latitude areas (8=±30–40◦), and it was supposed that just these areas were vulnerable for seismic influence and gave input in statistical estimation. Existence of these two areas of ionospheric turbulence corresponds to well-known areas of small-scale ionospheric irregularities revealed from the ground ionosonde recordings: equatorial and middle-latitude F-spread phenomena (e.g. Kelley, 1989).
At present paper we investigate a possibility VLF signal – ionospheric turbulence interaction using additional charac-teristic of VLF signal – spectrum broadening (SB). This char-acteristic is important for estimation of the interaction type:
linear or nonlinear scattering. In the first case SB cannot ex-ceed twice of maximal Doppler shift 21F <2FV0µ/c∼6–
60 Hz. Here F is a frequency of the VLF transmitter (F ∼2×10⁴Hz for NWC transmitter), V0is satellite velocity
(∼7×10³m/s), µ is refraction index (∼5–50) and c is light velocity (3×10⁸m/s). Whereas in a case of non-linear inter-action SB can reach the values of hundreds Hz. Indeed this anomalous SB phenomenon was observed in many satellite observations both in high-latitude areas (Bell et al., 1983; Titova et al., 1984) and the middle latitudes (Tanaka et al., 1987) and it was interpreted by mechanism of three-wave in-teraction of VLF waves and ionospheric turbulence.
2 Data processing and latitude dependence of spectrum broadening
We use the night time data of electric field receiver ICE on board of DEMETER satellite in the frequency range 100 Hz– 20 kHz and analyze signal from powerful Australian NWC transmitter (F =19.8 kHz, 21.82◦S, 114.16◦E). ICE data al-low finding power spectrum density with frequency dis-cretization 19.53 Hz in the selected frequency range and time discretization is 2 s that corresponds to 15 km in space along
A. Rozhnoi et al.: Correlation of signal broadening with ionospheric turbulence 1107 each orbit (Berthelier et al., 2006). As for signal we examine
the following characteristics: VLF signal amplitude A0,
nal to noise ratio (SNR), and spectrum broadening of the sig-nal (SB). Sigsig-nal to noise ratio is calculated as ratio of an av-erage signal spectrum density near the transmitter frequency
F0to the minimum value just outside of the signal
broaden-ing band: SNR=<A0>/Amin. This technique was discussed
in our previous paper, where it was found that behavior of SNR is the same as A0but allows reducing the sudden spikes
(Molchanov et al., 2006). Spectrum broadening of the signal is calculated as follows: SB=Asum/<A0>, where Asumis the
sum of the spectrum densities in the frequency band F0±δF.
For our signal (F0=19.8 kHz) we selected δF =200 Hz due to
upper limit of the frequency range of 20 kHz. Real spectrum broadening (in Hz) can be easily found: R=SB×19.53 Hz, where 19.53 Hz is frequency resolution in selected frequency range.
As concerned of natural ELF/VLF emission we analyze its intensity in the several bands paying special attention to noise-like emission near hydrogen ion-cyclotron in the range of 150–500 Hz and width of ion-cyclotron frequency band. Noise intensity is computed as the sum of the spectrum den-sity in the selected frequency band and the width of ion-cyclotron band is calculated similar to the spectrum broaden-ing of the VLF signal but in its own frequency range. Unlike the VLF signal where the maximum of the spectrum density is determined by the transmitter frequency, the maximum of the ion-cyclotron noise spectrum density A0i depends on the
latitude. As result we produce a computation of A0i for each
point of an orbit and then estimate the width of ion-cyclotron band.
First of all we investigate latitude dependence of VLF sig-nal spectrum broadening with aim to check its connection with zones of ionospheric turbulence. We select for analysis the space segment which limited by longitudes 100◦–125◦E at the initial points of night orbits and magnetic latitudes
8=±60◦. A slope of the area coincides with the inclina-tion angle of the orbits (Fig. 1). Since the NWC transmitter is situated in the west coast of Australia the selected area is the zone of stable and strong signal and the width of the area provides one complete orbit every day. Figure 1 shows behavior of SNR, SB and ion-cyclotron noise intensity in se-lected area for the period November 2004–December 2006. Models were calculated for 120 orbits, which were selected proceeding from the following consideration. Analysis of the spectrum broadening have shown the increase of SB in the region of the middle latitude ionospheric turbulence in the Northern Hemisphere for all the orbits and for nearly the all orbits in the Southern Hemisphere. But in the region of the equatorial ionospheric turbulence the increase of the signal was observed only for about 15–20% of the orbits. So we se-lected 120 orbits in the segment (among 650 available orbits during more than 2 years) with increased spectrum broaden-ing in both regions and demonstrate averaged latitude distri-bution of SNR, SB and ion-cyclotron noise intensity for these
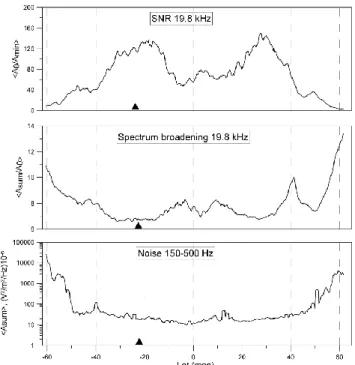
Fig. 2. SNR, SB and ion-cyclotron noise intensity in the same
lon-gitude segment averaged over selected 120 orbits. The position of NWS transmitter is indicated by black triangle.
orbits in Fig. 2. It is clear that SNR behavior along an orbit is basically determined by the transmitter position. The signal has maxima above the location of transmitter and in mag-netic conjugate region. At the same time the signal doesn’t disappear in equator region due to the power of NWS trans-mitter and the signal slightly decreases in regions of iono-spheric turbulence. In regard to SB of the signal it has clear maxima coincided with the supposed regions of ionospheric turbulence. So we conclude that spectrum broadening is con-nected with ionoshperic turbulence but not with distribution of the VLF signal.
Surprisingly we have no (or weak) indication on connec-tion between ion-cyclotron noise intensity and SB distribu-tion. A possible reason is that the noise behavior is not deter-mined by ionospheric turbulence. Indeed ion-cyclotron noise consists of two parts: natural ELF emission, which is trig-gered by whistlers or generated by different plasma insta-bilities and induced electric field oscillations due to satellite movement through quasi-steady density irregularities (iono-spheric turbulence). In the latter case a frequency of in-duced electric field oscillations as follows: F ∼V0/L, where
L is a scale of density irregularity and V0 is satellite
ve-locity (see discussion in Molchanov et al., 2002; Hobara et al., 2005). We show the distribution of ion-cyclotron noise in July and December 2006 in Fig. 3 which can be inter-preted as evidence of ion-cyclotron electrostatic wave trig-gering by whistlers in the magnetically-conjugated areas. In winter whistlers are usually observed at high latitudes of the
1108 A. Rozhnoi et al.: Correlation of signal broadening with ionospheric turbulence
Fig. 3. Distribution of ion-cyclotron noise electric field intensity in 150–500 Hz range for July 2006 (above) and for December 2006 (below).
Northern Hemisphere and in summer there is inverse situa-tion. The behavior of the noise coincides with distribution of the whistlers.
Then we try to find a correlation of VLF signal broadening with width of ion-cyclotron band (noise broadening), which is presented in Fig. 4. These calculations are produced for middle-latitude ionosheric turbulence zone with strong seis-micity over Japan (Fig. 5) that is the zone of our previous study (Rozhnoi et al., 2007). The width of the zone is 25◦that provides one orbit every day. SB and width of ion-cyclotron band (noise broadening) are averaged for the part of orbits passed over the zone so we have one value of both charac-teristics every day. Cross-covariance function was calculated for the period March 2005–December 2006 in the interval
±5 days, and days with missing data have not been included in computation. Result shows some correlation of SB of the signal and the width of ion-cyclotron band. Correlation coef-ficient is about 12% and its value lager than 95% of the upper boundary of the interval of reliability for 450 points.
3 Correlation with magnetic storms and seismicity
Correlation analysis has been applied for four selected zones with strong seismicity (Fig. 5) in which we use seismic data from USGS catalog. Cross-covariance function was
calcu-lated for the period ±10 days (Dst index) and ±15 days
(seismic magnitude M) for ELF/VLF emission in the differ-ent frequency bands and also for VLF signal (A0), SNR and
signal SB. Characteristics of DEMETER data are averaged for the part of orbit passed over each zone every day, for Dst
index is used the minimal value during a day. Results of correlation with magnetic storm (Dstindex) are presented in
Fig. 6. Correlation with magnetic storms has been found only for ion-cyclotron noise in all zones of analysis and for the ELF noise in 500–1500 Hz band in region above Japan. For this region some correlation between Dstand VLF spectrum
broadening has been revealed too. Correlation coefficient in all these cases surpasses the level of 95% of the reliability interval.
Finally we show a correlation of characteristics under con-sideration with seismicity (Fig. 7). Correlation was made for strong earthquakes (M≥6) because in our previous pa-pers (Molchanov et al., 2006; Rozhnoi et al., 2007) the effect from strong earthquakes was found in satellite observation. The main problem here is discontinuous of earthquake data. Therefore we have used technique of optimization discrete quantities with the window equal an average half period be-tween events for transformation of discontinuous series into quasi-continuous. At first for every region the average period of time between earthquakes has been estimated. Then in the
A. Rozhnoi et al.: Correlation of signal broadening with ionospheric turbulence 1109
Fig. 4. Correlation of VLF signal spectrum broadening (SB) and width of ion-cyclotron band (noise broadening) in ionosheric turbulence
zone over Japan for the period March 2005–November 2006. Two upper panels are spectrum broadening and noise broadening data depend-ing on observation day number (days with missdepend-ing data are not included in computation). Bottom panel is correlation coefficient normalized to root mean square in the interval ±5 days.
windows equal the average half period the values were calcu-lated for every day in both directions as linear decaying from real magnitude M to 0. Results of the analysis demonstrate some correlation with seismicity only above Japan region. Decrease of SNR value and increase of ion-cyclotron noise is observed around the date of strong earthquake in this re-gion. Coefficient correlation is about 15% and it is smaller than 95% of the upper boundary of the interval of reliability. So the correlation is not significant and it has only type of tendency.
4 Discussion and conclusions
Our conclusions are the following:
– There are two zones of increased VLF signal spectrum
broadening, which are centered near magnetic latitudes = ±10◦and = ±40◦. Basing on the previous case study research (Molchanov et al., 2004; Hobara et al., 2005) and ground ionosonde registrations it is probably evi-dence of nonlinear (active) scattering of VLF signal on the ionospheric turbulence. However occurrence rate of SB in the middle-latitude area is higher than in the near-equatorial zone (∼15–20% in comparison with ∼100%
Fig. 5. Zones of analysis with indication of the large earthquake
1110 A. Rozhnoi et al.: Correlation of signal broadening with ionospheric turbulence
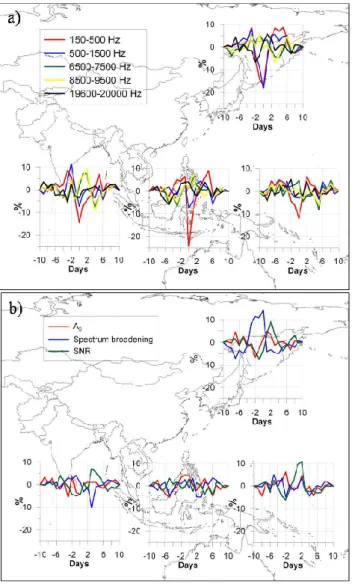
Fig. 6. Correlation with Dst: (a) electric field intensity in the
differ-ent frequency ranges; (b) A0, SNR spectrum broadening (19.8 kHz) for selected zones of analysis.
in former area) that is probably coincides with the rate of ionospheric turbulence.
– From two years statistics of observation in the selected 3
low-latitude regions and 1 middle-latitude region inside reception area of VLF signal we find a correlation of SB neither with ion-cyclotron noise (f =150–500 Hz), which possibly means poor representation of the tur-bulence by the noise due to its mixture with natural ELF emission (which correlates with whistler), nor with magnetic storm activity.
– We find rather evident correlation of ion-cyclotron
noise, VLF signal depression and weak correlation of SB with seismicity in the middle-latitude region over
Fig. 7. Correlation with M: (a) electric field variation for different
frequency ranges; (b) signal amplitude (A0), spectrum broadening (SB) and SNR. N – number of earthquakes with M≥6 during 2005– 2006 period.
Japan. But in the low-latitude regions we do not find such a correlation.
In order to emphasize the main results of the correlation with seismicity for Japan region they are represented in Fig. 8. Filled areas show an exceeding of the two standard deviation (2 σ ) level. Although the correlation is not significant, clear decrease of SNR value and increase of ion-cyclotron noise is observed around the date of strong earthquake. The increase of low-frequency emission in 2–3 times were observed during earthquakes in Italy (Bella et al., 1992) and in Japan (Liu et al., 2006) for ground observation. For Japan region statistically was found decrease foF2 in day of earthquake whereas for Taiwan such changes were not detect (Liperovskaya et al., 2006; Liu et al., 2006). Note
A. Rozhnoi et al.: Correlation of signal broadening with ionospheric turbulence 1111
Fig. 8. Correlation of ion-cyclotron noise, SNR and spectrum broadening (19.8 kHz) with M for Japan region. Dashed lines show two standard deviation (2 σ ) levels.
that in recent paper Nemec et al. (2008) for DEMETER data statistically was found decrease of the signal in frequency range 1.3–2.4 kHz in day of earthquake (M≥4.8). The evident statistical decrease of SNR value supports by our case studies (Rozhnoi et al., 2007). However rather weak SB-seismicity statistical correlation means probably that passive scattering prevails upon nonlinear (active) one.
Edited by: M. Contadakis
Reviewed by: two anonymous referees
References
Bell T. F., James, H. G., Inan, U. S., and Katsufrakis, J. P.: The apparent spectral broadening of VLF transmitter signals during transionospheric propagation, J. Geophys. Res., 88, 4813–4816, 1983.
Berthelier, J. J., Godefroy, M., Leblanc, F., Malingre, M., Men-vielle, M., Lagoutte, D., Brochot, J. Y., Colin, F., Elie, F., Legen-dre, C., et al.: ICE, the electric field experiment on DEMETER, Planet. Space Sci., 54, 456–471, 2006.
Bella, F., Biagi, P. F., Della, M. G., Zilpimiani, D. O., Mandzhgal-adze, P. V., Pokhotelov, O. A., Sgrigna, V., Ermini, A., and Liper-ovsky, V. A.: Observations of Natural Electromagnetic Radiation during Earthquakes in Central Italy, Izvestiya, Earth Phys., 28(1), 88–94, 1992.
Hobara, Y., Lefeuvre, F., Parrot, M., and Molchanov, O. A.: Low latitude ionospheric turbulence and possible association with seismicity from satellite Aureol 3 data, Ann. Geophys., 23, 1259–1270, 2005,
http://www.ann-geophys.net/23/1259/2005/.
Kelley, M. C.: The Earth’s Ionosphere: Plasma Physics and Electro-dynamics, Int. Geophys. Ser., 43, 487 pp., Academic, San Diego, Calif., 1989.
Liperovskaya, E. V., Parrot, M., Bogdanov, V. V., Meister, C.-V., Rodkin, M. V., and Liperovsky, V. A.: On variations of foF2 and F-spread before strong earthquakes in Japan, Nat. Hazards Earth Syst. Sci., 6, 735–739, 2006,
http://www.nat-hazards-earth-syst-sci.net/6/735/2006/.
Liu, J. Y., Chen, Y. I., Chuo, Y. J., and Chen, C. S.: A statistical investigation of preearthquake ionospheric anomaly, J. Geophys. Res., 111, A05304, doi:10.1029/2005JA01333, 2006.
Molchanov, O. A., Hayakawa, M., Afonin, V. V., Akentieva, O. A., and Mareev, E. A.: Possible influence of seismicity by grav-ity waves on ionospheric equatorial anomaly from data of IK-24 satellite 1. Search for idea of seismo-ionosphere coupling, in Seismo-Electromagnetics (Lithosphere-Atmosphere-Ionosphere Coupling), edited by: Hayakawa, M. and Molchanov, O., Ter-rapub, 275–285, 2002.
Molchanov, O. A., Akentieva, O. S., Afonin, V. V., Mareev, E. A., and Fedorov, E. N.: Plasma density-electric field turbulence in the low-latitude ionosphere from the observation on satellites; possible connection with seismicity, Phys. Chem. Earth, 29, 569– 577, 2004.
Molchanov, O., Rozhnoi, A., Solovieva, M., Akentieva, O., Berthe-lier, J. J., Parrot, M., Lefeuvre, F., Biagi, P. F., Castellana, L., and Hayakawa, M.: Global diagnostics of the ionospheric perturba-tions related to the seismic activity using the VLF radio signals collected on the DEMETER satellite, Nat. Hazards Earth Syst. Sci., 6, 745–753, 2006,
http://www.nat-hazards-earth-syst-sci.net/6/745/2006/.
Nemec, F., Santol´ık, O., Parrot, M., and Berthelier, J. J.: Spacecraft observations of electromagnetic perturbations con-nected with seismic activity, Geophys. Res. Lett., 35, L05109, doi:10.1029/2007GL032517, 2008.
Rozhnoi, A., Molchanov, O., Solovieva, M., Gladyshev, V., Aken-tieva, O., Berthelier, J. J., Parrot, M., Lefeuvre, F., Hayakawa, M., Castellana, L., and Biagi, P. F.: Possible seismo-ionosphere perturbations revealed by VLF signals collected on ground and on a satellite, Nat. Hazards Earth Syst. Sci., 7, 617–624, 2007, http://www.nat-hazards-earth-syst-sci.net/7/617/2007/.
Tanaka, Y., Lagoutte, D., Hayakawa, M., and Lefeuvre, F.: Spectral broadening of VLF transmitter signals and sideband structure ob-served on Aureol-3 satellite at middle latitudes, J. Geophys. Res., 92, 7551–7559, 1987.
Titova, E. E., Di, V. L., and Jurov, V. E.: Interaction between VLF waves and the turbulent ionosphere, Geophys. Res. Lett., 11, 323–330, 1984.