HAL Id: hal-00302786
https://hal.archives-ouvertes.fr/hal-00302786
Submitted on 16 May 2007HAL is a multi-disciplinary open access
archive for the deposit and dissemination of sci-entific research documents, whether they are pub-lished or not. The documents may come from teaching and research institutions in France or abroad, or from public or private research centers.
L’archive ouverte pluridisciplinaire HAL, est destinée au dépôt et à la diffusion de documents scientifiques de niveau recherche, publiés ou non, émanant des établissements d’enseignement et de recherche français ou étrangers, des laboratoires publics ou privés.
First direct observation of the atmospheric CO2
year-to-year increase from space
M. Buchwitz, O. Schneising, J. P. Burrows, H. Bovensmann, J. Notholt
To cite this version:
M. Buchwitz, O. Schneising, J. P. Burrows, H. Bovensmann, J. Notholt. First direct observation of the atmospheric CO2 year-to-year increase from space. Atmospheric Chemistry and Physics Discussions, European Geosciences Union, 2007, 7 (3), pp.6719-6735. �hal-00302786�
ACPD
7, 6719–6735, 2007First direct observation of CO2 increase from space
M. Buchwitz et al. Title Page Abstract Introduction Conclusions References Tables Figures ◭ ◮ ◭ ◮ Back Close
Full Screen / Esc
Printer-friendly Version Interactive Discussion
EGU
Atmos. Chem. Phys. Discuss., 7, 6719–6735, 2007 www.atmos-chem-phys-discuss.net/7/6719/2007/ © Author(s) 2007. This work is licensed
under a Creative Commons License.
Atmospheric Chemistry and Physics Discussions
First direct observation of the
atmospheric CO
2
year-to-year increase
from space
M. Buchwitz, O. Schneising, J. P. Burrows, H. Bovensmann, and J. Notholt
Institute of Environmental Physics (IUP), University of Bremen FB1, Bremen, Germany Received: 13 April 200 – Accepted: 8 May 2007 – Published: 16 May 2007
ACPD
7, 6719–6735, 2007First direct observation of CO2 increase from space
M. Buchwitz et al. Title Page Abstract Introduction Conclusions References Tables Figures ◭ ◮ ◭ ◮ Back Close
Full Screen / Esc
Printer-friendly Version Interactive Discussion Abstract
The reliable prediction of future atmospheric CO2concentrations and associated global climate change requires an adequate understanding of the CO2 sources and sinks. The sparseness of the existing surface measurement network limits current knowledge about the global distribution of CO2surface fluxes. The retrieval of the CO2total vertical
5
column from satellite observations is predicted to improve this situation. Such an appli-cation however requires very high accuracy and precision on the order of 1% (4 ppm) or better. We report on retrievals of the column-averaged CO2 dry air mole fraction, denoted XCO2, from the measurements of the SCIAMACHY satellite instrument be-tween 2003 and 2005. We focus on northern hemispheric large scale CO2 features
10
such as the CO2 seasonal cycle and show – for the first time – that the atmospheric annual increase of CO2can be directly observed using satellite measurements of the CO2 total column. The satellite retrievals are compared with the global assimilation system CarbonTracker and with local surface CO2 measurements based on weekly flask sampling. We show that the year-to-year CO2 increase as determined from the
15
satellite data agrees with the reference data within about 1 ppm/year. We also show that the CO2 seasonal cycle over northern hemispheric low and mid latitudes can be retrieved with a precision of about 2 ppm. The results presented here demonstrate that it is possible using satellite measurements to retrieved information on the atmospheric CO2on the level of a few parts per million.
20
1 Introduction
Carbon dioxide (CO2) is the most important anthropogenic greenhouse gas. In spite of the ratification of the Kyoto Protocol, the release of CO2is expected to continue to increase (IPCC, 2007). By using the precise but sparse in-situ CO2 measurements of the surface network, which comprises about 100 ground stations not equally
dis-25
ACPD
7, 6719–6735, 2007First direct observation of CO2 increase from space
M. Buchwitz et al. Title Page Abstract Introduction Conclusions References Tables Figures ◭ ◮ ◭ ◮ Back Close
Full Screen / Esc
Printer-friendly Version Interactive Discussion
EGU
by a variety of approaches (Gurney et al.,2002;R ¨odenbeck et al.,2003;Patra et al.,
2006). These studies, which primarily used surface CO2 data on a weekly basis, re-veal that the inferred uncertainties of the CO2 surface fluxes at the continental and ocean basin scale depend on many factors such as the a-priori assumptions made about the distribution of the CO2fluxes and their assumed uncertainties. In addition,
5
attempts have been made for selected regions to better constrain the regional fluxes using continuous high-frequency CO2in-situ observations (Derwent et al.,2002;Peylin
et al.,2005). As pointed out byPeylin et al.(2005) these regional results also depend critically on several assumptions related to the required smoothness, the initial condi-tions, and the global flux field. Inverse modelling studies have suggested that satellite
10
measurements of the column-averaged CO2dry air mole fraction, XCO2, have the po-tential to significantly improve the determination of source sink distributions of CO2 (Rayner and O’Brien, 2001; Houweling et al., 2004). This results primarily from the large amounts of data that satellites produce, but also because nadir satellite remote sensing measurements can observe the CO2molecules in the entire air column. As a
15
result vertical transport modelling errors are less critical compared to inversions based on in-situ observations only.
SCIAMACHY on ENVISAT (Burrows et al.,1995;Bovensmann et al.,1999) is the first satellite instrument, which makes the necessary observation of CO2 and O2 absorp-tions in the back scattered solar near infrared (NIR) and short wave infrared (SWIR)
20
spectral regions (Buchwitz et al., 2005a,b, 2006). According to Rayner and O’Brien
(2001) the precision, or random error, of the satellite measured XCO2is required to be less than approximately 2.5 ppm (0.7% of 375 ppm) for monthly averages and 8◦
×10◦ regions to constrain the CO2 fluxes better than the surface network. Probably even more critical than random errors are potential systematic errors, as even a small
sys-25
tematic error between regions may be misinterpreted as a large CO2 source or sink. Currently no study exists where the acceptable bias between regions, or the relative ac-curacy, of the satellite XCO2measurements, has been specified without major assump-tions. For the near future dedicated greenhouse gas satellite missions are planned,
ACPD
7, 6719–6735, 2007First direct observation of CO2 increase from space
M. Buchwitz et al. Title Page Abstract Introduction Conclusions References Tables Figures ◭ ◮ ◭ ◮ Back Close
Full Screen / Esc
Printer-friendly Version Interactive Discussion
most notably OCO (Crisp et al.,2004) and GOSAT (Hamazaki et al.,2004), which will perform similar measurements as SCIAMACHY, but optimised for CO2. For GOSAT the required relative accuracy for sub-continental spatial resolution and 3-month XCO2 averages is 1% or 4 ppm (Hamazaki et al.,2004).
Here we present three years (2003-2005) of SCIAMACHY XCO2 retrievals. The
5
XCO2has been retrieved using the latest version of our retrieval algorithm WFM-DOAS (version 1.0). Details about the algorithm are given in Schneising et al. (2007)1. Here we present a first discussion of the new multi year XCO2 data set focussing on large scale CO2 features over the northern hemisphere. We demonstrate, for the first time, that the about 1–3 ppm/year increase of the atmospheric CO2, which primarily results
10
from the burning of fossil fuels, can be directly observed from space. Indirectly, this has been shown earlier by Aumann et al. (2005), analysing AIRS middle to upper tropospheric temperature retrievals based on observations of the 4.3 micron CO2band. In that study it has been found that the retrieved temperature shows a decreasing trend because of the upward shift of the AIRS weighting functions with increasing CO2,
15
thereby sampling colder parts of the troposphere (because of the negative lapse rate) when CO2increases.
This paper is structured as follows: Sect. 2 gives a short overview about the SCIA-MACHY satellite instrument. Section 3 introduces the XCO2 retrieval algorithm. As not all the satellite XCO2 measurements are useful, for example, due to clouds, the
20
satellite retrieved XCO2 must be filtered. This is described in Sect. 4. The main part of this paper is Sect. 5 where the XCO2 data set is presented and discussed. Final conclusions are given in Sect. 6.
1
Schneising, O., Buchwitz, M., Burrows, J. P., et al.: Three years of satellite measurements of column-averaged dry air mole fractions of greenhouse gases – Part 1: Carbon dioxide, in preparation, 2007.
ACPD
7, 6719–6735, 2007First direct observation of CO2 increase from space
M. Buchwitz et al. Title Page Abstract Introduction Conclusions References Tables Figures ◭ ◮ ◭ ◮ Back Close
Full Screen / Esc
Printer-friendly Version Interactive Discussion
EGU
2 SCIAMACHY
The SCIAMACHY project (Burrows et al.,1995; Bovensmann et al.,1999) was intiti-ated in 1988 and is a German, Dutch and Belgian contribution to the ESA ENVISAT, which flies in a sun-synchronous orbit in descending node, crossing the equator at 10:00 a.m. local time. The SCIAMACHY instrument is a grating spectrometer, which
5
measures solar radiation, reflected at the Earth’s surface, backscattered from the at-mosphere, transmitted through the atat-mosphere, or emitted from the atmosphere in the ultraviolet, visible, and NIR/SWIR spectral regions (240–1750 nm, 1940–2040 nm, 2265–2380 nm) at moderate spectral resolution (0.2–1.4 nm). SCIAMACHY observes the Earth’s atmosphere in various viewing geometries. Of relevance for this study is the
10
nadir viewing mode (down-looking) and the 1558–1594 nm and 755–775 nm spectral regions containing molecular CO2 and oxygen (O2) absorption lines. The column-averaged dry air mole fraction of CO2, XCO2, is calculated from the retrieved columns of CO2 and O2 (Buchwitz et al., 2005a). The horizontal resolution, i.e., the size of a single ground pixel, is typically 30 km along track (nearly north-south) and 60 km
15
across track (nearly east-west). On the Earth’s dayside, an alternating sequence of nadir and limb measurements is performed. Full longitudinal (global) coverage in nadir is achieved at the equator in six days and more rapidly at higher latitudes. As shown inBuchwitz et al. (2005a), the sensitivity of the SCIAMACHY CO2 measurements is only weakly dependent on altitude throughout the troposphere and down to the Earth’s
20
surface. The latter is a pre-requisite to obtain regional CO2 source/sink information, which is the main scientific goal of the SCIAMACHY CO2measurements.
3 SCIAMACHY XCO2retrieval algorithm
Different groups have developed different algorithms to retrieved CO2columns or XCO2 from the SCIAMACHY nadir spectra (e.g., Barkley et al., 2006, 2007; B ¨osch et al.,
25
Spec-ACPD
7, 6719–6735, 2007First direct observation of CO2 increase from space
M. Buchwitz et al. Title Page Abstract Introduction Conclusions References Tables Figures ◭ ◮ ◭ ◮ Back Close
Full Screen / Esc
Printer-friendly Version Interactive Discussion
troscopy (WFM-DOAS) method to retrieve the XCO2 from SCIAMACHY as described in detail elsewhere (Buchwitz et al.,2000, 2005a,b,2006). In short, WFM-DOAS is a least-squares method based fitting a linearized radiative transfer model plus a low-order polynomial to the logarithm of the measured sun-normalized radiance. The low order polynomial is included in the fit to account for not well known, ideally
multiplica-5
tive, low frequency radiance modulations arising from, e.g., aerosol scattering. The fit parameters for the trace gases yield directly the vertical columns. The WFM-DOAS reference spectra are the logarithm of the sun-normalized radiance and its derivatives, computed with a radiative transfer model taking into account multiple scattering.
The CO2 column fit parameter is the relative deviation of the CO2 vertical column
10
from the atmospheric model vertical column assumed for the radiative transfer simu-lations. The assumed CO2 vertical mixing ratio profile is constant (370 ppm) and this profile is converted to number density and scaled during the fitting procedure without changing the profile shape. For the results presented here it is important to point out that the retrieval algorithm has no knowledge about CO2variations in time and space.
15
The results shown here are therefore free of any influence of a priori information about the spatio-temporal behaviour of CO2. In order to convert the retrieved absolute CO2 vertical column into XCO2, the CO2 column has to be divided by the corresponding dry air column. We obtain the dry air using simultaneous measurements of molecu-lar oxygen (O2), assuming a constant mixing ratio of O2 (0.2095). The CO2 column
20
is retrieved from the spectral region 1558–1594 nm located in the SWIR part of the electromagnetic spectrum, and the O2 column is retrieved from the spectral region 755–775 nm (O2A-band).
The satellite XCO2year 2003–2005 data set presented here has been obtained with an improved version of our retrieval algorithm, WFM-DOAS version 1.0 (WFMDv1.0)
25
(Schneising et al., 20071). As shown in Schneising et al. (2007)1the main problems of the previous version WFMDv0.4 (Buchwitz et al.,2005a,b) have been solved primarily by using spectra with improved calibration (Level 1 data product version 5 instead of version 4), a better consideration of surface spectral reflectivity variability, and by the
ACPD
7, 6719–6735, 2007First direct observation of CO2 increase from space
M. Buchwitz et al. Title Page Abstract Introduction Conclusions References Tables Figures ◭ ◮ ◭ ◮ Back Close
Full Screen / Esc
Printer-friendly Version Interactive Discussion
EGU
implementation of several minor improvements. This resulted in higher accuracy of the retrieved XCO2. For example, it is no longer required to apply a quite large empirical scaling factor as was necessary for WFMDv0.4 XCO2.
4 Quality filtering of the SCIAMACHY XCO2
Because of the demanding requirements on accuracy and precision, we have applied
5
a stringent quality filter to the data shown here. As a result of this filtering, many surements are currently rejected. The filtering (see below) removes most of the mea-surements at high latitudes and over the southern hemisphere, because the analysis of SCIAMACHY XCO2 is restricted to cloud free and snow and ice free land surfaces. In this study we focus on northern hemispheric low and mid latitudes. For the future
10
we will aim at further improving the retrieval algorithm to be able to relax the quality filtering in order to enhance the XCO2data set.
The quality filtering approach is described in detail in Schneising et al. (2007)1. Here we restrict the description to a short overview. Quality flags marking successful mea-surements are set for each observed ground scene. For cloud detection, the measured
15
oxygen columns and the sub-scene information provided by the SCIAMACHY Polariza-tion Measurement Devices (PMDs) are used. This approach (Buchwitz et al.,2005a) does not discriminate between clouds and snow or ice covered surfaces and therefore also rejects most of the measurements over snow or ice covered surfaces. With the exception of sun-glint conditions, water has a much lower surface spectral reflectance
20
in the SWIR spectral region than typical land surfaces, resulting in low signal-to-noise ratios of the SCIAMACHY nadir measurements in the SWIR spectral region. Because of the lower quality of the CO2measurements over water, the analyses presented here is restricted to measurements over land. In addition, several criteria are employed to ensure a high significance and quality of the spectral fits. As the maximum ground
al-25
titude (pressure) currently considered for WFM-DOAS radiative transfer simulations of the nadir spectra is 4 km, we have also filtered out scenes corresponding to a surface
ACPD
7, 6719–6735, 2007First direct observation of CO2 increase from space
M. Buchwitz et al. Title Page Abstract Introduction Conclusions References Tables Figures ◭ ◮ ◭ ◮ Back Close
Full Screen / Esc
Printer-friendly Version Interactive Discussion
elevation larger than 4.1 km. To reject ground scenes with strong aerosol contam-ination (Houweling et al., 2005; Aben et al., 2006) we have additionally filtered the SCIAMACHY XCO2measurements using NASA’s Absorbing Aerosol Index (AAI) data product from TOMS/Earthprobe.
5 Discussion of the XCO2data set
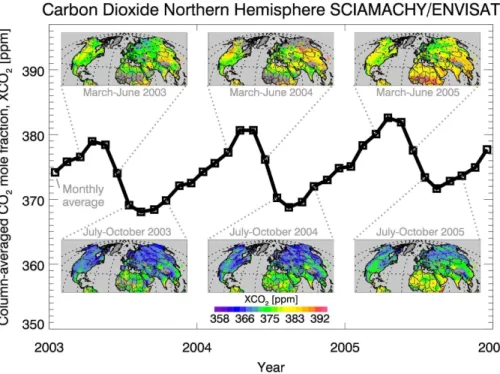
5
Figure 1 shows the retrieved XCO2over the northern hemisphere focusing on the sea-sonal cycle of CO2, i.e., on the regular once per year up and down of the atmospheric CO2 due to uptake and release of CO2 primarily by the terrestrial biosphere. Shown are also maps obtained by sampling the seasonal cycle during its XCO2 maximum and minimum time periods during the years 2003–2005. Figure 1 also clearly shows
10
that the retrieved XCO2 is slowly increasing with time. A quantitative analysis of the satellite retrievals with reference data such as the global assimilation system Carbon-Tracker (see below) suggests that the satellite data have a quite systematic low bias of approximately 1% (Schneising et al., 20071). To compensate for this, the XCO2shown in Fig. 1 has been scaled with 1.01.
15
In order to assess the quality of the retrieved XCO2we present in the following com-parisons with independent reference data. Figure 2 shows a comparison of SCIA-MACHY retrieved XCO2with that determined from the global assimilation system Car-bonTracker (Peters et al., 20072, see alsohttp://carbontracker.noaa.gov) for two north-ern hemispheric latitude bands. CarbonTracker is a global assimilation system
devel-20
oped by NOAA ESRL in cooperation with many partners. CarbonTracker is a reanalysis of the recent global surface fluxes of carbon dioxide, as estimated from a large set of atmospheric CO2mole fractions produced via a data assimilation system. The Carbon-Tracker XCO2field as used for this study has been sampled in space and time as the
2
Peters, W., Jacobson, A., Sweeneyet, C., et al.: The atmospheric perspective of carbon-dioxide exchange across North America: CarbonTracker, in preparation, 2007.
ACPD
7, 6719–6735, 2007First direct observation of CO2 increase from space
M. Buchwitz et al. Title Page Abstract Introduction Conclusions References Tables Figures ◭ ◮ ◭ ◮ Back Close
Full Screen / Esc
Printer-friendly Version Interactive Discussion
EGU
SCIAMACHY satellite instrument measures. The SCIAMACHY altitude sensitivity has been taken into account by applying the SCIAMACHY CO2 column averaging kernels (Buchwitz et al.,2005a) to the CarbonTracker CO2vertical profiles.
Figure 2 shows monthly mean composite values of XCO2 retrieved from SCIA-MACHY, averaged over +/–20 degrees latitude bands, centred at the latitudes of two
5
selected ground based stations, namely Mauna Loa (20◦N) and Mace Head (53◦N). The average surface observations at the two stations, based on weekly flask sam-pling, are also shown (obtained fromftp://ftp.cmdl.noaa.gov/ccg/co2/flask/month/). The quantitative comparison of the surface observations and the satellite XCO2is not possi-ble because of the different spatio-temporal sampling of the different types of
measure-10
ments and retrievals resulting in different seasonal cycles with respect to phase and amplitude (Olsen et al.,2004;Warneke et al.,2005). A direct comparison of the satel-lite XCO2 and the CarbonTracker XCO2 is possible using the CarbonTracker results obtained by averaging Carbon Tracker in the same way as the satellite observations. Within the two latitude bands, the phase of the XCO2seasonal cycle as retrieved from
15
satellite and modelled by CarbonTracker is in good agreement. The retrieved ampli-tude of XCO2 is however somewhat larger, especially in the latitude band centred at Mauna Loa, but within measurement error (see below). The surface observations and CarbonTracker show that the amplitude of the CO2 seasonal cycle is larger at higher latitudes, i.e., at the latitude of Mace Head, 53◦N, compared to the latitude of Mauna
20
Loa, 20◦N. This increase of the amplitude of the CO
2 seasonal cycle with increasing latitude is also observed by the satellite.
We have estimated the error of the retrieved XCO2seasonal cycle as shown in Fig. 2 to about 2 ppm. This error estimate has been obtained using two different independent approaches. Both approaches resulted in similar error estimates. The first approach
25
is based on simulated retrievals, the second one is based on using the measurements directly. First we describe the approach based on simulations. Barkley et al. (2006) have performed an error analysis of the WFM-DOAS retrieval algorithm and found that errors are introduced for the measured CO2 seasonal cycle if the variability of
ACPD
7, 6719–6735, 2007First direct observation of CO2 increase from space
M. Buchwitz et al. Title Page Abstract Introduction Conclusions References Tables Figures ◭ ◮ ◭ ◮ Back Close
Full Screen / Esc
Printer-friendly Version Interactive Discussion
atmospheric temperature, water vapour, and the CO2 vertical profile, are imperfectly considered for the retrieval. They estimated the time dependent part of the error on the measured CO2 column due to not perfectly accounted temperature and water vapour profile variability to be less than 0.6% peak to peak, corresponding to an error of the amplitude of less than 0.3%. These estimates are valid if the solar zenith angle is less
5
than 75◦and if temperature and water vapour profile scaling and shift parameters are included in the WFM-DOAS CO2 column fit, as done for this study. For XCO2 this corresponds to an error of the amplitude of the seasonal cycle of less than 1.2 ppm (0.3% of 375 ppm). Concerning the error resulting from CO2 vertical profile variability,
Barkley et al.(2006) using a set of CO2vertical profiles, estimated the error that results
10
if a constant CO2profile is used for the retrieval, as is the case for the results presented here. They found that this may result in an error of less than 0.9% peak to peak, for mid latitudes and the tropics, corresponding to an error of the amplitude of less than 0.45%. For XCO2 this corresponds to an error of less than 1.7 ppm. Both errors contribute to the total measurement error. In the worst case, assuming that all errors simply add
15
linearly and without any compensation, and assuming that the time dependence of the combined error is perfectly correlated with the CO2 seasonal cycle, which is not exactly the case (see,Barkley et al.,2006), this results in an error of the amplitude of the measured CO2seasonal cycle of less than 2.9 ppm (1.2 ppm + 1.7 ppm), i.e., less than 0.8%. This error is dominated by the CO2 vertical profile variability error. The
20
findings ofBarkley et al.(2006) are consistent with our own error analysis (Schneising et al., 20071).
The second approach to estimate the seasonal cycle measurement error is not based on simulations but is based on analysing the retrieved XCO2 over the south-ern and the northsouth-ern hemisphere. Over southsouth-ern hemispheric mid latitudes the
re-25
trieved seasonal cycle has an amplitude of about 5 ppm (Schneising et al., 20071) whereas the amplitude of the seasonal cycle of CarbonTracker is only about 1–3 ppm. For the year 2003 we have analysed the XCO2 difference (DIF), SCIAMACHY minus CarbonTracker, as a function of the air mass factor, AMF (here geometrically defined
ACPD
7, 6719–6735, 2007First direct observation of CO2 increase from space
M. Buchwitz et al. Title Page Abstract Introduction Conclusions References Tables Figures ◭ ◮ ◭ ◮ Back Close
Full Screen / Esc
Printer-friendly Version Interactive Discussion
EGU
as AMF = 1/cos(SZA) + 1/cos(LOS), where SZA is the solar zenith angle at the time of the satellite measurement and LOS is the line-of-sight scan angle of SCIAMACHY). When plotting DIF versus AMF we found a reasonable linear dependence which can be described by DIF = a+b*AMF. For southern hemispheric mid latitudes we found a = 23 ppm and b = –12 ppm with the dimensionless AMF varying between 2.3 (begin and
5
end of 2003) to 2.9 (mid 2003). We repeated this analysis not using CarbonTracker but assuming a constant XCO2value of 373 ppm. This resulted in nearly exactly the same coefficients a and b. We have applied this potential correction to the retrievals over the northern hemisphere but found that this results in a seasonal cycle significantly out of phase by about 2 months, compared to the seasonal cycle shown in Fig. 2. From this
10
we conclude that such as correction is too strong. We confirmed this by repeating this analysis for northern hemispheric mid latitudes. Here we obtained a = 10 ppm and b = –5 ppm (somewhat depending on spatial region). The error bar shown in Fig. 2 has been generated assuming an AMF (or SZA) dependent error that can be described by 10-5*AMF ppm. In addition, we have enhanced the error bar by 1 ppm to both sides.
15
This error bar, which is shown in Fig. 2, is similar as the independently determined error bar obtained from the analysis of the simulated retrievals as described above.
As also shown in Fig. 2, the annual CO2 increase, measured by the satellite, is in reasonable agreement with CarbonTracker and similar to the increase observed by the two ground stations, being on the order of 1–3 ppm/year. Figure 2 shows, for the first
20
time, that it is possible to observe the long-term increase of CO2from space. From the comparison with CarbonTracker and the surface CO2measurements one can conclude that the precision of the retrieved year-to-year increase is about 1 ppm/year.
6 Conclusions
We have presented and discussed three years of satellite measurements of the
25
column-averaged CO2dry air mole fraction retrieved from the SCIAMACHY instrument using the retrieval algorithm WFM-DOAS version 1.0. The satellite retrievals have been
ACPD
7, 6719–6735, 2007First direct observation of CO2 increase from space
M. Buchwitz et al. Title Page Abstract Introduction Conclusions References Tables Figures ◭ ◮ ◭ ◮ Back Close
Full Screen / Esc
Printer-friendly Version Interactive Discussion
compared with NOAA’s global assimilation system CarbonTracker. We have shown that the CO2 seasonal cycle over northern hemispheric low and mid latitudes can be retrieved with a precision of about 2 ppm. We have also shown, for the first time, that the year-to-year CO2 increase, which primarily results from the burning of fossil fuels, can be observed from space. Based on the comparison with CarbonTracker and the
5
highly precise NOAA surface CO2measurements obtained from weekly flask sampling we estimate the retrieval precision of the XCO2 increase to about 1 ppm/year. In this manuscript we have focused on demonstrating that the annual increase of atmospheric CO2can be observed from space. More details concerning the new WFM-DOAS ver-sion 1.0 retrieval algorithm and the XCO2year 2003 to 2005 data set will be presented
10
elsewhere (e.g., in Schneising et al., 20071).
Acknowledgements. We thank ESA and DLR for providing us with the SCIAMACHY Level 1
data. We appreciate the availability of CarbonTracker results fromhttp://carbontracker.noaa.gov
and comments on the initial manuscript from W. Peters and P. Tans from NOAA/ESRL/GMD. We thank T. J. Conway and colleagues, also NOAA/ESRL/GMD, for the CO2surface measurements
15
(obtained fromftp://ftp.cmdl.noaa.gov/ccg/co2/flask/month/). We also thank P. Wennberg (Cal-tech, Pasadena, California, USA) for the suggestion to investigte the dependence of the dif-ference between SCIAMACHY and CarbonTracker XCO2 over the southern hemisphere as a function of the airmass factor. The SCIAMACHY XCO2 has been filtered for strong aerosol contamination using TOMS/Earthprobe Absorbing Aerosol Index (AAI) data product obtained
20
from NASA/GSFC, which has been produced by the TOMS Ozone Processing Team (OPT). Funding for this study came from the German Ministry for Research and Education (BMBF) via DLR-Bonn (projects 50EE0027 and 50EE0507), from ESA (GSE project PROMOTE) and from the University and the State of Bremen. We acknowledge exchange of information within the European Commission Network of Excellence ACCENT.
25
References
Aben, I., Hasekamp, O., and Hartmann, W.: Uncertainties in the space-based measurements of CO2 columns due to scattering in the Earth’s atmosphere, J. Quant. Spectrosc. Rad.
ACPD
7, 6719–6735, 2007First direct observation of CO2 increase from space
M. Buchwitz et al. Title Page Abstract Introduction Conclusions References Tables Figures ◭ ◮ ◭ ◮ Back Close
Full Screen / Esc
Printer-friendly Version Interactive Discussion
EGU
Transfer, 104, 450–459, 2006. 6726
Aumann, H. H., Gregorich, D., and Gaiser, S.: AIRS hyper-spectral measurements for cli-mate research: Carbon dioxide and nitrous oxide effects, Geophys. Res. Lett., 32, L05806, doi:10.1029/2004GL021784, 2005. 6722
Barkley, M. P., Frieß, U. and Monks, P. S.: Measuring atmospheric CO2from space using full
5
spectral initiation (FSI) WFM-DOAS, Atmos. Chem. Phys., 6, 3517–3534, 2006,
http://www.atmos-chem-phys.net/6/3517/2006/. 6723,6727,6728
Barkley, M. P., Monks, P. S., Hewitt, A. J., Machida, T., Desai, A., Vinnichenko, N., Nakazawa, T., Yu Arshinov, M., Fedoseev, N., and Watai, T.: Assessing the near surface sensitivity of SCIAMACHY atmospheric CO2 retrieved using (FSI) WFM-DOAS, Atmos. Chem. Phys.
10
Discuss., 7, 2477–2530, 2007,
http://www.atmos-chem-phys-discuss.net/7/2477/2007/. 6723
B ¨osch, H., Toon, G. C., Sen, B., Washenfelder, R. A., Wennberg, P. O., Buchwitz, M., de Beek, R., Burrows, J. P., Crisp, D., Christi, M., Connor, B. J., Natraj, V., and Yung, Y. L.: Space-based near-infrared CO2 measurements: Testing the Orbiting Carbon Observatory
15
retrieval algorithm and validation concept using SCIAMACHY observations over Park Falls, Wisconsin, J. Geophys. Res., 111, D23302, doi:10.1029/2006JD007080, 2006. 6723
Bovensmann, H., Burrows, J. P., Buchwitz, M., Frerick, J., No ¨el, S., Rozanov, V. V., Chance, K. V., and Goede, A.: SCIAMACHY – Mission Objectives and Measurement Modes, J. Atmos. Sci., 56, 127–150, 1999. 6721,6723
20
Buchwitz, M., Rozanov, V. V., and Burrows, J. P.: A near infrared optimized DOAS method for the fast global retrieval of atmospheric CH4, CO, CO2, H2O, and N2O total column amounts from SCIAMACHY/ENVISAT-1 nadir radiances, J. Geophys. Res., 105, 15 231–15 246, 2000.
6724
Buchwitz, M., de Beek, R., Burrows, J. P., Bovensmann, H., Warneke, T., Notholt, J., Meirink,
25
J. F., Goede, A. P. H., Bergamaschi, P., K ¨orner, S., Heimann, M., and Schulz, A.: Atmo-spheric methane and carbon dioxide from SCIAMACHY satellite data: Initial comparison with chemistry and transport models, Atmos. Chem. Phys., 5, 941–962, 2005a.6721,6723,
6724,6725,6727
Buchwitz, M., de Beek, R., No ¨el, S., Burrows, J. P., Bovensmann, H., Bremer, H., Bergamaschi,
30
P., K ¨orner, S., and Heimann, M.: Carbon monoxide, methane, and carbon dioxide retrieved from SCIAMACHY by WFM-DOAS: year 2003 initial data set, Atmos. Chem. Phys., 5, 3313– 3329, 2005b.6721,6724
ACPD
7, 6719–6735, 2007First direct observation of CO2 increase from space
M. Buchwitz et al. Title Page Abstract Introduction Conclusions References Tables Figures ◭ ◮ ◭ ◮ Back Close
Full Screen / Esc
Printer-friendly Version Interactive Discussion
Buchwitz, M., de Beek, R., No ¨el, S., Burrows, J. P., Bovensmann, H., Schneising, O., Khlystova, I., Bruns, M., Bremer, H., Bergamaschi, P., K ¨orner, S., and Heimann, M.: Atmospheric car-bon gases retrieved from SCIAMACHY by WFM-DOAS: version 0.5 CO and CH4and impact of calibration improvements on CO2retrieval, Atmos. Chem. Phys., 6, 2727–2751, 2006,
http://www.atmos-chem-phys.net/6/2727/2006/. 6721,6724
5
Burrows, J. P., H ¨olzle, E., Goede, A. P. H., Visser H., and Fricke, W., SCIAMACHY – Scanning Imaging Absorption Spectrometer for Atmospheric Chartography, Acta Astronautica, 35(7), 445–451, 1995. 6721,6723
Crisp, D., Atlas, R. M., Breon, F.-M., Brown, L. R., Burrows, J. P., Ciais, P., Connor, B. J., Doney, S. C., Fung, I. Y., Jacob, D. J., Miller, C. E., O’Brien, D., Pawson, S., Randerson, J.
10
T., Rayner, P., Salawitch, R. S., Sander, S. P., Sen, B., Stephens, G. L., Tans, P. P., Toon, G. C., Wennberg, P. O., Wofsy, S. C., Yung, Y. L., Kuang, Z., Chudasama, B., Sprague, G., Weiss, P., Pollock, R., Kenyon, D., and Schroll, S.: The Orbiting Carbon Observatory (OCO) mission, Adv. Space Res., 34, 700–709, 2004. 6722
Derwent, R. G., Ryall, D. B., Manning, A. J., Simmonds, P. G., ODoherty, S., Biraud, S., Ciais, P.,
15
Ramonet, M., and Jennings, S. G., Continuous observations of carbon dioxide at Mace Head, Ireland from 1995 to 1999 and its net European ecosystem exchange, Atmos. Environ., 36, 2799–2807, 2002. 6721
Gurney, K. R., Rachel M. Law, R. M., Denning, A. S., Rayner, P. J., Baker, D., Bousquet, P., Bruhwiler, L., Chen, Y.-H., Ciais, P., Fan, S., Fung, I. Y., Gloor, M., Heimann, M., Higuchi,
20
K., John, J., Maki, T., Maksyutov, S., Masarie, K., Peylin, P., Michael Prather, M., Pak, B. C., Randerson, J., Jorge Sarmiento, J., Shoichi Taguchi, S., Takahashi, T., Yuen, C.-W.: Towards robust regional estimates of CO2 sources and sinks using atmospheric transport models, Nature, 415, 626–630, 2002. 6721
Hamazaki, T., Kaneko, Y., and Kuze, A., Carbon dioxide monitoring from the GOSAT satellite,
25
Proceedings XXth ISPRS conference, Istanbul, Turkey, 12–23 July 2004, p.3, http://www.
isprs.org/istanbul2004/comm7/papers/43.pdf, 2004. 6722
Houweling, S., Breon, F.-M., Aben, I., R ¨odenbeck, C., Gloor, M., Heimann, M., and Ciais, P.: Inverse modeling of CO2sources and sinks using satellite data: A synthetic inter-comparison of measurement techniques and their performance as a function of space and time, Atmos.
30
Chem. Phys., 4, 523–538, 2004,
http://www.atmos-chem-phys.net/4/523/2004/. 6721
ACPD
7, 6719–6735, 2007First direct observation of CO2 increase from space
M. Buchwitz et al. Title Page Abstract Introduction Conclusions References Tables Figures ◭ ◮ ◭ ◮ Back Close
Full Screen / Esc
Printer-friendly Version Interactive Discussion
EGU
F.-M.: Evidence of systematic errors in SCIAMACHY-observed CO2due to aerosols, Atmos. Chem. Phys., 5, 3003–3013, 2005,
http://www.atmos-chem-phys.net/5/3003/2005/. 6726
IPCC, Alley, R., Berntsen, T., Bindoff, N. L., et al., (drafting authors), Climate change 2007: The physical basis - Summary for policy makers, Contribution of working group I to the Fourth
5
Assessment Report of the Intergovernmental Panel on Climate Change (IPCC), IPCC web page (http://www.ipcc.ch/SPM2feb07.pdf), 2007.6720
Olsen, S. C., and Randerson, J. T.: Differences between surface and column atmo-spheric CO2 and implications for carbon cycle research, J. Geophys. Res., 109, D02301, doi:10.1029/2003JD003968, 2004. 6727
10
Patra, P. K., Gurney, K. R., Denning, A. S. Maksyutov, S., Nakazawa, T., Baker, D. Bousquet, P., Bruhwiler, L., Chen, Y.-H., Ciais, P., Fan, S., Fung, I., Gloor, M., Heimann, M., Higuchi, K., John, L., Law, R. M., Maki, T., Pak, B. C., Peylin, P., Prather, M., Rayner, P. J., Sarmiento, J., Taguchi, S., Takahashi, T., and Yuen, C.-W.: Sensitivity of inverse estimation of annual mean CO2 sources and sinks to ocean-only sites versus all-sites observational networks,
15
Geophys. Res. Lett., 33, L05814, doi:10.1029/2005GL025403, 2006.6721
Peylin, P., Rayner, P. J., Bousquet, P., Carouge, C., Hourdin, F., Heinrich, P., Ciais, P., and AE-ROCARB contributors: Daily CO2flux estimates over Europe from continuous atmospheric measurements: 1, inverse methodology, Atmos. Chem. Phys., 5, 3173–3186, 2005,
http://www.atmos-chem-phys.net/5/3173/2005/. 6721
20
Rayner, P. J. and O’Brien, D. M.: The utility of remotely sensed CO2 concentration data in surface inversions, Geophys. Res. Lett., 28, 175–178, 2001.6721
R ¨odenbeck, C., Houweling, S., Gloor, M., and Heimann, M.: CO2 flux history 1982–2001 inferred from atmospheric data using a global inversion of atmospheric transport, Atmos. Chem. Phys., 3, 1919–1964, 2003,
25
http://www.atmos-chem-phys.net/3/1919/2003/. 6721
Warneke, T., Yang, Z., Olsen, S., K ¨orner, S., Notholt, J., Toon, G. C., Velazco, V., Schulz, A., and Schrems, O.: Seasonal and latitudinal variations of columns averaged volume-mixing ratios of atmospheric CO2, Geophys. Res. Lett., 32, L03808, doi:10.1029/2004GL021597, 2005. 6727
ACPD
7, 6719–6735, 2007First direct observation of CO2 increase from space
M. Buchwitz et al. Title Page Abstract Introduction Conclusions References Tables Figures ◭ ◮ ◭ ◮ Back Close
Full Screen / Esc
Printer-friendly Version Interactive Discussion Fig. 1. Atmospheric CO2 over the northern hemisphere during 2003–2005 as retrieved from
SCIAMACHY satellite measurements. Shown is the column-averaged dry air mole fraction of CO2, denoted XCO2, in parts per million, ppm. The thick black curve shows the time depen-dence of the retrieved XCO2over the northern hemisphere in the time period 2003–2005 based on monthly averages (square symbols). Clearyl visible is the seasonal cylcle of CO2 and its annual increase. The maps show the spatial pattern of the retrieved XCO2over the northern hemisphere. For each map all quality filtered XCO2 measurements within a 4 months time periode have been averaged. The spatial resolution is 7◦
×7◦. The maps provide a visualiza-tion of the CO2“breathing” of our planet; here the term breathing refers to the regular uptake and release of CO2primarily by the terrestrial vegetation on a seasonal timescale, observed as higher than average March-June atmospheric CO2followed by lower than average July-October
ACPD
7, 6719–6735, 2007First direct observation of CO2 increase from space
M. Buchwitz et al. Title Page Abstract Introduction Conclusions References Tables Figures ◭ ◮ ◭ ◮ Back Close
Full Screen / Esc
Printer-friendly Version Interactive Discussion
EGU
Fig. 2. Comparison between satellite and CarbonTracker XCO2 for two latitude bands. The top panels show a comparison of seasonal averages (based on monthly mean anomalies smoothed using a 3 months running average). Shown is the retrieved XCO2 (blue; left axis) and the CarbonTracker XCO2(dark green; left axis) for two latitude bands of width +/–20◦
cen-tred at a latitude of 19.53◦N corresponding to Mauna Loa, Hawaii, USA, (left) and a latitude
of 53.33◦N corresponding to Mace Head, Ireland (right). For the SCIAMACHY XCO
2the
esti-mated error of the retrieved seasonal cycle is shown as light blue shaded area (see main text for details). Also shown are the CO2measurements based on flask sampling (red; right axis) at the two stations Mauna Loa (MLO; latitude: 19.53◦N, longitude: –155.58◦E, altitude: 3397 m)
and Mace Head (MHD; latitude: 53.33◦N, longitude: –9.90◦E, altitude: 25 m). Also shown are
the local CarbonTracker results (light green, right axis) at the locations of the two ground sta-tions. The bottom panels show the corresponding yearly mean anomalies as horizontal lines. For each data set the difference between two contiguous years has been computed (2004– 2003 and 2005–2004) and the corresponding numbers are given in the bottom panels. They correspond to the year-to-year CO2increase in the corresponding latitude band (first two rows; for SCIAMACHY (blue) and CarbonTracker (dark green)) or locally at the two ground stations (last two rows; for the ground stations (red) and CarbonTracker (light green)).