HAL Id: insu-02873590
https://hal-insu.archives-ouvertes.fr/insu-02873590
Submitted on 18 Jun 2020
HAL is a multi-disciplinary open access
archive for the deposit and dissemination of
sci-entific research documents, whether they are
pub-lished or not. The documents may come from
teaching and research institutions in France or
abroad, or from public or private research centers.
L’archive ouverte pluridisciplinaire HAL, est
destinée au dépôt et à la diffusion de documents
scientifiques de niveau recherche, publiés ou non,
émanant des établissements d’enseignement et de
recherche français ou étrangers, des laboratoires
publics ou privés.
Tian Shan Mountain Building, and Relation to
Pamir-Plateau Advance and Deep India-Asia
Indentation
Sanaa Abdulhameed, Lothar Ratschbacher, Raymond Jonckheere, Łukasz
Gągala, Eva Enkelmann, Alexandra Käßner, Myriam Kars, Adam Szulc,
Sofia-Katerina Kufner, Bernd Schurr, et al.
To cite this version:
Sanaa Abdulhameed, Lothar Ratschbacher, Raymond Jonckheere, Łukasz Gągala, Eva Enkelmann, et
al.. Tajik Basin and Southwestern Tian Shan, Northwestern India-Asia Collision Zone: 2.
Tim-ing of Basin Inversion, Tian Shan Mountain BuildTim-ing, and Relation to Pamir-Plateau Advance
and Deep India-Asia Indentation. Tectonics, American Geophysical Union (AGU), 2020, 39 (5),
pp.e2019TC005873. �10.1029/2019TC005873�. �insu-02873590�
Tian Shan Mountain Building, and Relation to
Pamir
‐Plateau Advance and Deep
India
‐Asia Indentation
Sanaa Abdulhameed1 , Lothar Ratschbacher1 , Raymond Jonckheere1 ,Łukasz Gągała1,2 , Eva Enkelmann3 , Alexandra Käßner1 , Myriam A. C. Kars4 , Adam Szulc1,5 ,
Sofia‐Katerina Kufner6 , Bernd Schurr6 , Jean‐Claude Ringenbach7, Mykhaylo Nakapelyukh1,8, Jahanzeb Khan1,9 , Mustafo Gadoev10 , and Ilhomjon Oimahmadov10
1Geologie, Technische Universität Bergakademie Freiberg, Freiberg, Germany,2Now at Hellenic Petroleum, Marousi, Greece,3Department of Geoscience, University of Calgary, Calgary, Alberta, Canada,4Center for Advanced Marine Core Research, Kochi University, Nankoku, Japan,5Now at CASP, Cambridge, UK,6Deutsches GeoForschungsZentrum GFZ, Potsdam, Germany,7E2S‐UPPA, CNRS, University Pau and Pays Adour, Pau, France,8Now at S. I. Subbotin Institute of Geophysics, NAS, Kyiv, Ukraine,9Now at Institute of Geology, The University of Azad Jammu and Kashmir,
Muzaffarabad, Pakistan,10Institute of Geology, Earthquake Engineering and Seismology, Tajik Academy of Sciences, Dushanbe, Tajikistan
Abstract
The Tajik basin and southwestern Tian Shan constitute the northwestern tip of the India‐Asia collision zone. Basin inversion formed the thin‐skinned Tajik fold‐thrust belt, outlined by westward convex fold trains, underlain by a décollement in Jurassic evaporites. The belt's leading edge—the Uzbek Gissar —and its transpressional northern lateral margin—the Tajik Gissar—constitute the thick‐skinned foreland buttresses. Apatitefission‐track data indicate ~40‐ to 15‐Ma reheating by sediment burial in the Tian Shan. In the Gissar and the Tajik fold‐thrust belt, apatite fission‐track and (U,Th)/He ages date the major phase of shortening/erosion between ~12 and 1 Ma, with exhumation to 2‐ to 3‐km crustal depths within a few Myr after onset of shortening. Shortening spread immediately across the fold‐thrust belt, typical for belts floored by a detachment in ductile rocks, and into the foreland buttresses. Reactivation concentrated in the internal (eastern) fold‐thrust belt with the thickest evaporates. The youngest ages (~6.6–1.6 Ma) occur along the Vakhsh thrust, the active erosional front of the fold‐thrust belt in the northeastern Tajik basin, where it narrows between the converging Tian Shan and Pamir. Our study links major events in the Pamir hinterland with the Tajik basin and Tian Shan foreland. In the late Eocene–early Miocene, the advancing Pamir‐plateau crust loaded the foreland, inducing subsidence, reheating, and early shortening. Basin inversion and major shortening/transpression in the foreland buttresses from ~12 Ma onward were synchronous with the subcrustal indentation of Indian lithosphere into the Tajik‐Tarim basin lithosphere and the onset of its rollback beneath the Pamir.1. Introduction
The Tajik basin of Central Asia is a retro‐foreland basin with ~7–10 km, southward and eastward thickening, Mesozoic‐Cenozoic strata at the northwestern tip of the India‐Asia collision zone (Figure 1a; e.g., Burtman & Molnar, 1993; Carrapa et al., 2015; Chapman et al., 2019; Klocke et al., 2017; Nikolaev, 2002). Jurassic‐Oligocene pretectonic, shallow‐marine to continental strata evolved into Neogene synorogenic, continental clastic deposits derived from the Tian Shan in the north and the Pamir and Hindu Kush in the east and south. Inversion of the basin into the Tajik fold‐thrust belt (FTB) occurred during the Neogene, but the structural evolution, timing, and relationship to the Pamir and Tian Shan are under discus-sion (e.g., Bourgeois et al., 1997; Chapman et al., 2017; Stübner, Ratschbacher, Rutte, et al., 2013; Jepson, Glorie, Konopelko, Gillespie, et al., 2018; Käßner et al., 2016; Kufner et al., 2018; Schneider et al., 2019; Schurr et al., 2014;Thomas, Chauvon, et al., 1994).
©2020. American Geophysical Union. All Rights Reserved.
This article is a companion to Dedow et al. (2020) https://doi.org/10.1029/ 2019TC005874, Gągała et al. (2020) https://doi.org/10.1029// 2019TC005871.
Key Points:
• ~40‐ to 15‐Ma sediment loading reheated the southern Tian Shan; major Tajik‐basin inversion and Tian Shan mountain building started at ~12 Ma
• ~12‐Ma shortening immediately spread to foreland buttresses and external fold‐thrust belt; reactivation affected its interior • Tajik‐basin inversion and major
Tian Shan mountain building were induced by lithospheric indentation of India into Asia beneath the Pamir Supporting Information: • Supporting Information S1 • Table S1 • Table S2 • Table S3 • Table S4 • Figure S1 • Figure S2 • Figure S3 • Figure S4 Correspondence to:
S. Abdulhameed and L. Ratschbacher, [email protected]‐freiberg.de;
Citation:
Abdulhameed, S., Ratschbacher, L., Jonckheere, R., Gągała, Ł., Enkelmann, E., Käßner, A., et al. (2020). Tajik basin and southwestern Tian Shan, northwestern India‐Asia collision zone: 2. Timing of basin inversion, Tian Shan mountain building, and relation to Pamir‐plateau advance and deep India‐Asia indentation. Tectonics, 39, e2019TC005873. https://doi.org/ 10.1029/2019TC005873 Received 3 SEP 2019 Accepted 14 MAR 2020
Accepted article online 18 MAR 2020 Corrected 20 MAY 2020
This article was corrected on 20 MAY 2020. See the end of the full text for details.
Figure 1. Active tectonics of the Tajik basin and surrounding mountain ranges. (a) Location of the Tajik basin at the western tip of the India‐Asia collision zone. (b) Digital elevation model with GNSS velocity vectors. (c) New fold‐fault map of Cenozoic structures of the Tajik basin and surrounding thick‐skinned fold‐thrust belts. Interpreted from 1:200,000 geological maps and Soviet seismic and drill‐hole data (compilation in Gągała et al., 2020), the Geological and Mineral Resource Map of Afghanistan (Doebrich & Wahl, 2006), satellite images (Google Earth®), andfieldwork between 2004 and 2014.
As indicated by the present deformationfield measured by Global Navigation Satellite System (GNSS; e.g., Ischuk et al., 2013; Perry et al., 2019; Zubovich et al., 2010, 2016), the Pamir moves north relative to stable Asia with little internal seismic deformation in its eastern part (Schurr et al., 2014). The western Pamir shows higher seismic deformation rates, expressed by strike‐slip and normal faults, indicating ~E‐W exten-sion together with ~N‐S shortening. The Pamir's northern margin thrusts over the intramontane Alai val-ley―remnant of a once contiguous Tajik‐Tarim basin system―causing intense seismicity along the Pamir thrust system (Figures 1b and 1c; Schurr et al., 2014; Sippl et al., 2014). Schurr et al. (2014) and Kufner et al. (2018) explained the active deformationfield by a combination of bulk northward displacement (Pamir orocline growth) and synchronous collapse and westward lateral materialflow (“lateral extrusion,” cf. Ratschbacher et al., 1991) of the Pamir plateau (~4 km average elevation) into the Tajik‐basin depression (~1 km average elevation); there, extrusion causes thin‐skinned, ~NW‐SE shortening of the Tajik‐basin strata above an evaporitic décollement and thick‐skinned shortening along the frontal and lateral foreland buttresses (Figure 1c). The northward movement and westward extrusion combine to cause the progressive rotation of the GNSS surface velocities from ~NNW to ~WNW from the eastern Pamir to the Tajik basin (Figure 1b).
Intense intermediate‐depth (~70–300 km) seismicity attests to subcrustal processes in the Hindu Kush and the Pamir (e.g., Kufner et al., 2017, 2016; Mechie et al., 2012;Pegler & Das, 1998; Schneider et al., 2013, 2019; Sippl, Schurr, Tympel, et al., 2013; Sippl, Schurr, Yuan, et al., 2013). Beneath the Hindu Kush, subduction of marginal Indian continental crust was inferred. Underneath the Pamir, the seismicity outlines an arcuate slab (“Pamir slab”), dipping ~E beneath the western and ~S beneath the eastern Pamir; it likely traces dela-mination and rollback of Asian (Tajik‐Tarim) lower crust and mantle beneath thickened (65–75 km) Pamir crust. Kufner et al. (2016) inferred that the northward advancing cratonic Indian lithosphere is forcing the delamination and rollback of Asian lithosphere (basement of the Tajik‐Tarim basins). They calculated that the delamination of ~380 km of Asian lithosphere at ~34 mm/year―the India‐Asia convergence rate in the western collision zone (Molnar & Stock, 2009)―has taken ~12–11 Myr.
Along the western deformation front of the India‐Asia collision, the Pamir interacts with the Tian Shan (Figure 1). Käßner et al. (2016) showed, based on apatitefission‐track (AFT) and (U,Th)/He (AHe) thermo-chronology, that moderate reheating in the southwestern Tian Shan (Tajik Gissar, including the Garm mas-sif; Figure 1b) occurred between ~40 and 15 Ma; accelerated exhumation/cooling took place over the last ~10 Myr. High exhumation rates correlate with pronounced local relief, produced by Cenozoic faults reactivating upper Paleozoic structures, and inversion of Mesozoic‐Cenozoic intra‐montane basins. Structurally, the Tajik Gissar is a broad, ~E trending zone of dextral transpression that includes the northern Tajik basin (Ilyak fault zone; Leith & Simpson, 1986) and the Pamir thrust system of the Pamir's northern margin (Figure 1c). It is the active deformationfield described above (Kufner et al., 2018; Schurr et al., 2014)―the interaction of the west-ward collapse of the Pamir plateau into the Tajik‐basin depression with the bulk northward motion of the Pamir―that transformed the southwestern Tian Shan into a dextral transpressional belt.
Figure 2a provides a sketch of the—above described—neotectonic deformation of the Pamir and the Tian Shan foreland adopted from Schurr et al. (2014), Käßner et al. (2016), and Kufner et al. (2018). It shows Indian lithosphere at subcrustal depths with the orange lines marking the outline of the transfer corridors between the underthrusting cratonic India under the Pamir and the subducting marginal Indian crust in the Hindu Kush (cf. Kufner et al., 2018, 2016). The green arrows show the directions of materialflow within the crust imposed by the Indian convergence at depth. The yellow band outlines the current position of the leading edge of subcrustal cratonic India at the surface. The red arrows show the materialflow directions in the Pamir upper‐middle crust. The red stippled lines and arrows in the center of the diagram trace the prin-cipal active fault pattern of the western Pamir and the associated deformationfield. The beach balls show representative focal‐mechanism solutions for the active deformation field. Figure 2b sketches the constraints imposed by the foreland shortening of the Asian (Tajik) crust on the geometry of the Tajik‐basin lithosphere (Pamir slab) beneath the Pamir (cf. Gągała et al., 2020). Sippl, Schurr, Yuan, et al., 2013) interpreted the sub-vertical cluster of seismicity between ~100‐ and 200‐km depth as representing eclogitized Asian (Tajik) lower crust, overlain between 60 and 100 km by subducted middle crust. Thus, the seismicity cluster and the sub-ducted Tajik middle crust approximate the down‐dip extension of the detachment(s) of the Tajik FTB and its basement. This geometry defines the curved upper interface of the rolling back Tajik‐basin lithosphere and is mimicked by the Tajik Moho down to ~90 km (Schneider et al., 2019). The≥175‐km shortening estimates in
Figure 2. (a) Diagram, modified from Schurr et al. (2014), Käßner et al. (2016), and Kufner et al. (2018), sketching the neotectonics of the Pamir, Tajik basin, and the southwestern Tian Shan, and its driver, the Indian lithosphere at subcrustal depths (crustal and lithospheric thickness not to scale). The orange lines in the subcrustal lithosphere mark the outline of the transfer corridors separating subducting marginal India from underthrusting cratonic India. The green arrows show directions of materialflow imposed by the India‐Asia convergence. The yellow band outlines the current position of the leading edge of the cratonic India at depth projected onto the surface. The red arrows show materialflow directions in the upper crust. The stippled lines and arrows in the center of the diagram trace principal fault pattern of the western Pamir. The beach balls show representative focal‐mechanism solutions for the active deformation field. The Pamir is pushed northward, with shortening concentrated along its northern perimeter, the Pamir thrust system (PTS). At the same time, the Pamir deforms internally by strike‐slip and normal faulting, producing ~E‐W extension, causing westward extrusion under overall N‐S shortening. The westwardflow imposes shortening of the Tajik‐basin sedimentary rocks above an evaporitic décollement. The northern transfer zone of the westward flow zone is accommodated along a broad dextral transpression corridor, comprising the Pamir thrust system, the Ilyak fault, and the Gissar range of the southwestern Tian Shan. SKF = Sarez‐Karakul fault system. (b) Cross‐sectional sketch of the constraints imposed by the foreland shortening of the Asian (Tajik) crust on the geometry of the Tajik‐basin lithosphere (Pamir slab) beneath the Pamir (cf. Gągała et al., 2020). The seismicity cluster and subducted Tajik middle crust approximate the down‐dip extension of the detachment(s) of the Tajik fold‐thrust belt and its basement. This geometry defines the curved upper interface of the rolling back Tajik‐basin lithosphere and is mimicked by the Tajik Moho. The shortening estimates in the Tian Shan (Uzbek Gissar) and the Tajik fold‐thrust belt and the yet unquantified amounts of accretion and deep subduction of Tajik (Asian) upper and middle crust in and beneath the North Pamir are considered a proxy for the amount of convergence since ~12 Ma. The sinistral‐normal Karakul‐Sarez fault system and the red zone on the right side of the cross section highlight the upper to lower crustalflow from the Pamir‐plateau crust to the foreland. (c) Cross‐sectional sketch of the ~23‐ to 15‐Ma evolution of the Pamir and is foreland. The ~37‐ to 20‐Ma crustal thickening is sketched by the thrust stacks and recumbent fold nappes of the Central Pamir. Gravitational collapse of the Pamir‐plateau crust followed, including the normal‐sense shear zone of the Central and southwestern Pamir. The collapse of the leading edge of the Pamir plateau transferred the deformation from the Central to the North Pamir. The ductile crust (red) is dragging the middle and upper crust foreland‐ward. The model geometries and kinematics are akin to models proposed for foreland‐directed plateau collapse (Rey et al., 2010). (d) Major structural features of the Tajik fold‐thrust belt and surrounding mountain ranges (Tian Shan in the north, Pamir on the right). Pamir orocline northward and westward advance and synchronous westward upper crustalflow induce structural asymmetry with much larger dextral strike‐slip along the northern margin of the fold‐thrust belt than sinistral strike‐slip along its southern margin. See text for references and discussion.
the Tian Shan foreland and the Tajik FTB (Gągała et al., 2020) and the yet unquantified amounts of accretion and deep subduction (Sippl, Schurr, Yuan, et al., 2013) of Tajik (Asian) upper and middle crust in and beneath the North Pamir are considered a proxy for the amount of convergence since ~12 Ma. The deep‐reaching seismic zone in this scenario constitutes an incomplete Tajik lithosphere, deprived of its mid-dle and upper crustal layer, the midmid-dle crust partly subducted to 80–100 km, and—together with the upper crust—accreted to the hanging‐wall and forming the North Pamir and the Tajik FTB. The sinistral‐normal Karakul‐Sarez fault system and the red zone on the right side of the cross section sketch the upper to lower crustal flow from the thick Pamir‐plateau crust to the foreland depression (Sass et al., 2014; Stübner, Ratschbacher, Rutte, et al., 2013).
The ~20‐ to 12‐Ma evolution of the Pamir is characterized by the northward advance and simultaneous foreland‐directed gravitational collapse of the Pamir plateau (Hacker et al., 2017; Robinson et al., 2004, 2007; Rutte, Ratschbacher, Khan, et al., 2017; Rutte, Ratschbacher, Schneider, et al., 2017; Stübner, Ratschbacher, Rutte, et al., 2013; Stübner, Ratschbacher, Weise, et al., 2013; Schurr et al., 2014; Worthington et al., 2020). The foreland advance has been accommodated by bulk foreland propagation of the Pamir orocline and coeval synconvergent crustal extension in the Pamir, in particular in the gneiss domes of the Pamir plateau. Following intense Paleogene crustal thickening, the domes of the Central and East Pamir (Yazgulom‐Sarez‐Muskol‐Shatput‐Muztaghata) were exhumed under ~N‐S extension along normal‐sense shear zones between ~20–15 Ma and―under decreasing rates― ~12 Ma, when shortening resumed. The ~N‐S extension in the South Pamir gneiss domes (Shakhdara‐Alichur) was active longer (~6–2 Ma). About E–W extension is active along the Kongur Shan extensional detachment of the East Pamir and the sinistral‐normal Sarez‐Karakul fault system that transects the Pamir NNE‐SSW (Figure 2a). The switch form crustal shortening to upper to (partly) lower crustal extension throughout the Pamir and Hindu Kush at ~23–20 Ma was contemporaneous with the proposed slab breakoff of Greater India from Cratonic India, which likely resulted in an elevated gravitational potential in the Pamir, triggering crustal collapse (e.g., Replumaz et al., 2010; Stearns et al., 2013, 2015; Rutte, Ratschbacher, Khan, et al., 2017; Rutte, Ratschbacher, Schneider, et al., 2017). Figure 2c sketches the ~20‐ to 12‐Ma evolution by a hinterland (Pamir plateau) to foreland (North Pamir and Tajik basin) cross section. The ~37‐ to 20‐Ma crustal thicken-ing—diagrammatically shown by the thrust stacks and recumbent fold nappes of the Central Pamir—was followed by gravitational collapse of the Pamir plateau, including the top‐to‐~N, normal‐sense shear zone of the Central Pamir and the top‐to‐~SSE, normal‐sense detachment zone of the southwestern Pamir. The ~20‐Ma onset of collapse of the leading edge of the Pamir plateau in the Central Pamir is interpreted to drive shortening north and northwest of it, transferring the deformation from the Central to the North Pamir (Rutte, Ratschbacher, Khan, et al., 2017; Rutte, Ratschbacher, Schneider, et al., 2017; Stübner, Ratschbacher, Rutte, et al., 2013; Stübner, Ratschbacher, Weise, et al., 2013; Worthington et al., 2020). The ductile crust (red in Figure 2c) is dragging the middle and upper crust foreland‐ward, mimicking the current displacementfield, however—given the at this time still large distance to the foreland buttresses —the flow was mostly northward. The model geometries and kinematics are akin to models proposed for foreland‐directed plateau collapse, modeled, for example, by Rey et al. (2010), their Figures 2 and 3). Herein, our major goal is to extend the“northward indentation‐westward flow” tectonic model of the active deformationfield (Figures 2a and 2b) in time and investigate the onset and progression of the inversion of the Tajik basin, and the age of the involvement of the western (Uzbek Gissar) and northern (Tajik Gissar) foreland buttresses of the Tajik FTB in the southwestern Tian Shan (Figure 1c). In part 1 of this paper series, Gągała et al. (2020) detail the structures, kinematics, and amount of shortening during the evolution of the Tajik FTB and its foreland; in part 3, Dedow et al. (2020) specify the preorogenic and synorogenic tectono‐sedimentary evolution of the eastern Tajik basin. Here, we provide estimates of burial temperatures from vitrinite‐reflectance maturity data of the Jurassic to Upper Cretaceous (Cr2) strata of the Tajik basin
and the Uzbek and Tajik Gissar, and zircon (U,Th)/He (ZHe), AFT, and AHe thermochronologic dates from samples of crystalline basement rocks of the Tajik and Uzbek Gissar, and the Jurassic to Lower Cretaceous (Cr1) clastic rocks of the Tajik basin, exhumed along the thrusts of the Tajik FTB. We show that inversion of
the Tajik basin and shortening in the Gissar commenced at ~12 Ma; seismicity and geodesy demonstrate that it is ongoing. Finally, we link the two major tectonic events in the Pamir hinterland, Tajik basin, and Tian Shan foreland, suggesting that the Paleogene‐early Miocene thickened, northward advancing, and collap-sing Pamir‐plateau crust loaded the foreland, causing burial, moderate reheating, and local exhumation at
~40–15 Ma. The coupling between the subcrustal Indian and Asian (Tajik‐Tarim) lithospheres initiated the Tajik‐basin inversion and started the major phase of Cenozoic Tian Shan mountain building at ~12 Ma.
2. Structural and Stratigraphic Framework of the Tajik Basin and the
Southwestern Tian Shan
Internally, the Tajik basin features ~N‐NE trending valleys and ridges (Figures 1b and 1c); they comprise bur-ied synclinoria and eroded anticlinoria (e.g., Thomas, Chauvin, et al., 1994; Nikolaev, 2002; Gągała et al., 2020). Toward the north, the thrusts and folds of the Tajik FTB bend ~E and merge with the dextral transpressive Ilyak fault zone, a basement‐rooted lateral ramp, in the northern Tajik basin (Gągała et al., 2020; Kufner et al., 2018). To the south in Afghanistan, the ~E trending Alburz‐Marmul fault, an active dextral fault zone (e.g., Ruleman et al., 2007), cuts ~NW trending folds and thrusts that connect―mostly concealed by the Amu‐Darya River floodplain―with those of the central Tajik basin. The Tajik FTB is detached along evapor-ites, the Late Jurassic Gaurdak Formation (e.g., Bekker, 1996; Burtman, 2000; Nikolaev, 2002).
Figure 2d summarizes the key structures and kinematics of the Tajik FTB and its foreland buttresses (Babaev, 1975; Bourgeois et al., 1997; Käßner et al., 2016; Gągała et al., 2020; Thomas, Chauvin, et al., 1994; Thomas, Gapais, et al., 1994; Thomas et al., 1996). The Uzbek Gissar—a basement culmination— forms the frontal foreland buttress of the Tajik FTB; it overrides the western margin of the Tajik basin and the eastern margin of the Amu‐Darya basin along ~200‐km‐long, thick‐skinned thrust fronts, forming an asymmetric pop‐up structure (Figure 1c). In the northeast, the basement‐cored thrust imbricates of the Uzbek Gissar connect to a broad belt of dextral transpression with a northward diminishing strike‐slip com-ponent in the southwestern Tian Shan—the Tajik Gissar. In the south, they plunge SW and disappear beneath the Amu‐Darya floodplain. Thus, the Ilyak fault zone and the broad belt of dextral transpression in the southwestern Tian Shan and the en‐échelon folds and thrusts south of the Amu‐Darya floodplain con-stitute the northern dextral and southern sinistral oblique‐lateral ramps of the westward advancing Tajik FTB, respectively. Paleomagnetic data indicate 0–53° anticlockwise rotations in the northern Tajik basin (Abdullaev & Rzhevsky, 1973; Bazhenov et al., 1994; Pozzi & Feinberg, 1991; Thomas, Chauvin, et al., 1994); this suggests much greater dextral shear along the Tajik FTB northern margin than sinistral shear along its southern margin.
The Gissar and the Tajik basin feature an ~7‐ to 10‐km thick sedimentary sequence (Figure S1 in the support-ing information). The full basal section crops out only in the Uzbek and Tajik Gissar, where local Triassic and widespread Lower Jurassic strata onlap the crystalline basement (Figure 3a). The décollement along the Upper Jurassic evaporites defines the base of the known section in the Tajik basin. The preorogenic strata comprise Lower‐Middle Jurassic coal‐bearing clastic rocks followed by shallow‐marine limestones, Upper Jurassic evaporites, Lower Cretaceous (Cr1) red beds, and variegated Upper Cretaceous (Cr2) to Oligocene
shallow‐marine strata. Upper Oligocene‐Miocene to Recent, synorogenic, mostly coarse‐grained clastic rocks comprise more than half (4–9 km) of the sedimentary section (e.g., GRI, 1961–1964; see Text S1 in the sup-porting information; Carrapa et al., 2015; Chapman et al., 2019; Klocke et al., 2017; Vlasov et al., 1991).
3. Samples and Methods
We analyzed vitrinite reflectance (Ro) in organic‐rich samples from Lower‐Middle Jurassic, Cr1, and Cr2
strata to determine thermal maturity; the analyzed lithologies comprised black shale, marl, and coal and represent kerogen types II/III. The samples were analyzed at TOTAL, Pau, France, and TU Bergakademie Freiberg, Germany, following standard procedures (Taylor et al., 1998). Table S1 in the supporting informa-tion lists the samples and provides the total organic carbon, and Ro (in %). We converted the %Ro values into burial temperatures following Barker and Goldstein (1990) and Sweeney and Burnham (1990). Thefirst developed an empirical relationship derived from a large dataset; the latter established an experimentally derived kinetic model. The temperatures obtained from these two approaches differ by up to 30 °C: The Sweeney and Burnham (1990) estimates yield higher values than those of Barker and Goldstein (1990) for temperatures less than ~130 °C, and the relationship is reverse for temperatures higher than ~130 °C; around 130 °C the values are identical.
We used AFT and AHe thermochronology for the timing of displacement and erosion along the intrabasin thrust‐cored anticlines and the basement‐involving ranges of the southwestern Tian Shan. These
Figure 3. Geologic‐structural maps of the Tajik basin and Tajik and Uzbek Gissar in the southwestern Tian Shan. (a) Sample locations. (b) Paleo‐temperature values (in °C) from vitrinite‐reflectance maturity measurements. (c) Paleo‐geothermal gradients for the Uzbek Gissar from measured stratigraphic thickness (Rubanov et al., 1963) and averaged paleo‐temperature estimates. (d) Paleo‐geothermal gradient for the Tajik basin from stratigraphic thickness measured in a seismic line (location see (b); Gągała, 2014) and averaged paleo‐temperature estimates from surface samples corresponding to the indicated sample interval. (e–g) Thermochronologic data. Rectangles mark the detailed age‐data maps in (f) and (g) below.
chronometers record temperatures in the range of ~110–40 °C, depending on the cooling rate, grain size, and chemistry (e.g., Farley & Stockli, 2002; Green et al., 1986). We investigated eight Cr1 and four
Oligocene‐Neogene sandstones from the north‐central Tajik FTB, six Cr1 sandstones from the northern
Tajik‐basin margin and the footwalls of thrusts bounding the intramontane Hakimi basin of the Tajik Gissar, three Cr1and three Oligocene‐Neogene sandstones from the eastern part of the Tajik FTB, three
metamorphic basement rocks from the western Pamir at the eastern margin of the Tajik basin (Darvaz‐Visharv Pamir), 28 Cr1sandstones and crystalline basement rocks from the Uzbek Gissar, and
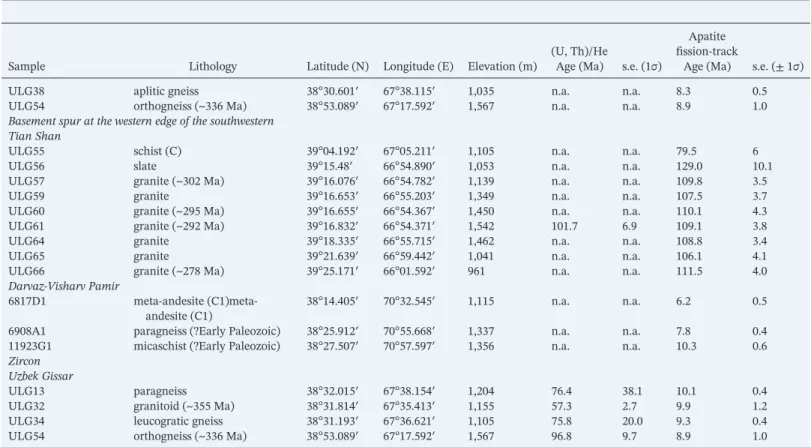
eight crystalline rocks from a basement spur at the western edge of the southwestern Tian Shan. Table 1 gives the sample locations and lithologies and summarizes the new thermochronologic data; Figures 3a locates the samples and those published in the previous studies (Chapman et al., 2017; Jepson, Glorie, Konopelko, Gillespie, et al., 2018a; Jepson, Glorie, Konopelko, Mirkamalov, et al., 2018; Käßner et al., 2016); these data will be discussed together with the new ones (section 5.2).
The samples were processed for apatite and zircon. AFT ages and track lengths were determined following standard procedures in the Freiberg Track Laboratory, described in Wauschkuhn et al. (2015) and Käßner et al. (2016); Text S2 provides a summary. In essence, we liberated the grains by high‐voltage‐discharge rock fragmentation, etched the apatite mounts in 5.5 M HNO3at 21 °C for 20 s, and determined ages with the
external detector method and theζ calibration, using the Durango‐apatite and IRMM‐450R uranium‐glass standards. Confined track‐length measurements were done on separate mounts, using132Xe‐ion irradiation to increase the number of measurable confined tracks. We applied thermal history (temperature‐time [T‐t]) modeling to samples with≥33 measured confined tracks using HeFTy (Ketcham, 2005) and present the results as a set of 250 good‐fit and acceptable‐fit T‐t solutions, and as contours of the node densities of 500 good‐fit solutions for highlighting the changes in the T‐t paths. Table S2 lists the AFT data.
Table 1
Sample Locations, Lithology, and Summary of Thermochronologic Dataa
Sample Lithology Latitude (N) Longitude (E) Elevation (m)
(U, Th)/He
Age (Ma) s.e. (1σ)
Apatite fission‐track
Age (Ma) s.e. (± 1σ) Apatite
Hakimi basin
TA100613A1 sandstone (Cr1) 38° 48.208′ 68°21.836′ 1,584 1.9 0.9 8.6 0.4
TA100613B1 sandstone (Cr1) 38° 46.977′ 68°21.237′ 1,507 n.a. n.a. 8.7 0.4
North‐central Tajik basin
TA100613D1 sandstone (Cr1) 38°42.009′ 68°22.053′ 1,098 6.2 1.6 10.4 0.7
TA100616B1 sandstone (Pg3‐N1; Baljuvon) 37°53.892′ 68°56.446′ 500 8.7 1.6 17.6 0.6
TA100616C1 sandstone (N1; base Khingou) 37°53.643′ 68°56.147′ 490 n.a. n.a. 24.8 0.9
TA100616D1 sandstone (N1; Khingou) 37°53.443′ 68°54.913′ 465 n.a. n.a. 24.6 1.0
TA100616E1 sandstone (N1; Khingou) 37°53.435′ 68°54.794′ 462 1.5 0.7 16.4 0.7
TA100621A1 sandstone (Cr1) 38°14.409′ 69°03.371′ 693 5.1 0.1 11.3 0.4
TA100621B1 sandstone (Cr1) 38°17.299′ 69°03.694′ 789 4.5 0.9 11.2 0.5
TA100622E1 sandstone (Cr1) 38°37.873′ 69°09.435′ 1,058 42.4 8.8 45.3 2.0
LG14 sandstone (Cr1) 38°20.885′ 68°58.342′ 865 n.a. n.a. 10.3 1.8
LG20 sandstone (Cr1) 38°28.169′ 68°33.804′ 823 8.7 1.0 10.6 0.9
LG22 sandstone (Cr1) 38°39.914′ 68°13.317′ 1,067 1.6 0.1 n.a. n.a.
LG25 sandstone (Cr1) 38°39.590′ 68°13.405′ 1,037 2.9 0.5 9.5 0.8
LG26 sandstone (Cr1) 38°20.463′ 68°45.243′ 1,342 8.0 1.2 n.a. n.a.
LG27 sandstone (Cr1) 38°06.670′ 68°36.836′ 1,643 n.a. n.a. 10.8 0.7
LG29 sand/siltstone (Cr1) 38°07.101′ 68°33.428′ 1,637 n.a. n.a. 7.5 1.7
LG32 sand/siltstone (Cr1) 38°24.873′ 68°41.224′ 833 10.6 0.6 n.a. n.a.
Northeastern Tajik basin and Darvaz zone
LG01 silt‐sandstone (Cr1) 38°51.070′ 70°06.900′ 1,367 1.6 0.4 6.6b 0.5
LG04 sandstone (Cr1) 38°50.438′ 70°09.118′ 1,422 n.a. n.a. 3.5 0.3
LG08 sandstone (Cr1) 37°56.705′ 70°06.104′ 915 1.0 0.4 n.a. n.a.
71092A sandstone (Pg3‐N1; Baljuvon),
lower section 38°53.738′ 70°24.350′ 2,371 n.a. n.a. 20.7b 1.3 71092B sandstone (Pg3‐N1; Baljuvon), middle section 38°53.675′ 70°24.371′ 2,289 n.a. n.a. 13.4b 1.1 71092C sandstone (Pg3‐N1; Baljuvon), upper section 38°53.536′ 70°24.448′ 2,269 n.a. n.a. 10.4b 0.6
Sedimentary cover of Uzbek Gissar
ULG08 sandstone (Cr1) 38°28.914′ 67°42.213′ 891 n.a. n.a. 9.9 1.1
ULG15 sandstone (Cr1) 38°34.977′ 67°34.635′ 1,589 5.9 0.4 9.1 0.6
ULG35 sandstone (Cr1) 38°32.648′ 67°33.391′ 1,255 4.1 0.5 9.4 0.8
ULG36 sandstone (Cr1) 38°32.690′ 67°33.391′ 1,266 n.a. n.a. 9.7 0.8
ULG43 black siltstone/shale (J2) 38°12.328′ 67°01.094′ 1,029 8.1 1.1 10.1 0.6
ULG47 sandstone (Cr1) 38°22.196 67°07.144′ 1,404 11.4 2.3 12.8 0.8
ULG50 sandstone (Cr1) 38°07.343′ 67°58.747′ 1,088 n.a. n.a. 7.4 0.7
ULG52 sandstone (Cr1) 38°35.604′ 68°52.734′ 1.002 n.a. n.a. 9.5 1.2
Cystalline basement rock of Uzbek Gissar
ULG11 meta‐conglomerate (C1t2 + v1) 38°30.174′ 67°40.286′ 951 223.1 86.7 8.1 0.6
ULG12 meta‐sandstone (C1t2 + v1) 38°30.541′ 67°38.991′ 999 n.a. n.a. 9.1 0.5
ULG13 paragneiss 38°32.015′ 67°38.154′ 1,204 9.9 0.9 10.1 0.4
ULG14 quartz‐rich micaschist 38°32.764′ 67°37.14′ 1,275 4.4 0.6 9.0 0.5
ULG16 orthogneiss 38°33.384′ 67°29.886′ 1,385 10.7 0.8 12.1 0.6
ULG17 leucogranite 38°35.049′ 67°26.701′ 1,521 n.a. n.a. 9.1 2.0
ULG18 amphibolite 38°35.033′ 67°26.531′ 1,567 n.a. n.a. 9.5 0.5
ULG19 felsic meta‐volcanic rock
(~350 Ma)
38°34.997′ 67°26.295′ 1,647 n.a. n.a. 10.2 0.7
ULG20 granitoid 38°34.866′ 67°27.186′ 1,509 n.a. n.a. 9.8 0.5
ULG22 granitoid 38°34.116′ 67°27.902′ 1,527 n.a. n.a. 9.6 0.7
ULG24 granitoid 38°33.654′ 67°28.629′ 1,440 n.a. n.a. 9.5 1.2
ULG25 Paleozoic metasandstone 38°33.399′ 67°29.045′ 1,423 n.a. n.a. 12.7 1.5
ULG26 Paleozoic paragneiss 38°33.116′ 67°30.78′ 1,321 17.8 1.3 12.0 0.6
ULG32 granitoid (~355 Ma) 38°31.814′ 67°35.413′ 1,155 9.3 0.9 9.9 1.2
ULG34 leucogratic gneiss 38°31.193′ 67°36.621′ 1,105 8.4 0.8 9.3 0.4
We performed AHe and ZHe measurements with the Patterson He‐extraction line at the Universität Tübingen, Germany, following the procedures summarized in Käßner et al. (2016); Text S3 provides a sum-mary. We picked clear idiomorphic grains free of inclusions, impurities, or cracks and measured their dimensions for calculating theα‐correction factors (Farley et al., 1996). Two to five single grains per sample were degassed, reheated, and remeasured to check for complete degassing. U, Th, and Sm were measured at the University of Arizona. We report the unweighted arithmetic mean and standard error of the grain ages as the AHe and ZHe sample ages and their uncertainties. Table S2 lists the AHe and ZHe data.
4. Results
Figure 3a presents a structurally interpreted geologic map of the Tajik basin and southwestern Tian Shan with the sample locations of the new and published (Chapman et al., 2017; Käßner et al., 2016; Jepson, Glorie, Konopelko, Gillespie, et al., 2018a; Jepson, Glorie, Konopelko, Mirkamalov, et al., 2018) thermochro-nologic data. Figure 3b shows the regional distribution of paleo‐temperatures, and Table S1 gives the results for the different stratigraphic horizons and regions. Overall, the temperatures follow the down‐depth trend: the paleo‐temperature values for the Cretaceous (Cr1 + 2) strata are 89°/103 °C (first and second numbers give
calculation after Barker & Goldstein, 1990 and Sweeney & Burnham, 1990, respectively) and 132/132 °C for the Early‐Middle Jurassic strata. In the Tajik basin, the values for the Cr2strata―103/108 °C―are close to
those of the Cr1strata (113/119 °C). The data from the Tajik Gissar―covering Jurassic rocks―are only
slightly higher (115/121 °C). Again, the values for the Cr2 (75/93 °C) and Cr1 (81/98 °C) strata of the
Uzbek Gissar are nearly identical but lower than those of the Tajik basin. The highest, albeit variable paleo‐temperatures (167/155 °C) occur in the Jurassic rocks of the Uzbek Gissar. The values (75/94 °C, Cr2 Table 1
(continued)
Sample Lithology Latitude (N) Longitude (E) Elevation (m)
(U, Th)/He
Age (Ma) s.e. (1σ)
Apatite fission‐track
Age (Ma) s.e. (± 1σ)
ULG38 aplitic gneiss 38°30.601′ 67°38.115′ 1,035 n.a. n.a. 8.3 0.5
ULG54 orthogneiss (~336 Ma) 38°53.089′ 67°17.592′ 1,567 n.a. n.a. 8.9 1.0
Basement spur at the western edge of the southwestern Tian Shan
ULG55 schist (C) 39°04.192′ 67°05.211′ 1,105 n.a. n.a. 79.5 6
ULG56 slate 39°15.48′ 66°54.890′ 1,053 n.a. n.a. 129.0 10.1
ULG57 granite (~302 Ma) 39°16.076′ 66°54.782′ 1,139 n.a. n.a. 109.8 3.5
ULG59 granite 39°16.653′ 66°55.203′ 1,349 n.a. n.a. 107.5 3.7
ULG60 granite (~295 Ma) 39°16.655′ 66°54.367′ 1,450 n.a. n.a. 110.1 4.3
ULG61 granite (~292 Ma) 39°16.832′ 66°54.371′ 1,542 101.7 6.9 109.1 3.8
ULG64 granite 39°18.335′ 66°55.715′ 1,462 n.a. n.a. 108.8 3.4
ULG65 granite 39°21.639′ 66°59.442′ 1,041 n.a. n.a. 106.1 4.1
ULG66 granite (~278 Ma) 39°25.171′ 66°01.592′ 961 n.a. n.a. 111.5 4.0
Darvaz‐Visharv Pamir
6817D1 meta‐andesite (C1)meta‐
andesite (C1)
38°14.405′ 70°32.545′ 1,115 n.a. n.a. 6.2 0.5
6908A1 paragneiss (?Early Paleozoic) 38°25.912′ 70°55.668′ 1,337 n.a. n.a. 7.8 0.4
11923G1 micaschist (?Early Paleozoic) 38°27.507′ 70°57.597′ 1,356 n.a. n.a. 10.3 0.6
Zircon Uzbek Gissar
ULG13 paragneiss 38°32.015′ 67°38.154′ 1,204 76.4 38.1 10.1 0.4
ULG32 granitoid (~355 Ma) 38°31.814′ 67°35.413′ 1,155 57.3 2.7 9.9 1.2
ULG34 leucogratic gneiss 38°31.193′ 67°36.621′ 1,105 75.8 20.0 9.3 0.4
ULG54 orthogneiss (~336 Ma) 38°53.089′ 67°17.592′ 1,567 96.8 9.7 8.9 1.0
an.a., not analyzed; Cr, Cretaceous; C, Carboniferous. bLGO1: age groups at 1.9 ± 0.6, 7.6 ± 1.1, 33.4 ± 7.6 Ma; 71092A: age groups at 4.9 ± 0.9, 17.9 ± 1.9,
strata; 113/119 °C Lower‐Middle Jurassic strata) are relatively low along the margin to the Pamir (Darvaz range).
Figures 3c and 3d show attempts to derive paleo‐geothermal gradients for the Uzbek Gissar and the Tajik basin, respectively. For the estimate visualized in Figure 3c, we averaged the paleo‐temperature values from the Cr1‐Cr2 and Lower‐Middle Jurassic rocks and used the detailed strata‐thickness measurements of Figure 4. (a and b) Apatite (U, Th)/He (AHe) ages plotted against apatitefission‐track (AFT) ages for the Tajik basin and the Uzbek Gissar. (c) AFT age versus elevation plot for the eastern and (d) middle and western subblocks of the Uzbek Gissar. (e) AHe age versus elevation plot for the eastern subblock of the Uzbek Gissar. (f and g) Weighted mean temperature‐time (T‐t) paths of the AFT thermal history models in Figure S4. (h) 90% contours of the T‐t path node densities of all good‐fit thermal histories, highlighting where cooling‐rate changes occur (see Text S2 and Figure S4 for details). The blue contours relate to the age scale at bottom and the magenta ones to that at top. I T‐t paths for the Tajik Gissar samples. The gray sectors in (f), (g), and (i) represent the AFT partial annealing zone; the pinkfields indicate rapid cooling.
Rubanov et al. (1963). Based on our thermochronology (see below), we assumed that burial reversed to uplift and erosion at ~12 Ma, that is, the middle Miocene, thus giving a minimum of overburden, because sedimentation likely continued in synclines and away from growing anticlines; furthermore, we assumed that average surface temperature was at ~15 °C. We derived maximum paleo‐geothermal gradients of ~39 °C/km for the Cretaceous‐Jurassic section, ~23 °C/km for the Cretaceous‐Miocene section, and ~28 °C/km for the Jurassic‐Miocene section (Figure 3c); given the variable Jurassic paleo‐temperature estimates, a 25–30 °C/km value may apply for the Uzbek Gissar. For the Tajik basin, industrial seismic sections (Gągała, 2014) allow the identification of the boundary between the preorogenic and synorogenic strata and the strata thickness to the Cr1‐Cr2 (on surface) sampling sites at several locations; the
Tajik‐basin gradient was at ~25 °C/km (Figure 3d).
The paleo‐temperature estimates of the Lower‐Middle Jurassic strata of the Uzbek Gissar are―with the exception of one outlier―>110 °C. Therefore, the AFT and AHe samples from these strata and the under-lying crystalline basement rocks experienced a reset of their preexisting age record; they trace the youngest cooling event. The average paleo‐temperatures of samples collected around the Cr1‐Cr2boundary scatter
between ~75 and 125 °C; as a rule, higher values occur in the Tajik basin (115–125 °C) than the Uzbek Gissar (75–100 °C; Table S1). The thermochronologic sample localities in the Cr1 clastic rocks are Figure 5. (a) Kafirnigan cross section through the Tajik basin and Uzbek Gissar simplified from Gągała et al. (2020) with paleo‐temperature values derived from the Sweeney and Burnham (1990) calibration, and new and published apatitefission‐track (AFT) and (U, Th)/He (AHe) ages projected along strike onto the section. (b) Section across the eastern Uzbek Gissar based on detailed mapping; location is farther south than section in (a) to best show the faults and subblocks of Figures 3f and 3g discussed in the text. For cross‐section lines see Figure 1b. Our new age data and those of Käßner et al. (2016) are in dark blue (AFT) and red (AHe); those of Chapman et al. (2017) and Jepson, Glorie, Konopelko, Gillespie, et al. (2018a) are in light blue (AFT) and magenta (AHe) and smaller font size.
stratigraphically ~0.5–1.0 km deeper, which implies ~10–30 °C higher temperatures. If so, the Cr1
Tajik‐basin rocks were reset, while those from the Uzbek Gissar may have been reset fully or partially. Figures 3e to 3g present maps with the regional ZHe, AFT, and AHe age distribution; the AFT ages are color‐coded to emphasize age ranges. Table S2 details the AFT‐age and mean track‐length data. Figure S2 presents radial plots (Galbraith, 1990) of the apatite single‐grain ages. Table S3 lists the He, U, Th, and Sm concentrations and single‐grain parameters, and Figure S3 plots the single‐grain AHe ages against their equivalent uranium concentrations (eU) and grain widths. We used the data in Figure S3 and Table S3 to detect outliers (bold in Table S3), which were not included in the mean AHe‐age calculations. Figures 4 com-pares the AFT and AHe ages (Figures 4a and 4b), plots the AFT and AHe ages versus elevation (Figures 4c to 4e), shows T‐t modeling results (Figures 4f to 4h), and compares these with the results of Käßner et al. (2016) for the Tajik Gissar and Jepson, Glorie, Konopelko, Mirkamalov, et al. (2018) for the Kyzylkum‐Nurata seg-ment of the northwestern‐most Tian Shan (Figures 1b and 4i). Figure S4 shows the track‐length distributions and full modeling solutions of our samples. Data Set S1 in the supporting information compiles the dates of Jepson, Glorie, Konopelko, Gillespie, et al. (2018a) for the Garm massif of the Tajik Gissar, and Jepson, Glorie, Konopelko, Mirkamalov, et al. (2018) for the basement spur at the western edge of the southwestern Tian Shan, which overlap with our ages; for completeness, it also includes the dates of Chapman et al. (2017) for the Tajik basin. In Figure 5, we projected the paleo‐temperature and thermochronologic data along strike into simplified versions of the Kafirnigan and Tavildara cross sections of Gągała et al. (2020); the section of Figure 5b details the structures and ages in the eastern Uzbek Gissar. In general, the youngest AFT ages occur east of the present margin of the Tajik basin in the westernmost Pamir and along the leading edge of the Pamir thrust system—the Vakhsh thrust—of the northeastern Tajik basin, where it narrows between the converging Tian Shan and Pamir. The Vakhsh anticlinorium in the east‐central part of the Tajik basin and, in particular, the Darvaz fault zone and the Pamir thrust system yielded the youngest AHe ages (Figures 3e, 5a, and 5c).
The new AFT ages in the north‐central Tajik basin, along its northern margin, and in the Hakimi basin of the Tajik Gissar, range from ~45.3 to 7.5 Ma (Figure 3e and Table 1). Figure S2 shows that the single‐grain ages of the four samples from the Neogene rocks are consistent with their sample ages (Table 1; ~24.8–16.4 Ma, median = 21.1 Ma). The sample ages are somewhat higher than or close to the upper limit of the depositional age range (three samples from the Khingou Formation with a stratigraphic age of ~18–12 Ma and one sample from the Baljuvon Formation with a stratigraphic age of ~28–18 Ma; see discussion on the difficult stratigraphic age assignment for these Formations in Klocke et al., 2017 and Dedow et al., 2020). The single‐grain ages of the samples from the Cr1rocks are also consistent with their
sample ages. These samples have much lower ages (~11.3–7.5 Ma; median = 10.4 Ma; n = 10) than their stra-tigraphic age, which implies postdepositional resetting. Their ages are also much lower than the AFT ages of the Neogene rocks, suggesting that these were not reset. The only outlier―TA100622E1―was sampled just south of basement rocks at the northern margin of the Tajik basin (Figure 3e); its ~45‐Ma AFT age is inter-mediate between its stratigraphic age and the exhumation age of the other samples from the Cr1
rocks (~10.4 Ma).
Two AFT ages from Cr1rocks in the hanging wall of the Vakhsh thrust in the northeastern Tajik basin are
~6.6 and 3.5 Ma (Figures 3e and 5c; Table 1). Whereas sample LG04 has single‐grain dates consistent with its sample age (~3.5 Ma), sample LG01 (~6.6 Ma) contains two single‐grain dates that overlap the depositional age; the remaining dates may define age peaks at ~1.9 (33% of the population), 7.6 (53%), and 33.4 Ma (14%) (Figure S2). The youngest age peak of LG01 (~1.9 Ma), sampled just south of the thrust front, is little older than the AHe age of this sample (~1.6 Ma). Three samples (71092A–C) of upper Oligocene‐lower Miocene Baljuvon‐Formation (stratigraphic age of ~28–18 Ma) rocks from the southward overturned limb of a huge anticline cored by a salt ridge (Figure 5c) have single‐grain dates both older and younger than the strati-graphic age, indicating partial resetting (Figure S2). The youngest age peaks of all three samples (~4.9– 3.9 Ma, comprising 28–55% of the population) may represent fully reset ages; they are only slightly older than the age from the Cr1strata (LG04, ~3.6 Ma) in the syncline closer to the thrust front (Figure 5c).
The 26 sample ages from the Uzbek Gissar (both sedimentary cover and crystalline basement rocks) cover ~12.8–7.4 Ma (median = 9.6 Ma; Figure 3e and Table 1). Those from the basement spur at the western edge
of the southwestern Tian Shan are distinctly older: ~129–80 Ma (median = 109 Ma, n = 9); the youngest is farthest south and in the hanging wall of a thrust emplacing basement onto Neogene rocks.
The AFT ages are older than the corresponding AHe ages, except for ULG11 and ULG26 (Figures 4a and 4b). We consider the AFT ages of these two samples more reliable because they agree with the rest of the AFT samples, and discard the AHe ages, which do not. In addition, the individual grain AHe ages of ULG11 differ by an order of magnitude, and the ~223‐Ma mean age is even older than the ZHe ages from this region (see below). Eleven AHe ages within the north‐central Tajik basin, along its northern margin, and in the Hakimi basin range from ~10.6 to 1.5 Ma (median = 6.2; Figure 3e and Table 1). TA100622E1 (~42 Ma) is—as it was the case for the AFT age—much older than the other samples. Young AHe ages―LG08 (1.0 Ma) and LG01 (1.6 Ma)―occur along the Darvaz fault zone in the easternmost part of the Tajik basin, and—as mentioned above—at the frontal thrust of the Pamir thrust system (Figures 3e and 5c). Ten AHe ages from the Uzbek Gissar range from ~11.4 to 4.1 Ma (median = 8.5 Ma). The four ZHe ages from this region range between ~97 and 57 Ma (Table 1).
The number of samples and elevation ranges within a single thrust sheet are too small for estimating exhu-mation rates from age‐elevation data in the Tajik basin. Figures 4c to 4e show age‐elevation plots for three fault‐bounded blocks in the Uzbek Gissar (see Figure 3g for their definition). Although there are several samples per block, the small elevation ranges and the considerable horizontal distances between the samples negate the use of age‐elevation relationships. Other factors that we cannot assess thoroughly, for example, burial by synorogenic strata in synclines or by local thrusting during exhumation, invalidate or modify the results. We show them for completeness of analysis, but the derived exhumation rates are at best order‐of‐magnitude estimates. The rates calculated from error‐weighted regressions, assuming ±20‐m uncertainties on the GNSS‐derived elevations, are ~0.7, 0.3, and 0.4 mm/year for the eastern, middle, and western block, respectively. Only the eastern block provided enough AHe ages for calculating an exhuma-tion rate (Figure 4e). Two age groups can be distinguished: Samples with AHe ages between ~4.1 and 5.9 Ma give an exhumation rate of ~0.2 mm/year, those with AHe ages between ~8.4 and 9.9 Ma give ~0.1 mm/year. The former estimate is consistent with the values calculated from the offset between the AFT and AHe ages (0.2–0.6 mm/year, for a geothermal‐gradient range of 20–30 °C/km and 1.3–2.0 km dif-ference in the depth of the closure paleo‐isotherm). The exhumation‐rate estimate for the older group gives rates >1 mm/year, as expected given the small offset between the AFT and AHe ages of these samples; the much lower rate estimate (~0.1 mm/year) from the age‐elevation relation is therefore deemed questionable due to the small elevation difference between the samples. Taking all AFT and AHe ages (~2.5‐Ma age dif-ference) from all blocks of the Uzbek Gissar yields 0.5–0.8 mm/year of exhumation.
Figures 4f and 4g show the mean T‐t paths for the modeling solutions in Figure S4; Figure 4h displays 90% contours of the T‐t‐path node densities, highlighting cooling‐rate changes. The modeled samples are from the Uzbek Gissar (ULG13, 16, 18, 26, and 34; ~12.1–9.3 Ma), the basement spur at the western edge of the southwestern Tian Shan (ULG60, 61, 64, and 66; ~112–108 Ma), and the Pamir east of the Tajik basin (6908A1 and 11923G1; ~7.8 and 10.3 Ma; Table 1). Two T‐t‐path groups are apparent: The samples from the basement spur cooled through the AFT partial annealing zone (PAZ) between ~160 and 130 Ma were reheated to ~80–60 °C between ~40 and 15 Ma and cooled to surface temperature from ~10 Ma onward. The samples from the Uzbek Gissar entered the PAZ at ~1311 Ma; ULG13, 16, and 34 then cooled through the PAZ between ~11 and ~2 Ma; ULG18 cooled to surface temperature from ~11 Ma onward. Both groups experienced accelerated cooling since ~10 Ma. These T‐t paths contrast with that of sample ULG26 (~12.0 Ma) from the Uzbek Gissar and those of the two western Pamir samples (6908A1, ~7.8 Ma; 11923G1, ~10.3 Ma); they apparently cooled through the PAZ before ~10 Ma, reentered the PAZ until ~2 Ma, and cooled rapidly to surface temperature (Figure 4g). The AHe age of ULG26 is unreliable (see above) and thus not helpful for evaluating the T‐t path. The data from the closest neighboring sample ULG16 (Figure 3g) show a distinctly different T‐t path (see above) and an AHe age (~10.6 Ma) incompatible with the ULG26 path. In contrast, the AHe age (~1.0 Ma) from the easternmost Tajik basin is compatible with the T‐t paths of the adjacent Pamir samples. The two Cr1samples with track lengths from the Tajik
basin have too few tracks for T‐t path modeling. Sample TA100621A1 (~11.3 Ma) has a mean track length (~13.4μm, n = 13) identical to the length of the Uzbek Gissar crystalline basement samples. Sample LG04 (~3.5 Ma) from the Pamir thrust front has a shorter mean track length (~11.6μm, n = 23). Both mean
lengths are larger than the partially reset Cr1sample TA100622E1 (~10.7μm) and the partially reset upper
Oligocene‐lower Neogene sample 71092B (~8.3 μm).
5. Discussion
We set out to extend the“northward indentation‐westward flow” tectonic model of the active deformation field at the northwestern tip of the India‐Asia collision (Kufner et al., 2018; Schurr et al., 2014), to investigate its onset and duration, and to integrate the tectonics of the Pamir, Tajik basin, and southern Tian Shan. In the following, we address three questions: (1) When were the Tajik basin and the southwestern Tian Shan inverted to form the thin‐skinned Tajik FTB and its thick‐skinned foreland buttresses? (2) Is there a time progression? (3) How were inversion of the Tajik basin and shortening in the Tian Shan coupled with the hinterland—the Pamir?
5.1. Onset and Duration of Shortening in the Uzbek and Tajik Gissar and Inversion of the Tajik Basin
Severalfirst‐order observations result from the ages and the distribution of the ZHe, AFT, and AHe ages across the present structure of the Uzbek Gissar. First, the ~97‐ to 57‐Ma ZHe ages in the Uzbek Gissar refer to a closure temperature of ~140–180 °C (Reiners et al., 2004), using the estimated pre‐Cenozoic cooling rates of 0.01–10 °C/Myr (Käßner et al., 2017). This implies that Cenozoic burial did not reheat the apatites far above their AFT PAZ temperatures. Second, and foremost, the AFT ages are relatively uniform despite being distributed over a thickness interval of up to 5 km in the thrust sheets that define the western and eastern subblocks (Figure 5b). This indicates that the sampled depth intervals passed through the AFT PAZ nearly simultaneously, constraining the onset of inversion to≥12.8 Ma—the oldest AFT age (range of all data ~12.8–7.4 Ma, median = 9.6 Ma; Figures 3e, 5a, and 5b). The samples in the core of the anticlines of the east-ern and westeast-ern subblocks were the deepest and hottest (Figure 5b). Their ages young downward (toward the core of the anticlines), becoming as young as ~8.1 Ma; they likely postdate the onset of thrusting. The AHe ages can be divided in an older (~11.4–8.4 Ma) and a younger (~5.9–4.1 Ma) subset. The older AHe ages are close to the AFT ages and indicate rapid (>1 mm/year) exhumation to ~2‐ to 3‐km depth soon after the onset of shortening. The younger AHe ages occur in the syncline in the footwall of the major thrust in the western part of the eastern subblock (fault A in Figure 5b). Deposition of sediments in the syncline likely formed a—now eroded—piggyback basin. There, the AFT ages (~9.7–9.1 Ma) thus again date cooling due to thrusting and erosion and set a minimum age for the onset of shortening. The reheating or slowing of the long‐term exhumation/cooling rate might explain the large offset between the AFT (~9.7–9.1 Ma) and AHe (~5.9–4.1 Ma) ages in this syncline (Figure 5b).
Four samples from the Uzbek Gissar have AFT ages≥12 Ma (Table 1). One, from the Cr1sedimentary cover
of the Uzbek Gissar, is the oldest (ULG47, ~12.8 Ma); it likely projects into the western subblock (Figure 5b). The other three are from the central subblock (~12.7–12.0 Ma, marked “C” in Figure 5b). These samples are ~1 Ma older than the other samples from the Uzbek Gissar and the oldest samples from the Tajik basin. Characteristically, the mean track lengths of these samples (ULG16: ~12.1μm, n = 68; ULG26: ~9.9 μm, n= 43) are shorter than those of the younger samples (~13.3–12.8 μm, three samples, n = 97–116). The older samples could have been within the AFT PAZ, and today part of a fossil PAZ. This would explain both their older ages compared to the other samples and their shorter mean track lengths. This would also reconcile the problem that a full reset of the Cr1sample ULG47 is unlikely, given the ~83/60 °C (depending on the
cali-bration) paleo‐temperature for the close‐by Cr2 vitrinite sample ULG48. The implication―that the
≥12 Ma ages overestimate the onset of shortening―is appealing: if so, the ages from the Uzbek Gissar, Tajik Gissar, and the Tajik basin (see below) all together suggest an ~12‐Ma age for the onset of shortening and erosion.
The AFT and AHe samples from the Tajik basin are from Cretaceous and upper Oligocene‐lower Neogene sandstones. All ages of the Cretaceous samples were reset, while those from Oligocene‐Neogene samples are not or partly reset (Figure S2 and Table S2). This agrees with the vitrinite‐reflectance paleo‐temperatures (~106/115 °C, average of the Cretaceous samples, depending on the calibration). The Cr1clastic rocks sampled for thermochronology are situated stratigraphically ~0.5–1.0 km deeper than the
were reset and cooled through the PAZ immediately after the onset of thrusting and erosion. The relative uniform AFT ages (~11.3–7.5 Ma, median = 10.4 Ma) of the Cr1samples across the north‐central Tajik basin
indicate that inversion started at ~12 Ma, likely more or less simultaneously along all structures (Figures 3e and 5a). The oldest AHe ages (~10.6–8.0 Ma) are only slightly younger, implying exhumation to ~2‐ to 3‐km crustal depths within a few Myr. The two AFT ages from Cr1rocks in the hanging wall of the Vakhsh thrust
in the northeastern Tajik basin are much younger, ~6.6 and 3.5 Ma (Figures 3e and 5c and Table 1), consis-tent with the high seismicity and the ~15‐mm/year GNSS‐derived shortening rates across this dextral‐reverse fold‐thrust system (Ischuk et al., 2013; Kufner et al., 2018). The reason for the presence of clusters in the single‐grain dates of sample LG01 (pooled age ~6.6 Ma) at ~1.9 (33% of the population), 7.6 (53%), and 33.4 Ma (14%) is unclear but may reflect incomplete resetting and compositionally variable apatite grains. The youngest age peak of LG01 (~1.9 Ma), sampled just south of the thrust front, and likely comprising fully reset grains, is little older than the AHe age of this sample (~1.6 Ma). These young ages likely reflect the active syntectonic erosion of the evaporite‐soled deformation front of the Tajik FTB along the Vakhsh thrust by the Surkhob longitudinal trunk stream (cf. Pavlis et al., 1997), with the older AFT age in the imbricate closer to the hinterland (LG04, ~3.5 Ma; Figure 5c).
The AFT and AHe ages, ~10.4–8.6 and ~6.2–1.6 Ma, respectively, in northern Tajik basin and western Tajik Gissar indicate a similar age for the shortening/erosion‐induced cooling for these areas than for the north‐central Tajik basin (south of the Ilyak fault zone; Figure 3e). As Käßner et al. (2016) outlined for the Tajik Gissar farther east, the southwestern Tian Shan is an integral part of the Pamir deformationfield, dominated by dextral transpression. Together with the Ilyak fault zone, it constitutes the northern thick‐skinned foreland buttress of the thin‐skinned Tajik FTB (Gągała et al., 2020; Kufner et al., 2018). Similar ages and structures (Figures 1c and 3a) extend this zone along‐strike to the west. The old AFT (~45 Ma) and AHe ages (~42 Ma) of sample TA100622E1 can be understood in connection with the data of Käßner et al. (2016). The basement block of the Tajik Gissar adjacent to the Tajik basin yielded AFT ages between ~86 and 6 Ma and AHe ages between ~26 and 5 Ma, indicative of partial Cenozoic resetting. TA100622E1 traces the same signal that delineates a relatively rigid block, moderately deformed and exhumed during the Neogene (Figure 3e; Figure 4 in Käßner et al., 2016).
We interpret the unreset AFT ages (~24.8–16.4 Ma) of the upper Oligocene‐middle Miocene samples from the north‐central Tajik basin (TA100616B1–E1) as the detrital signal of the Central and South Pamir. There, crustal thickening and accompanying erosion peaked at ~23–20 Ma, followed by tectonic denudation forming the extensional gneiss domes (section 1; Hacker et al., 2017; Rutte, Ratschbacher, Khan, et al., 2017). The upper Oligocene‐middle Miocene Baljuvon and Khingou Formations of the north‐central Tajik basin thus possessed a drainage network extending deep into the Pamir with a short lag time between exhumation, erosion, and deposition. In contrast, the three samples (71092A–C) of upper Oligocene‐lower Miocene Baljuvon‐Formation rocks of the Pamir thrust system of the northeastern Tajik basin (Figures 3e and 5c) have single‐grain AFT ages both older and younger than the stratigraphic age. The youngest age peaks of all three samples (~4.9–3.9 Ma, 28–55% of the population) may represent fully reset ages; they are only slightly older than the age from the Cr1strata (LG04, ~3.6 Ma) in the syncline closer to the thrust front
(Figure 5c). Together these ages imply young shortening/focused erosion along the Pamir thrust system, consistent with the narrowing of the Tajik basin to its northeast.
Käßner et al. (2016) obtained AFT and AHe age ranges of ~238.6–11.2 Ma (median = 21.2 Ma) and ~19.2– 8.0 Ma (median = 15.0 Ma), respectively, from the crystalline basement rocks of the Tian Shan foreland but-tress immediately north of the Vakhsh thrust; Jepson, Glorie, Konopelko, Gillespie, et al. (2018a); see discus-sion of their data in section 5.2) reported AFT ages that span ~18.3–6.1 Ma and one AHe age at ~11.6 Ma for the southern edge of the Garm massif, east of the study area of (Käßner et al. (2016); Figures 3e and 5c). These AFT and AHe ages from the southern rim of the Tian Shan foreland buttress are mostly from a fossil partial annealing/retention zone and imply vastly different amounts of shortening and exhumation on both sides of the Vakhsh thrust. Both the difference in the cooling ages (~10 Ma; Figure 3e) and in the strati-graphic thicknesses of the fully preserved Cretaceous‐Oligocene stratigraphic sections across the Vakhsh thrust (~700 m to its north and ~2,500 m to its south; Burmakin et al., 1961; Gągała et al., 2020) imply that different parts of the Tajik basin have been juxtaposed across this thrust front. This supports Pavlis et al. (1997) model of large‐scale evacuation of rocks from the thrust front by river erosion.
Our T‐t models for the basement spur at the western edge of the southwestern Tian Shan indicate cooling through the AFT PAZ between ~160 and 130 Ma, followed by reheating to ~80–60 °C between ~40–10 Ma (Figure 4f). Käßner et al. (2016) reported similar, albeit more heterogeneous (~200–80 Ma) histories for parts of the Tajik Gissar (Figure 4i). Furthermore, Jepson, Glorie, Konopelko, Mirkamalov, et al. (2018) T‐t models for the Kyzylkum‐Nurata segment of the northwestern‐most Tian Shan—including the basement spur at its southeastern tip—indicate cooling through the PAZ between ~220–60 Ma, with a cluster between ~160 and 120 Ma (yellow paths in Figure 4i). Their only model that indicates reheating (between ~40 and 15 Ma) into the PAZ is from the basement spur, which also shows relative young ages, including an ~30 Ma date from farther east (Figure 3e). Also, parts of the Chatkal‐Kurama range north of the Fergana basin show this reheating (Jepson, Glorie, Konopelko, Gillespie, et al., 2018). Taking all data together, this suggests that the basement spur constitutes a relatively rigid block—shallowly buried and exhumed during the Cenozoic in comparison to the Tajik and Uzbek Gissar. The Jurassic‐Cretaceous cooling recorded in the wes-tern Tian Shan likely is the vestige of widespread crustal extension after the “Eo‐Cimmerian” (Norian‐Rhaetian) orogeny, best documented in Uzbekistan and Iran. Extension almost ceased at the end of the Middle Jurassic (~160 Ma), with only minor normal faulting recorded in Upper Jurassic and Cretaceous strata; this time was mostly characterized by thermal subsidence (e.g., Brunet et al., 2017; Fürsich et al., 2015; Mordvintsev et al., 2017). For the often cited trigger of the cooling by collisions at the southern margin of Asia (e.g., De Grave et al., 2012, 2013; Glorie et al., 2011; Jepson, Glorie, Konopelko, Gillespie, et al., 2018), we see no structural evidence in the studied areas. The Jurassic‐Cretaceous cooling was later superimposed by burial heating, evidenced by the stratigraphic record, peaking with the deposition of the synorogenic sediments from the rising Pamir (and Tian Shan) in the Oligocene and mostly Miocene. Unsurprisingly, subsidence and reheating were highest in the Tajik basin, diminishing north(west)ward, leaving a weak reheating signal in the basement spur at the western edge of the southwestern Tian Shan and none in the Kyzylkum‐Nurata segment of the northwestern‐most Tian Shan. Similarly, we interpret the ZHe ages from the Uzbek Gissar and the basement spur at the western edge of the southwestern Tian Shan as relicts of Jurassic‐Cretaceous events, partially reset by Cenozoic burial.
How can we interpret the different T‐t paths of samples ULG26 (Uzbek Gissar) and 6908A1 and 11923G1 (northwestern Pamir; Figure 4g)? We have found no meaningful interpretation for ULG26. On the one hand, the relatively high proportion of short tracks allows us to speculate about methodologic factors, that is, track‐etching or track‐measurement‐related issues; on the other hand, the fact that this sample is from the core of a fault zone hints at tectonic causes, for example,fluid flow along the fault. In the northwestern Pamir, the upper Miocene‐Pliocene sedimentary rocks of the Tavildara and Karanak Formations, and in par-ticular those of the Pliocene‐Pleistocene Polizak Formation, cover an erosional surface southeast of the Darvaz fault zone,filling bedrock topography (Klocke et al., 2017; Lyoskind et al., 1963own observations). This indicates a period of subsidence with transgression of the Tajik basin far onto the North Pamir interior. Burial by ~1 km of sediments could have caused the observed upper Miocene‐Pliocene reheating before either a renewed pulse of shortening or incision by the Panj River (headwater of the Amu Darya) exhumed the rocks to the surface. The preservation of these Formations at altitudes of 3.2‐ to 3.5‐km points to young regional uplift of the eastern Tajik basin and adjacent Pamir. On the one hand, the river incision interpreta-tion is appealing given the ~2 km of downcutting of the Panj River gorge. On the other hand, the young AHe age at a relatively high elevation along the Darvaz fault zone (Figures 3e and 5a) may favor out‐of‐sequence tectonic shortening at the basin margin.
5.2. Time Progression of Shortening
Chapman et al. (2017) published afirst set of AFT and AHe ages from the northern Tajik FTB. Are these data compatible with ours? Table S4 of Data Set S1 lists their ages, and Figures 3a, 3e, and 5a plot the sample loca-tions and ages together with ours. To make the two data sets comparable, we report Chapman et al.'s (2017) AFT ages as pooled ages, and the AHe ages as unweighted mean ages; this has little effect on the original data. As a pioneeringfirst study, Chapman et al.'s (2017) AFT thermochronology relies on a smaller database (see Tables S2 to S4). We also made small modifications to their AHe data set. In their fully reset Cr1sample
IS‐13‐04, we excluded one outlier, nearly twice as old as the rest of the single‐grain ages. In addition, we left out 1 order‐of‐magnitude older grain each from their two detrital (unreset) AHe samples from Neogene rocks; the remaining grains give a single age cluster for each sample (expressed as mean ages)
with a similar single‐grain age dispersion as the other (reset) samples. The coordinates likely place the Neogene samples into the Pliocene Karanak Formation (IS‐13‐07: ~7.6 Ma AHe age) and the middle to upper Miocene Khingou or Tavildara Formations (IS‐13‐06: ~11.2 Ma). Given the ~25 °C/km paleo‐geothermal gra-dient in the Tajik basin (Figure 3d),≥3 km of overburden is needed to reset the AHe system in these detrital samples. The ~7.6‐Ma mean age from the Pliocene (younger than ~5 Ma) sample is certainly from unreset apatites and the ~11.2‐Ma mean age from the Miocene Formations (~20–5 Ma) likely too. The rare AHe ages from the Pamir span ~12–8 Ma (Rutte, Ratschbacher, Khan, et al., 2017), the more abundant Tian Shan ages ~26–2 Ma (median = ~7 Ma; Käßner et al., 2016); therefore, both areas are possible source regions for the det-rital grain‐age clusters in these samples.
Combining Chapman et al.'s (2017) and our data, what can be said about the evolution of the inversion of the Tajik basin? The age variability, the young ages, the difficulty with working with detrital apatites, and the paucity―but not absence―of parameters supporting the interpretation, that is, our track lengths and inde-pendent paleo‐temperature information, demand a cautious interpretation of the entire thermochronologic database. Within uncertainty, Chapman et al.'s (2017) AFT ages from the Tajik basin and our study match, except for those from the Vakhsh anticlinorium, where theirs are half the age of our dates (Figures 3e and 5a). The age of sample 14‐03, from an antiform farther east in the anticlinorium, overlaps within uncertainty with our Vakhsh anticlinorium ages. Their two oldest AFT ages are 15.6 ± 3.7 and 14.6 ± 2.9 Ma from the western Kafirnigan anticlinorium and the 12.2 ± 2.5 Ma age from the easternmost antiform of this anticli-norium overlaps with ours. Given the uncertainties of Chapman et al.'s (2017) ages―all including 12 Ma―and the consistency of our ages and their match with our ages from the Uzbek and Tajik Gissar, we conclude that none of their ages is older than ~12 Ma, thus consistent with ourfindings. The thermochro-nologic data thus indicate the simultaneous onset of inversion of the Tajik basin and the shortening in the Uzbek and Tajik Gissar (Käßner et al., 2016).
In addition, the oldest AHe ages (~12–8 Ma) of Chapman et al. (2017) match ours. The small age difference between the AFT and AHe ages imply that some thrusts show large displacements early in the inversion his-tory (Figure 5a); in particular, this is the case for the Kafirnigan anticlinorium, for which Gągała et al. (2020) obtained the largest amount of shortening of any structure in the Tajik FTB. Furthermore, several thrust sheets, in particular those bounding the central depression of the Tajik basin and the Darvaz fault zone, have matching young AHe ages, suggesting reactivation. Given that growth strata indicate that also the eastern Tajik FTB started to shorten before ~11 Ma (Dedow et al., 2020; Gągała et al., 2020), the clustering of young AHe ages in the eastern Tajik FTB (Vakhsh anticlinorium to eastern Pamir margin) suggests that the young Tajik FTB reactivation is concentrated there. The scarcity of young reactivation in the Uzbek Gissar indicates that after regional synchronous initiation, shortening concentrated in the Tajik basin, where the evaporitic décollement facilitated thin‐skinned deformation; this is particularly true for the eastern Tajik basin, where the widespread and thick salt has enabled related tectonics (e.g., Gągała et al., 2020; Nikolaev, 2002). The reactivation of the Tajik Gissar (with AHe ages as young as ~1.6 Ma) emphasizes its incorporation into the recent deformationfield (Käßner et al., 2016; Schurr et al., 2014).
With six AFT dates and one AHe date, Jepson, Glorie, Konopelko, Gillespie, et al. (2018a) addressed the Cenozoic exhumation of the southern edge of the Garm massif. We recalculated their laser ablation‐inductively coupled plasma‐mass spectrometry AFT ages (Data Set S1 and Table S5), using a cor-rected single‐grain data sheet provided by the authors, the decay constant 8.46 × 10⁻¹⁷a−1(instead of 7.03 × 10⁻¹⁷a−1; Browne & Tuli, 2015; Holden & Hoffman, 2000), and a R‐factor (half of the mean etchable spontaneousfission‐track length) of 7.5 μm (instead of 7.0 μm; Hasebe et al., 2004); this makes their ages younger. Five of their AFT ages are ~12.8–6.1 Ma, consistent with Käßner et al.'s (2016) ages that are not part of a fossil PAZ (their Figure 5). One sample (Gm‐21) dated at ~18.3 Ma has shorter confined tracks than the younger samples, suggesting that it is part of a fossil PAZ, as most of Käßner et al.'s (2016) ages. Their single AHe sample (Gm‐19) provided ~11.6‐ and 23.7‐Ma ages for two aliquots, both older than the AFT age of the same sample. Based on one T‐t model, Jepson, Glorie, Konopelko, Gillespie, et al. (2018a) contested the model of tectonic quiescence and burial between ~150 and 15 Ma based on seven T‐t models in Käßner et al. (2016) and supported by another four models herein for the southwestern Tian Shan (Figures 4f and 4i). Jepson, Glorie, Konopelko, Gillespie, et al. (2018a) also reported a negative correlation between the ages and the uranium contents of their dated grains (their Figure 4). A possible explanation is either an