Publisher’s version / Version de l'éditeur:
Vous avez des questions? Nous pouvons vous aider. Pour communiquer directement avec un auteur, consultez la première page de la revue dans laquelle son article a été publié afin de trouver ses coordonnées. Si vous n’arrivez pas à les repérer, communiquez avec nous à [email protected].
Questions? Contact the NRC Publications Archive team at
[email protected]. If you wish to email the authors directly, please see the first page of the publication for their contact information.
https://publications-cnrc.canada.ca/fra/droits
L’accès à ce site Web et l’utilisation de son contenu sont assujettis aux conditions présentées dans le site LISEZ CES CONDITIONS ATTENTIVEMENT AVANT D’UTILISER CE SITE WEB.
RTO-TR-AVT-080 - Vortex Breakdown over Slender Delta Wings, pp. 2-1-2-40,
2009-10
READ THESE TERMS AND CONDITIONS CAREFULLY BEFORE USING THIS WEBSITE.
https://nrc-publications.canada.ca/eng/copyright
NRC Publications Archive Record / Notice des Archives des publications du CNRC : https://nrc-publications.canada.ca/eng/view/object/?id=5b97b232-c5f5-4f86-ad81-dfd11201a05d https://publications-cnrc.canada.ca/fra/voir/objet/?id=5b97b232-c5f5-4f86-ad81-dfd11201a05d
NRC Publications Archive
Archives des publications du CNRC
Access and use of this website and the material on it are subject to the Terms and Conditions set forth at
Critical assessment of test cases on vortex breakdown over slender
delta wing under static model conditions
Xing Zhong Huang
Institute for Aerospace Research National Research Council
1200 Montreal Rd.
Ottawa, Ont. Canada K1A 0R6
ABSTRACT
A critical assessment of more than thirty test cases on leading-edge vortex breakdown has been conducted. The test cases contain test data obtained on more than eighty wing configurations at high angles of attack and static model conditions. Special attention has been paid to related test conditions, such as model geometry, model blockage, model deformation under aerodynamic loads, wind tunnel wall and model support interference, the methodologies used in the experiments and the definition of vortex breakdown location. A screening process has been performed to help identify the relative merits of the various data sets and to extract reasonable confidence and quantitative information from the scattered database. This synthesized information is helpful to assess and validate numerical results.
List of Symbols
a speed of sound in air
b bevel width
c wing chord
c0 wing chord along the centre-line of the wing
h height of a forward-facing step
M Mach number,
a
V
M
=
r blockage, tion test wings
s
r
sec 30 , ==
αRec Reynolds number based on chord,
ν
c
V
⋅
=
cRe
Rex Reynolds number based on length,
ν
x
V
⋅
=
xRe
swing, a=30 wing projection area from front at α=30˚
V velocity or flight speed
x flat plate length in stream-wise direction
RTO-TR-AVT-080 2 - 1
Chapter 2 – CRITICAL ASSESSMENT OF TEST CASES ON
VORTEX BREAKDOWN OVER SLENDER DELTA
xVB vortex breakdown location in ratio with wing centre-line chord, xVB = XVB/c0
XVB distance to vortex breakdown location measured along wing centre-line chord
α angle of attack
δ half bevel section angle
δ∗ boundary layer displacement thickness
∆max difference between measured most downstream vortex breakdown location and mean vortex
breakdown location
∆min difference between measured most upstream vortex breakdown location and mean vortex
breakdown location
Λ angle of leading edge sweep
λ ratio of bevel dimension to boundary layer displacement thickness, *
δ
λ
=
b
σ standard deviation
µ0 viscosity of air
ν kinematic viscosity of air
ρ air density
2.1 INTRODUCTION
The tactical advantage of high maneuverability and agility has been the incentive for designers of fighter aircraft to continually expand the flight envelope of their designs. For such aircraft, slender or delta–type wings are often selected in order to gain extra aerodynamic force and control power while maintaining a compact structure over weight advantage. Modern combat aircraft routinely operate at high incidence and/or high angular rates, under which the flow field is usually dominated by strong leading-edge vortices, and where loss of controllability may be encountered.
In general, the flow over the delta wing surface may experience four different statuses of separation as the angle of attack increases. At low angle of attack there is no flow separation from the leading edge. The attached flow induces a leading-edge suction, which can be predicted from slender wing theory. As the angle of attack increases, depending on the leading-edge shape, flow separation starts to occur on the leading edge and progresses downstream as the second status of separation. A further increase of the angle of attack results in the third status: the formation of curved free shear layers and the vortex. The free shear layers roll up periodically into discrete vortical substructures. The substructures wind up spatially into a core over the leeward side of the wing forming a so-called leading-edge vortex. Further increasing the angle of attack leads to the last status: breakdown of the leading-edge vortex core. When breakdown occurs over a wing surface, it causes a sudden lift loss and a severe non-linearity in the aerodynamic loads.
Apart from non-linearity, vortex breakdown also causes a time dependence of aerodynamic loads. As a consequence, linear or local-linear aerodynamic models are no longer valid at flight conditions where vortex
CRITICAL ASSESSMENT OF TEST CASES ON VORTEX BREAKDOWN OVER SLENDER DELTA WINGS UNDER STATIC MODEL CONDITIONS
breakdown occurs. Due to the lack of sufficient understanding of the flow physics and of reliable data sets, predictive capabilities have largely lagged behind operational requirements. A better insight into the vortex behavior, in particular vortex breakdown, is an essential requirement for developing CFD solutions and analytical models capable of adequately capturing the flow behavior in the advanced maneuvering regime. For these reasons, for the past five decades, the behavior of leading-edge vortices, with special attention to vortex breakdown, has been the subject of a considerable number of experimental investigations as well as analytical and computational studies. On this subject, at least twenty theoretical and review articles were devoted.1-20 However, due to difficulties inherent to vortical-flow experiments, measurements traditionally tended to produce qualitative rather than quantitative results. Furthermore, experimental results obtained on identical wings were seldom satisfactorily duplicated when tested in different facilities, with even relatively simple measurements of the vortex breakdown locations showing little correlation. Significant discrepancies are found in the data obtained by different investigators. Geometric variations, different test conditions, model deformations under aerodynamic loads, as well as differences in measuring techniques, significantly affected some measured results and contributed to the lack of correlation to the observations reported by others. A reliable assessment of the data generated in ground tests remains one of the most vexing problems to be solved in order to satisfactorily design military aerial vehicles and validate CFD codes. Thus, an evaluation of the existing experimental data sets was imperative so that the extensive work already performed at a very high cost could be properly used in the design of new military aerial vehicles and the development of analytical and computational models.
As vortex breakdown phenomena have important influences on aircraft performance, this paper attempts to extract as much useful and quantitative information as possible from critical examinations and correlations of existing data sets on vortex breakdown locations.
2.2 RESULTS ON MEASURED VORTEX BREAKDOWN LOCATIONS
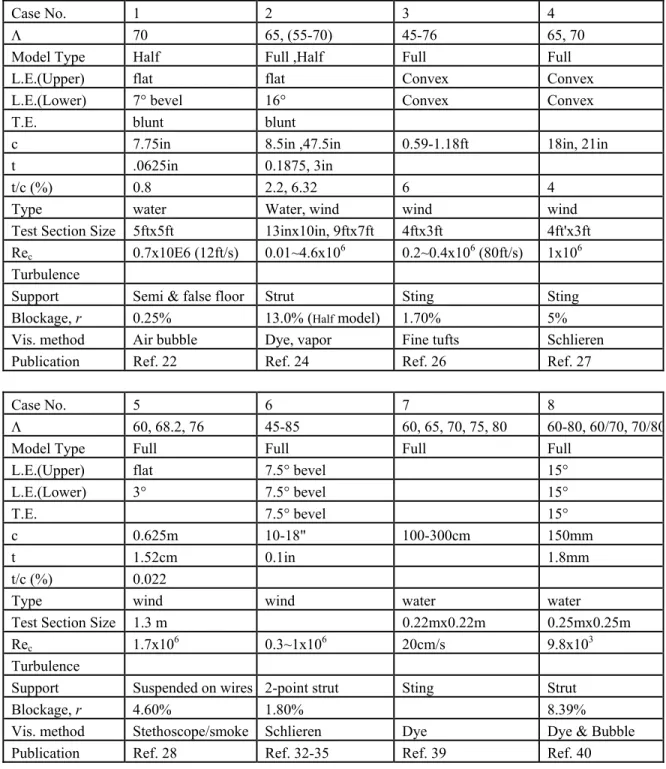
A brief, but by no means complete, survey of published results for the time-averaged primary vortex breakdown locations over delta wings at static model conditions with leading edge sweep angles (Λ) ranging from 50º to 80º is depicted in Figs. 1 to 7. It is worthwhile to mention that most experimental results have not been corrected for wind/water tunnel wall and support interference effects and other test related effects. In order to facilitate further investigations, the model(s), test facilities and conditions of the referred test cases are listed separately in Table 1. As the 65° and 70° sweep delta wings are typical and closely related to high-performance military aerial vehicles, most attention has been paid to results reported for these two angles of sweep.
For Λ = 65° and 70°, the preliminary comparisons shown in Figs. 4 and 5 reveal significant differences in the measured non-dimensional breakdown location, xVB = XVB/c0, where XVB is the distance from the apex to the
measured vortex breakdown location and c0 is the centerline chord. For Λ = 65° and α = 22.5°, for example,
xVB can be anywhere, from the trailing edge xVB = 1.0 (Earnshaw26, 27) to xVB = 0.4 (Lambourne & Bryer24).
Similar scatter is found in the measurements on 70° delta wings. At α ≈ 31°~32°, the measured breakdown location varies from xVB≈ 0.8 (Earnshaw & Lawford, et.al.26, 27) to xVB ≈ 0.35 (Wentz & Kohlmann33-35).
Finally, for Λ = 70°,and α ≈ 31°~32°, one data set (Wentz & Kohlmann33-35) exhibits a “knee’, reflecting a
rapid, possibly discontinuous movement of the breakdown location from mid-chord to aft of the trailing edge over a small change in the angle of attack. The large scatter in the measured vortex breakdown locations and
CRITICAL ASSESSMENT OF TEST CASES ON VORTEX BREAKDOWN OVER SLENDER DELTA WINGS UNDER STATIC MODEL CONDITIONS
the possible presence of the discontinuity leads to different understanding and explanations101,109,112. This uncertainty will also jeopardize any attempt to model the vortex breakdown behavior.
Given that the vortex breakdown is basically an unsteady, non-linear and time dependent process, some uncertainty in the measurements of the breakdown location is to be expected. Furthermore, the effects of the proximity of wind tunnel walls and support geometry, model blockage and model deformations under the aerodynamic loads increase the scatter in the measurements. These effects unavoidably degrade the consistency of results. In addition, the experimental data given in the reports also depend on the criteria and the methodology used to define the breakdown location, e.g. whether a laser sheet is orientated normal to or along the vortex axis, seeding injection method, Schlieren system set-up and experimental accuracy. All of these considerations complicate the assessment.
On the other hand, it has been found that in a given investigation, the breakdown location can be very stable with high repeatability if the test conditions are well maintained 92, 112, 126. As examples, Fig. 8 depicts the standard deviations, σ, as well as maximum and minimum deviations, ∆max, ∆min, of the breakdown location
for a 75° delta wing112 at Re
c = 1.5x10⁴, while Fig. 9 shows Mitchell’s126 results conducted at Rec = 1.56x10⁶
for a 70° delta wing. Those figures clearly show that the deviation of breakdown location is small, although a slightly increased scatter in the data can be observed when the breakdown location occurs over the aft part of the model. Lowson & Riley90 repeated the experiments of Wentz & Kohlman33 and Lambourne & Buyer24 and found Wentz & Kohlman’s data to be repeatable if the models and test conditions were accurately reproduced.
2.3 CRITERIA OF THE ASSESSMENT
In the author’s opinion, the fundamental issue for assessing the data sets is not which data sets are “good” or “bad” but what kind of data sets are necessary, suitable or representative to certain flow conditions. The assessment in this paper is mainly a filtering process for screening the available data. In principle, the sources of discrepancies for the same normalized model geometry in different experiments could result from facility-related or simulation-related sources. The former include free-stream conditions (such as flow non-uniformity, angularity, unsteadiness and noise), wall and support interference and test condition repeatability. The later include Reynolds number based on c0, Mach number and differences in detail model
dimensions, i.e., the shapes of leading edges, trailing edges, fairings and centre-bodies. Those sources will be investigated as much as possible so that the process will lead to a better reconciliation of the different results. The assessment consists of the following main steps:
a) Collect as many data as possible relating to vortex breakdown. Pay more attention to the described test conditions.
b) Weigh the accuracy of those data in terms of the quantitative or qualitative information about the test conditions.
c) Normalize the various data sets into “equivalent” delta wings having sharp leading edges and a flat upper surface by relying on the well accepted assumption that for a delta wing with a flat upper surface and sharp leading-edges, xVB is independent of Reynolds number. Correct for Reynolds
number effects on other leading-edge shapes such as leeward bevels and rounded edges.
d) For the data sets with many parameters, preference is given to the data sets where a minimum number of other parameters is varied.
CRITICAL ASSESSMENT OF TEST CASES ON VORTEX BREAKDOWN OVER SLENDER DELTA WINGS UNDER STATIC MODEL CONDITIONS
e) As different experiments employed different leading-edge shapes and centerbody settings, clarification of these effects is the prerequisite for the assessment.
2.4 EFFECTS OF LEADING-EDGE SHAPE, CENTERBODY AND DIFFERENT
TEST CONDITIONS
2.4.1 Leading-Edge Shape Effect
Since boundary layer separation initiates from the leading-edge (where the vorticity flux inside the boundary layer is transported to the free shear layer and eventually rolls up into a vortex) then leading-edge shape may affect the vorticity flux and the effects of leading-edge geometry have to be considered.
Basically there are two kinds of leading-edge: sharp and round. A leading edge is defined as “sharp” if the boundary layer separation line coincides with the junction line of the upper and the lower wing surfaces and if the separation onset is fixed and at the apex of the wing. A leading edge is defined as “round” if, the separation line is not fixed and the onset of the separation is also not from the apex. Furthermore, with a round leading edge, both the separation line and the separation onset will move depending on the flow conditions.
Kegelman & Roos60, Pelletier91,93, Huang112,136,140, Luckring100-103,132,135,139, Wentz and Kohlmann34 conducted experiments while Pirzadeh141 applied CFD methods to investigate the effect of leading-edge shape on vortex behavior or vortex breakdown.
For a sharp leading-edge, the effect of leading-edge bevel may lead to changes in effective angle of attack. If the bevel size is large enough, as a first approximation, the following equation for modifying the effective angle, ∆α, at static model conditions and at high Reynolds number, may apply76, 82, 87.
∆α=tanΛ∗cosδ (1)
However this equation can only be used conditionally. For example, the results of Kegelman and Roos60 show that the change in effective angle of attack is only 1/3 of the value predicted by the above equation. In contrast, the water tunnel experiments of Pelletier91,93 and Huang114 exhibit negligible difference in xVB
between different leading-edge shapes. Likewise, Wentz & Kohlmann’s 34 results of breakdown location for a 60° delta wing with either beveled or square leading edges are very similar. On the other hand, the studies of Hanff and Huang104 and Huang, Mebarki and Benmeddour140 at high Reynolds numbers with large leading-edge bevels show that the breakdown locations are almost 20% farther downstream than others’ on models with small size leading-edge bevels. This change is equivalent to a decrease of 4º in effective angle of attack. Similar information can be found from airloads and pressure measurements. Huang136 and Huang et al.140 reported that the measured normal force exhibits two discontinuities: one corresponding to vortex breakdown near the trailing edge and one corresponding to breakdown at the apex. These references show that for a delta wing with a bevelled leading-edge, the latter discontinuity appears on the angle of attack 4º higher than that with a flat upper surface (Fig. 10a and Fig. 10b) indicating the effective angle of attack on the bevelled wing model may be 4º less than that with the flat upper surface wing model.
From the above discussion it follows that equation (1) cannot be applied in isolation without considering other additional factors. One important fact appears to be the ratio, λ, of the size of the bevel (e.g. bevel width, b) to the thickness of the boundary layer in the vicinity of separation, δ*. Thus,
CRITICAL ASSESSMENT OF TEST CASES ON VORTEX BREAKDOWN OVER SLENDER DELTA WINGS UNDER STATIC MODEL CONDITIONS
*
δ
λ
=
b
The breakdown location, xVB, varies directly with λ. It can be imagined that if λ << 1, the bevel acts as local
or minor disturbance while the large flat upper surface, which is downstream of the bevel, will be the geometric feature that has a global effect on the flow. Actually, in the experiments of Wentz & Kohlmann111 and Pelletier91,93, λ was 1/15 and 1/7 of that in the experiments of Hanff & Huang104, explaining the negligible bevel effect in the former as compared to that in the latter. The water tunnel experimental results reported by Huang114 with λ > 1 also confirm that if the bevel on the leeward side is large enough it will delay the vortex breakdown. The reduction in angle of attack is close to the value estimated from equation (1).
In order to quantitatively analyse the effect of relative size of the leading-edge bevel, λ, on the flow, it is worthwhile to look at typical permissible surface discontinuities that may have negligible effect on boundary layer flow. Braslow et al.61 found the allowable forward-facing step height, h, for a flat-plate in a laminar boundary-layer and a zero pressure gradient is roughly:
ft R 1800 ) ft (
h ≈ , where Rex/ft is the Reynolds number per foot.
For a Reynolds number of Rex = 1x10⁶/ft, the typical permissible surface discontinuity is roughly h =
0.025in, while the boundary layer displacement thickness, δ*
, on a 2-D flat plate can be determined from Blasius profile141: 0
72
.
1
* u x νδ
=
where u0 is the velocity in the free stream, x is the length of the plate and ν is the kinematic viscosity.
At this Reynolds number (i.e. Rex = 1x10⁶/ft) and the chordwise location (x), δ*, is estimated to be 0.06in.
From the two numbers, h and δ*, in the example, it can be concluded that if λ is approximately less than 0.4,
the disturbance caused by the surface discontinuity may be neglected.
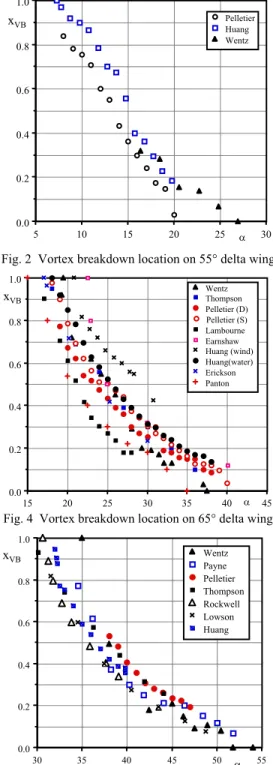
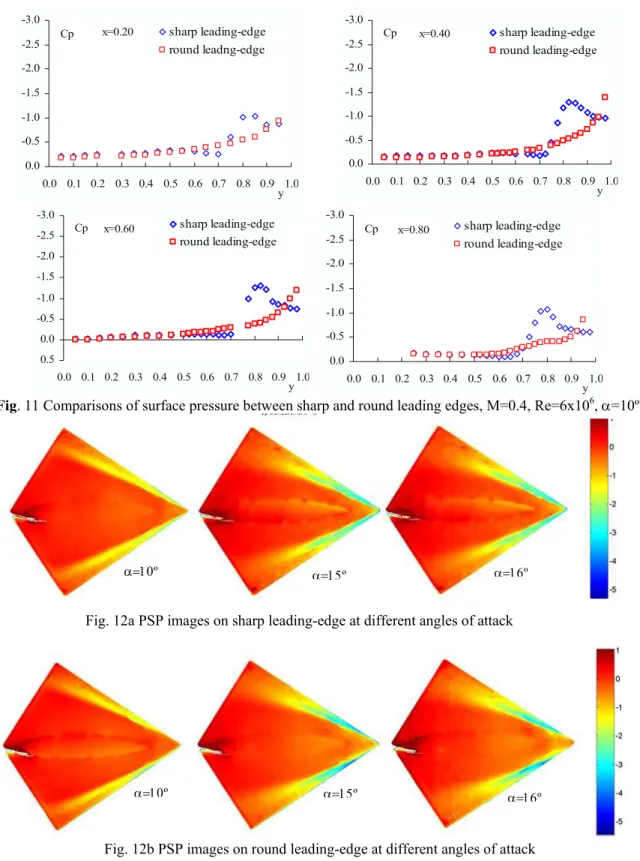
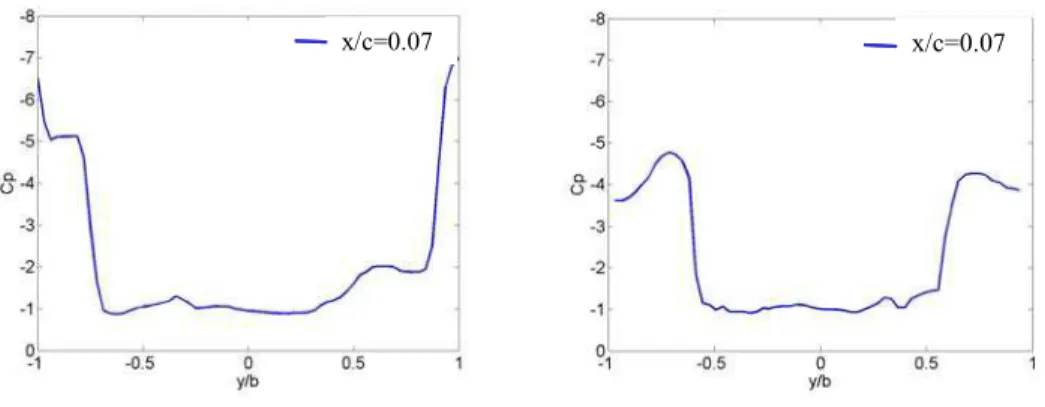
For a round leading-edge, if the relative bevel size, λ, is relatively small, the above analysis may still be valid and the effect of the rounded leading-edge shape could be ignored. However for relatively large size of rounded leading-edge, the experiments of Huang136, which examined the normal force, show similar results between wings with bevelled and rounded leading-edges, indicating the difference of time-averaged vortex breakdown locations between those wings might be small. However, it does not mean that the vortex behavior is similar. Luckring132,135,139 and Huang et al.140 conducted experiments respectively to investigate the leading-edge shape effect on the flow behavior at high Reynolds numbers. Luckring applied very dense pressure orifices while Huang et al. applied PSP technology as well as pressure orifices to study the pressure distribution and related airloads. Huang et al.140 also digitized the PSP images to obtain the pressure distribution along different lines, either at different chordwise locations or at different conical lines starting from the apex. As examples Luckring’s results for the comparisons between a sharp and round leading-edge delta wing at M=0.4, Re=6x10⁶ and α=10º are shown in Fig. 11, while Huang et al.’s PSP images, digitized pressure distributions along different lines on the PSP images are illustrated in Fig. 12 to Fig. 14. Luckring’s and Huang et al.’s results at different chordwise locations clearly show that for a rounded leading-edge the attached flow pressures are apparent in the forward potion, while leading-edge vortex-like pressures appear
CRITICAL ASSESSMENT OF TEST CASES ON VORTEX BREAKDOWN OVER SLENDER DELTA WINGS UNDER STATIC MODEL CONDITIONS
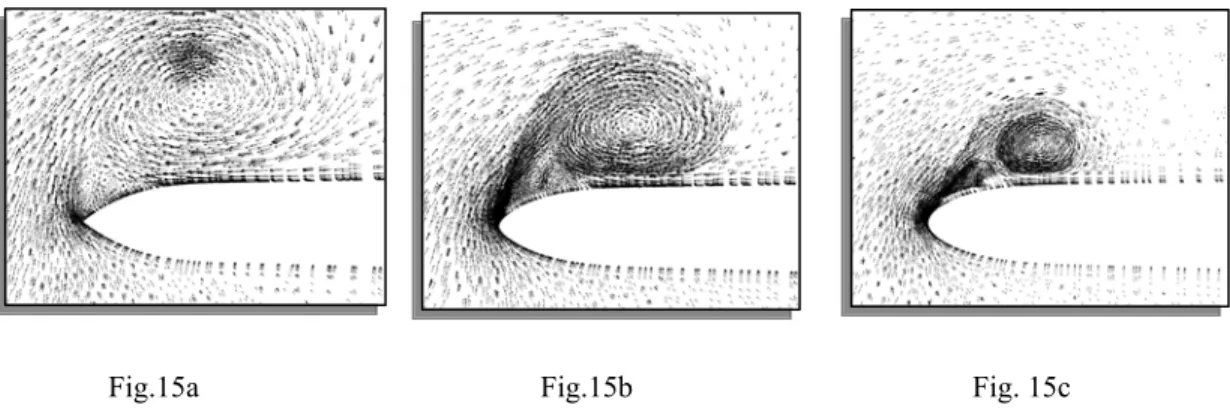
in the rear potion. The separation onset or the origin of the leading-edge vortex on a rounded leading-edge is not at the apex but somewhere downstream of the apex. The PSP images in Fig. 12a exhibit that for sharp leading-edge the high suction area (blue area) is conical and originates from the apex, while for a rounded leading-edge the suction area is not conical (Fig. 12b). The enlarged PSP images in the forward part (Fig. 12c) show that the blue line in the forward part is very close to the edge, indicating the attached flow induced leading-edge suction in that area. The digitized spanwise pressure distributions clearly show the attached flow induced suction along the round leading-edge (Fig. 13). The digitized pressures along a conical line on a sharp leading-edge or along a line (shown in the figure) are shown in Fig. 14. It appears that the suction peak is further upstream and stronger on a round leading-edge than that on sharp and beveled leading-edge. Pirzadeh142 applied Navier-Stokes solutions on three leading-edge cases. His results show quite different flow behavior between sharp and rounded leading-edges. As examples, Fig. 15a to Fig. 15c show the velocity vectors on cross-sectional planes at the mid-root-chord station. These Figures clearly show that the size as well as the height of the primary vortex decreases as the radius of the leading-edge increases. Although as he pointed out that the accuracy of vortex flow computations, especially those featuring vortex breakdowns, is highly susceptible to the local grid resolution, and vortex flows induced by blunt leading-edge present an even greater challenge to CFD, such as turbulence models, flow transition, and other numerical elements that influence the accuracy of predicted flow separation, nevertheless the comparison is physically acceptable.
From the above analysis, the following conclusion may be drawn:
a) The leading-edge shape may not cause a significant effect on vortex breakdown location if the size of the different shapes is relatively small.
b) If the size of leading-edge shape is relative large compared to the thinness of the boundary layer, the effect of leading-edge shape on the vortex can not be ignored and the amount of the effect depends on the shape of the leading-edge.
c) For large size, sharp and beveled leading-edges equation (1) may be used to approximately modify the effective angle of attack and corresponding vortex breakdown location.
d) For large size but rounded leading-edge, there appears attached flow in the forward part and the attached flow induced suction is very close to the edge area. The separation line and its onset are not fixed and are dependent on the test conditions. The corresponding vortex breakdown location, in general, will be downstream of that obtained with a flat upper surface but close to that with a beveled and sharp leading-edge.
2.4.2 Centerbody Effects
In many experiments, a centerbody was inevitably required to house the balance and/or the model’s support. Also a centerbody is commonly used in unmanned combat aerial vehicle (UCAV). Since a centerbody is different from a forebody, investigation of centerbody effects is not only of interest in assessing the experimental data but it can also be useful in the design of the new UCAV and similar aerial vehicles. A centerbody is usually located aft of the leading-edge and in the separation zone. As a result, its effect is even more difficult to analyse than that of forebody.
Pelletier91, 93, Huang114, and Huang et al.140 investigated centerbody effects in wind tunnel or in water tunnel experiments by comparing the results with and without centerbody in the experiments. Huang’s results
CRITICAL ASSESSMENT OF TEST CASES ON VORTEX BREAKDOWN OVER SLENDER DELTA WINGS UNDER STATIC MODEL CONDITIONS
conducted in a water tunnel at a Reynolds number Rec≈1.5x10⁴ shows that the centerbody effect on vortex
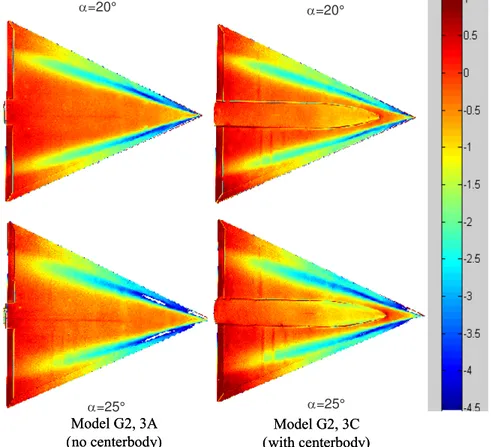
breakdown location is negligible except when the vortex breakdown location is near the trailing edge. This may be caused by the sudden expansion of the flow at the end of the centerbody. Similar trends can be found in the experiments of Pelletier91,93 and Huang140 where the Reynolds numbers are 1.5x10⁵ and 2.4x10⁶ respectively. The PSP and pressure orifice experiments of Huang140 conducted at higher Reynolds numbers (Rec≈2.4x10⁶) are shown from Fig. 16 to Fig. 17. Huang’s pressure orifice measurements at different
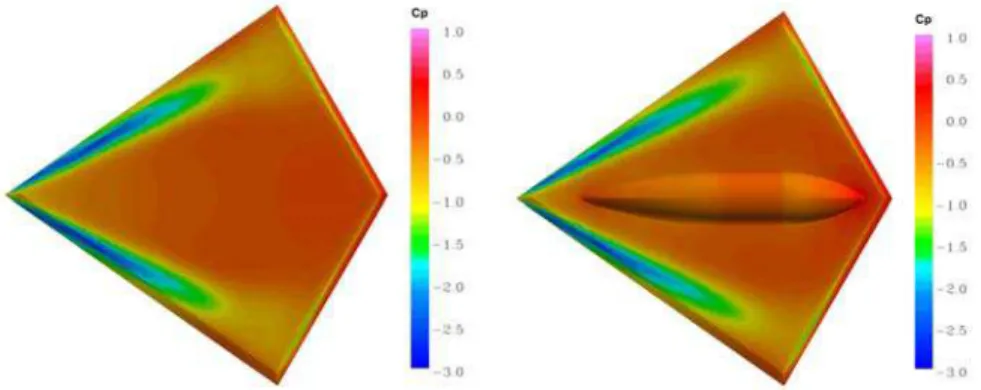
chordwise locations with and without a centerbody show that the centerbody only causes a local effect and no global effect is observed. Other than those experimental results, Benmeddour, Mebarki and Huang148 conducted numerical studies with and without centerbody148. They applied the in-house solver, FJ3SOLV, and the commercial software, CFD-FASTRAN, to calculate the effect of the centerbody on the surface pressure over a 65° delta wing and a 55° diamond wing. Their CFD results are shown in Fig. 18 to Fig.21. In general, their CFD results agree with experimental results. It may be concluded that a centerbody, with the size and shape as in the these studies, has negligible global effects on the aerodynamic characteristics.
2.4.3 Reynolds Number and Mach Number Effects
It is well accepted that with a sharp leading-edge the vortex breakdown location is approximately independent of Reynolds number. The time averaged pressure distribution is also less affected by the Reynolds number as shown by Luckring139 (Fig. 22). However, the amount of unsteadiness in the vortex depends on the Reynolds number. This unsteadiness may cause oscillations in vortex core location, vortex breakdown location and interactions between the left and right vortices. Thus, the measured time-averaged locations of vortex core and vortex breakdown may be nearly the same, but the time-dependent value and the asymmetry of the two vortices will depend on the Reynolds number, thereby resulting in increased scatter in the measurements and even bifurcation when tested at higher Reynolds number.
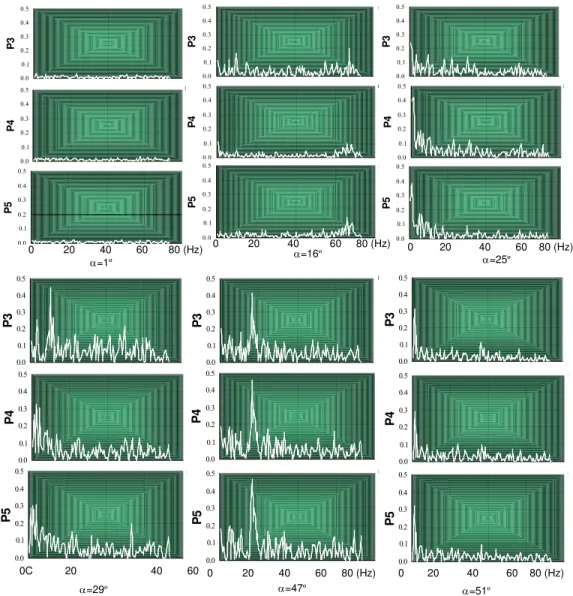
The Reynolds number related unsteadiness in the vortex comes from many sources. First, depending on the Reynolds number, the vorticity within the boundary layer may transport discontinuously into the free shear layer. Second, the Reynolds number will affect the type of Kelvin-Helmholtz (K-H) instability. At high Reynolds number, discrete and small-scale vortices appear and follow a helical trajectory around the core resulting in another source of unsteadiness. Thirdly, when a vortex breaks down at high angle of attack, at high Reynolds number there is ample unsteadiness within the breakdown region. This gives the flow in the vicinity of the spiral a spatial and temporal periodicity. Finally, at high Reynolds number, there exists a strong axial and related spiral fluctuation in the vortex breakdown location. The time history of breakdown location consists of low-frequency, large-amplitude fluctuations and high-frequency, low-amplitude fluctuations. As examples Huang144 presents pressure spectral measurements conducted at high Reynolds number which show that there is a peak at low frequency when vortex breakdown moves over the wing area (Fig. 23).
The above facts show that the Reynolds number effect may not cause too much effect on time-averaged vortex breakdown location over a delta wing with a sharp leading-edge, but the time-dependent behavior will be much affected by the Reynolds number.
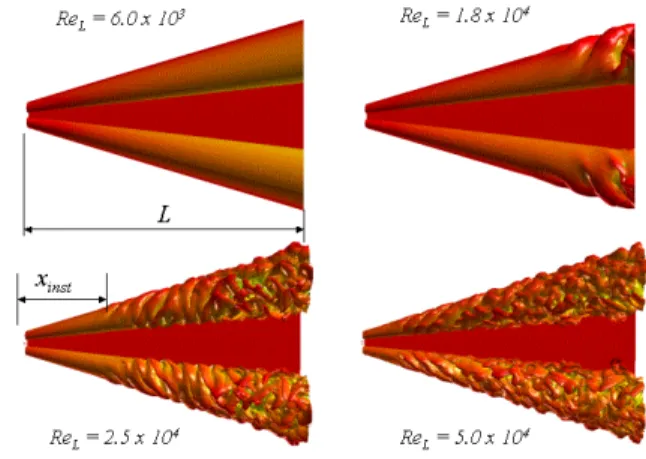
In order to understand Reynolds number effects on the unsteadiness of the vortex, the unsteadiness at different Reynolds numbers has been the focus of extensive research. Some examples are shown below. Results from experimental and computational studies regarding the effect of Reynolds number on the free shear layer are shown in Fig. 24 and Fig. 25 to Fig. 26 by Lowson58, 117 and Visbal92, 97 respectively. They found that at low Reynolds number the free shear layer is laminar. As Reynolds number increases, the free shear layer transitions from laminar to turbulent at somewhere along the leading-edge. Visbal further found
CRITICAL ASSESSMENT OF TEST CASES ON VORTEX BREAKDOWN OVER SLENDER DELTA WINGS UNDER STATIC MODEL CONDITIONS
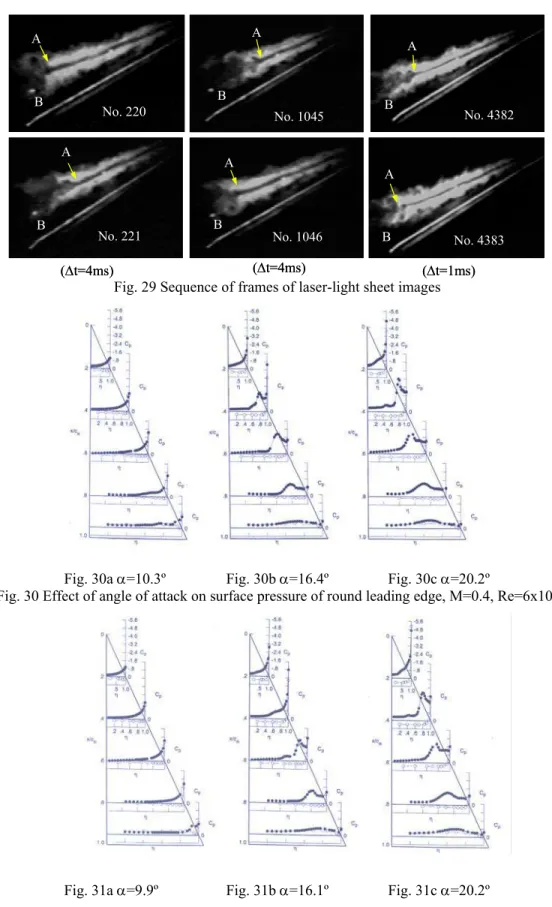
that the transition progresses toward the apex as Reynolds number increases further (Fig. 25 and Fig. 26). The instantaneous azimuthal vorticity distribution in a plane passing through the vortex axis obtained by Rockwell 88 is show in Fig. 27. Gursul95 measured time histories of breakdown locations which are illustrated in Fig. 28. Huang used high speed visualization method to study the unsteadiness inside the vortex breakdown at high Reynolds number (Rec0=3.6x10
6
). Following Lambourne’s29 description of vortex breakdown, in Fig. 29 Huang112,142 denoted the vortex filament kink point as “point A” while the vortex breaks down into large scale turbulence as “point B”. Huang found that the unsteady behaviors of points A and B are quite different. As examples sequence of frames of the images are shown in Fig. 29. In the sequence, point A moves in excess of 0.1c0 while point B remains more or less stationary. The speed of
response of point A corresponds to half convection speed, i.e. 0.5V∞cosα, whereas point B barely moves at all. Thus if the kink point is defined as the vortex breakdown location as in most of researchers’ measurement, the fluctuation of point A will deteriorate the measurements. On the other hand, if the point B is taken as the vortex breakdown location as Huang and Hanff82 did in a section view of laser-smoke sheet normal to the vortex axes, the breakdown location will be 0.1 c0 downstream of the point A which is defined
as breakdown location by others’ experiments.
For a round leading-edge, the Reynolds number effect is more complex. As mentioned above there is attached flow in the forward part of the leading-edge followed by leading-edge vortex like flow in the aft. Luckring’s results 132, 135, 139show that the attached flow area increases as the angle of the attack decreases (Fig. 30). Also, increasing Reynolds number will expend the attached flow area (Fig. 31). However it is worthwhile to mention that this only happens at a certain range of angle of attack. At a small angle of attack where the attached flow is weak or at high angle of attack where the vortex flow dominates, the Reynolds number effect is small. This can be drawn from comparing Fig. 30 with Fig. 31 at different angles of attack. Similar to the Reynolds number effect, the free stream turbulence intensity will also affect the experimental results. As the turbulence intensity increases, the unsteadiness in the vortex and vortex breakdown also increase, which will affect the measured results in experiments.
As for the effect of Mach number, Luckring100-103,132, 135, 139 has conducted comprehensive experiments on surface pressure. For a sharp leading-edge at small angle of attack, where the vortex flow is weak, the effect of Mach number is minor (Fig. 32). However at high angle of attack, where the vortex flow is stronger, profound Mach number effects can be found in the forward part of the wing (Fig. 33). For a round leading edge, an increase in Mach number will reduce the attached flow area and increase the vortex flow area (Fig. 34). Thus at transonic speed the difference between a round and a sharp leading-edge will become smaller as Mach number increases. The flow will, most likely become leading-edge vortex like flow (compare Fig. 35 with Fig. 11).
2.5 ASSESSMENT FOR THE RESULTS WITH 65º DELTA WING
With those pre-analysis in hand and applying the above mentioned criteria to the results of 65° sweep delta wings, especially for those with large scatter, it was found that:
a). Lambourne & Buyer’s24 experiments were conducted in water tunnel and wind tunnel with a flat upper and bevelled 16º on the lower surface. The ratios of the wingspan to the relevant tunnel span were 61% and 41% resulting in the blockages of 13% and 7.2% for water tunnel and wind tunnel respectively. Moreover the thickness reached t/c0=6.3% in the wind tunnel, the highest value among
other tests. Although it is not known exactly how much they should be corrected, Weinberg’s35 results
CRITICAL ASSESSMENT OF TEST CASES ON VORTEX BREAKDOWN OVER SLENDER DELTA WINGS UNDER STATIC MODEL CONDITIONS
show that the increases of model thickness and blockage could promote vortex breakdown by as much as 20% of centerline chord (i.e., move closer to the wing apex).
b). Earnshaw’s26, 27 resultswere obtained with a model with t/cr=4% and symmetrical cubic curve section.
According to the equation of the model surface, the section half angle (normal to the leading-edge) at the leading-edge is 14.2°. As the bevel width is comparable with the thickness of the boundary layer before separation, the bevel effect corresponds to a decrease in the effective angle of attack. If the average slope is taken in Earnshaw’s experiment, the effective angle of attack could be reduced by as much as 3°.
c). Hanff & Huang’s70-72, 77, 82, 87 early experiments were conducted at the Rec0≈ 3.6x10⁶ in two different
wind tunnels using different model supports. The blockage of the wing model at α=30° is 1.8% and 1.4% for two wind tunnels respectively. The data were repeatable and the differences of the results obtained from two facilities were minor. In the experiments, breakdown location was found by means of a laser sheet normal to the vortex axis and determined by a blurring of the vortex ring. This criterion is consistent with Lambourne’s29 definition for spiral vortex breakdown. Subsequent tests by Huang and Hanff105 with a laser sheet containing the vortex axis showed the location measured by the criteria to be approximately 10% of centerline chord downstream of the kink point. Moreover, as the experiments were conducted at high Re number resulting in the bevel size relatively larger than the thickness of the boundary layer in the vicinity of the separation area. Thus a 4° angle of attack correction due to leading-edge bevel was proposed by Hanff and Huang 104. Taking the correction into account, the modified data are close to their later experiments 114conducted in the water tunnel. d). Pelletier’s91, 93 experiments were conducted in 2ft by 2ft wind tunnel with the models similar to Hanff
& Huang’s104 and Huang’s136 models but half size, c0=14in, t/c=1.8% and at Rec0 ≈ 1 x10⁵. The
blockage is 7.9% at α=30°. Smoke was injected into the free stream near the apex of the model through two small smoke ports. The vortex breakdown was determined by the kink point in the top view. The single-bevel wing has a flat upper surface and bevelled 45º on the lower surface. The double-bevel wing has a symmetric 20º bevel inclusive which is identical to the wing tested by Hanff and Huang 70, 82,104. The difference in vortex breakdown locations between the two wing models is less than 5%. The bevel effect on the vortex breakdown location is negligible which agrees with above analysis as the ratio of bevel size to the size of the boundary layer thickness is much smaller than that in the case of Huang and Hanff’s experiments.
e). The experiments conducted by Addington and Cipolla’s 119, 107 were similar to the model in Huang and Hanff‘s experiments. In the former, the experiments were conducted in 2ft by 2ft wind tunnel at Re=2.9x10⁵ while in the later the experiments were conducted in water tunnel at Re=32400. Vortex breakdown was visualized by dye injection from ports on the upper surface near the apex. Their results at α=30º and φ=0º falls closer to Huang’s114 water tunnel results.
The original data sets have been assessed and correlated into a delta wing with flat upper surface by the above approach as shown in Fig. 34 which exhibits less scatter and more confidence than in Fig. 4. Further, if we assume a normal probability distribution, the normalized mean value representing time-averaged vortex breakdown location over 65º delta wing with flat upper surface can be obtained as shown in Fig. 35. The R-squared value is 0.96 for the measured results. With 95% interval of confidence based upon the standard deviation (σ) of the results, the true mean for the time-averaged breakdown location is given by
σ ± = vb ν 95,
vb x t
x
CRITICAL ASSESSMENT OF TEST CASES ON VORTEX BREAKDOWN OVER SLENDER DELTA WINGS UNDER STATIC MODEL CONDITIONS
where xvbis mean value shown in Fig. 35, tv,95 is Student’s t value and σ=σ N.
The largest precision interval is of the order of 4% at α≈30º.
2.6 ASSESSMENT OF THE RESULTS WITH 70º DELTA WING
In the case of the 70° delta wing, in addition to a scatter similar to that of the 65° wing, a discontinuity movement of the breakdown location in the aft of the wing was observed in Wentz & Kohlman’s33-35 results. Both of them have to be further investigated.
a). Wentz & Kohlmann’s33-35 experiment employed a wing model with non-dimensional thickness (thickness/root chord) t/c0 = 0.007, nearly an order of magnitude less than that in others’ experiments.
Owning to a 7.5° bevel on the lower surface, the model was further exacerbated on the forward part. Thus the effect of the aeroelastic deformation on vortex behavior has to be considered. The deformation under the reported test conditions in Wentz & Kohlmann’s35 test (q=30 psf) was estimated by the finite element method where the loading was based on the reported breakdown locations, xVB, at the trailing edge, xVB=1, and at xVB=0.4 for α≈29° and 30° respectively. The calculated deflections are large and their effects can not be ignored (see Fig. 36 and Fig. 37). Specifically, at α≈30° the wing has a negative camber with 1.3° deflection angle at the apex while at α≈29° it exhibits a positive camber over most of wing area. In light of the above, it follows that when α decreases from 30°, initially the negative camber will result in a premature vortex breakdown. As α decreases, the vortex breakdown location begins to move downstream. That movement redistributes the load such that it tends to reduce the negative camber which, in turn, makes the breakdown location move further downstream. A positive feedback is clearly present in the coupling between the deformation changes and the loading changes, leading to the reported discontinuous behavior. In fact Wentz & Kohlmann’s35 reported angular deflections, as high as 3~4 degrees at the apex section for these slender delta wings and their possible effect on breakdown location. Considering the above, it is reasonable to assume that discontinuous vortex breakdown location in Wentz & Kohlmann’sreport for Λ≥70° delta wing is anomalous due to aeroelastic effects and cannot, therefore, be deemed to be representative of the breakdown behavior over a rigid model. Similar conclusion had been obtained by Lowson90.
b). Lemay’s56 model has 23° bevel on the upper surface along the leading-edge while Earnshaw’s27 model has a 14° slope on the upper surface. Since the bevel widths are relatively larger than those of Erickson42,Miau84 and Huang114 in their water tunnel experiments, in the Lemay’s56 and Earnshaw’s27 cases the bevel may result in a reduction of the effective angle of attack with corresponding delays in the vortex breakdown location.
c). Mitchell’s128 and Molton’s,80 experiments were carefully conducted. However the asymmetric support in the experimental set-up may cause the up wash resulting in the increase of the effective angle of attack, ∆α, and the upstream movement of the vortex breakdown. Actually this up-wash and effective angle of attack increase was observed by earlier experiment conducted by Molton80 where it was estimated ∆α could reach 2∼3° at high angles of attack range. In addition, the blockage and the flow angularity induced by asymmetric support may cause some problem as the blockage of vertical and horizontal supports was roughly 7% while the model blockage at α=30° was 6.5%. As Lambourne &Bryer’s 24 experimentsshow large blockage which may promote the vortex breakdown.
CRITICAL ASSESSMENT OF TEST CASES ON VORTEX BREAKDOWN OVER SLENDER DELTA WINGS UNDER STATIC MODEL CONDITIONS
In viewing of the above considerations, similar to the 65 sweep delta wing the assessed data set and the normalized data set of time-averaged vortex breakdown locations for the 70° delta wing with sharp leading-edges and flat upper surface are depicted in Fig. 38 and Fig. 39 respectively. The largest precision interval is of the order of 5% at α≈40º.
2.7 CONCLUSIONS
• A screening process has been performed on more than eighty experimental cases about vortex breakdown over delta wings with different sweptback angles at high angles of attack and static model conditions. Vortex breakdown locations over 65º and 70º delta wings with flat upper surface have been normalized.
• The effects of leading-edge shape, centerbody and other test conditions have been critically investigated.
• The edge shape may affect the vortex behavior which depends on relative size of the leading-edge shape to the thickness of the boundary layer. Its effect may be neglected if the relative size is small.
• If the relative size is large, different leading edge shapes, e.g. sharp and round leading-edges, may have different effects on the vortex, either at the separation lines or the onset of the separation location. The difference in time-averaged vortex breakdown locations between sharp and round leading-edges needs further clarification.
• For the discussed centerbody setting, no global but only local effect on the pressure has been observed. Centerbody may have minor effect on the vortex breakdown.
• Increase Reynolds number may promote transition in the free shear layer and delay the onset of separation line on round leading-edge. However Reynolds number may have less effect on time-averaged vortex breakdown location, even on wings with round leading edges.
• Increase Mach number results in the reduction of the effect of the leading-edge shape. It also promotes vortex breakdown upstream. Reynolds number Effect
2.8 REFERENCES
[1] Squire, H. B., “Analysis of the Vortex Breakdown Phenomenon,” Part I, Imperial College of Science and Technology, Aeronautics Dept. Report No. 102, 1960.
[2] Hall, M.G., “A Theory for the Core of a Leading-Edge Vortex,” J. Fluid Mech. 11, 209-228, 1961.
[3] Hall, M.G., “The Structure of Concentrated Vortex Cores,” Prog. Aerospace Sci. 7, 53-110, 1966.
[4] Benjamin, T.B., “Theory of the Vortex Breakdown Phenomenon,” J. Fluid Mech. 14(4), 593-629, 1962.
[5] Sarpkaya, T., “On Stationary and Traveling Vortex Breakdowns,” J. Fluid Mech., Vol. 45, Part 3, 1971.
CRITICAL ASSESSMENT OF TEST CASES ON VORTEX BREAKDOWN OVER SLENDER DELTA WINGS UNDER STATIC MODEL CONDITIONS
[6] Sarpkaya, T., “Vortex Breakdown in Swirling Conical Flows,” AIAA Journal, Vol. 9, Sept. 1971.
[7] Hall, M.G., “Vortex Breakdown,” Ann. Rev. Fluid Mech., Vol. 4, 1972..
[8] Leibovich, S., “The Structure of Vortex Breakdown,” Ann. Rev. Fluid Mech. 10, 221-246, 1978.
[9] “High Angle of Attack” AGARD CP-247, January 1979.
[10] Wedemeyer, E., “Vortex Breakdown,” No. 9, AGARD-LS-121, Dec. 1982.
[11] “Aerodynamics of Vortical Type Flows in Three Dimensions” AGARD-CP 342, July 1983.
[12] Leibovich, S., “Vortex Stability and Breakdown,” AGARD-CP-342, No. 23, April 1983.
[13] Leibovich, S., “Vortex Stability and Breakdown: Survey and Extension,” AIAA Journal, Vol. 22, No. 9, Sept. 1984.
[14] Leibovich, S., “On a Theoretical Scenario for Vortex Breakdown,” Vortex Control and Breakdown Behavior, Second International Colloquium on Vortical Flows, Baden, Switzerland, April 1987.
[15] Delery, J., Pagan, D. and Solignac, J.L., “On the Breakdown of the Vortex Induced by a Delta-Wind,” ONERA T.P. nº 1987-105, 1987.
[16] Mario Lee and Ho, C.M., “Lift Force of Delta Wings,” Appl Mech Rev, Vol. 43, No. 9, Sept. 1990.
[17] Nelson, R.C. and Visser, K.D., “Breaking Down the Delta Wing Vortex – The Role of Vorticity in the Breakdown Process,” AGARD Symposium on Vortex Flow Aerodynamics, October 1-4, 1990.
[18] “Vortex Flow Aerodynamics” AGARD CP-494, July 1991.
[19] Delery, J.M., “Aspect of Vortex Breakdown,” Prog. Aerospace Sci. Vol. 30, pp. 1-59, 1994.
[20] “Advanced Flow Management, Part A: Vortex Flow and High Angle of Attack” RTO AVT
Symposium May 2001.
[21] Lee, G.H., “Note on the Flow Around Delta Wings with Sharp Leading Edges,” ARC R&M 3070, Sept. 1953.
[22] Elle, B.J., “An Investigation at Low Speed of the Flow Near the Apex of Thin Delta Wings with Sharp Leading-Edges,” ARC R&M 3176, January 1958.
[23] Elle, B.J., “On the Breakdown at High Incidence of the Leading Edge Vortices on Delta Wings,” J. of the Royal Aero. Soc., Vol. 64, August 1960.
[24] Lambourne, N.C. and Bryer, D.W., “The Bursting of Leading-Edge Vortices – Some Observations and Discussion of the Phenomenon,” ARC R&M 3282, April 1961.
CRITICAL ASSESSMENT OF TEST CASES ON VORTEX BREAKDOWN OVER SLENDER DELTA WINGS UNDER STATIC MODEL CONDITIONS
[25] Harvey, P.M., “Some Observations of the Vortex Breakdown Phenomena,” J. Fluid Mech., Vol. 14, 1962.
[26] Earnshaw, P.B. and Lawford, J.A., “Low-Speed Wind-Tunnel Experiments on Series of Sharp-Edged Delta Wings,” ARC R&M 3424, March 1964.
[27] Earnshaw, P.B., “Measurements of Vortex-Breakdown Position at Low Speed on a Series of Sharp-Edged Symmetrical Models,” ARC CP 828, Nov. 1964.
[28] Lowson, M.V., “Some Experiments with Vorex Breakdown,” J. of the Royal Aero. Soc., Vol. 68, May 1964.
[29] Lambourne, N.C., “The Breakdown of Certain Types of Vortex,” NPL AERO REPORT 1166, 1965.
[30] Hummel, D., “Research on Vortex Breakdown on Slender Delta Wings,” Zeitschrift fur
Flugwissenshaften, 13, 5, Aircraft Research Association Ltd., Bedford Library Translation, No. 12, May 1965.
[31] Hummel, D., “Experimental Investigation of the Flow on the Suction Side of a Thin Delta Wing,” Z. Flugwiss., Jahrg. 13, Heft 7, pp. 247-252, July 1965
[32] Hummel, D. and Srinivasan, P.S., “Vortex Breakdown on Slender Sharp-Edged Wings,” Journal of the Royal Aeronautical Society, Vol. 71, pp.319-322, April 1967.
[33] Earnshaw, P.B., “Measurements of the Effects of Thickness on Vortex Breakdown Position on a Series of Sharp-Edged Delta Wings,” ARC CP No. 1018, 1968.
[34] Wentz, W.H. Jr. and Kohlmann, D.L., “Vortex Breakdown on Slender Sharp-Edged Wings” J. Aircraft Vol. 8, No.3, March 1971 or NASA CR 98737, Nov. 1968.
[35] Wentz, W.H. Jr. and Kohlman, D.L., “Wind Tunnel Investigations of Vortex Breakdown on Slender Sharp-Edged Wings,” NASA N69-14762, 1968.
[36] Wentz, W.H. Jr., “Wind Tunnel Investigation of Vortex Breakdown on Slender Sharp-Edged Wings,” Ph.D. Thesis, University of Kansas, 1969.
[37] Wentz, W.H. Jr., “Effects of Leading-Edge Camber on Low-Speed Characteristics of Slender Delta Wings,” NASA-CR-2002, Oct. 1972.
[38] Werle, H., “Sur L’éclatement Des Tourbillons,”ONERA Note Technique, Nº 175, 1971.
[39] Chigier, N.A., “Measurement of Vortex Breakdown over a Delta Wing Using Laser Anemometer,” NEAR-TR-62, 1974.
[40] Thompson, D.H., “A Water Tunnel Study of Vortex Breakdown over Wings with Highly Swept Leading Edges,” Aerodynamics Note, ARL/A. 356, Australian Defense Scientific Service, May 1975.
CRITICAL ASSESSMENT OF TEST CASES ON VORTEX BREAKDOWN OVER SLENDER DELTA WINGS UNDER STATIC MODEL CONDITIONS
[41] Hummel, D., “On the Vortex Formation over a Slender Wing at Large Angles of Incidence,” AGARD-CP-247, Oct. 1978.
[42] Erickson, G.E., “Water Tunnel Flow Visualization: Insight Into Complex Three-Dimensional Flow Fields,” AIAA Paper 79-1530, also AIAA 80-1423, 1979.
[43] Erickson, G.E., “Vortex Flow Correlation,” Tech. Rept. AFWAL-TR-80-3143, 1980.
[44] Erickson, G.E., “Flow Studies of Slender Wing Vortices,” AIAA Paper 80-1423, 1980.
[45] Erickson, G.E., “Water-Tunnel Studies of Leading-Edge Voritces,” Journal or Aircraft, Vol. 19, No. 6, June 1982.
[46] Skow, A.M. and Erickson, G.E., “Modern Fighter Aircraft Design for High-Angle-of-Attack Maneuvering,” AGARD LS121, 4-1 to 4-59, Dec. 1982.
[47] Wedemeyer, E., “Vortex Breakdown,” AGARD LS121, 9-1 to 9-17, Dec. 1982.
[48] Escudier, M.P., and Keller, J.J., “Vortex Breakdown: A Two Stage Transition,” AGARD-CP-342, No. 25, April 1983.
[49] McKernan, E.C., “An Investigation of the Breakdown of the Leading Edge Voprtices on a Delta Wing at High Angles of Attack,” Master Thesis, University of Notre Dame, Jan. 1983.
[50] Gad-el Hak, M. and Blackwelder, R.F., “The Discrete Vortices from a Delta Wing,” AIAA Journal, Vol. 23, No. 6, pp. 961-962, June 1985.
[51] Payne, M., Ng, T.T., Nelson, R.C. and Schiff, L., “Visualization and Flow Surveys of the Leading Edge Vortex Structure on Delta Wing Planforms,” AIAA Paper 86-0330, 1986.
[52] Boersen, S.J., “US/European Vortex Flow Experriment Test Report of Wind Tunnel Measurements on 65º Delta Wing in the NLR Supersonic Facility SST,” NLR TR 86117 U, 1986.
[53] Reynolds, G.A. and Abtahi, A.A., “Instabilities in Leading-Edge Vortex Development,” AIAA Paper 87-2424, 1987.
[54] Payne, F. M., “The Structure of Leading Edge Vortex Flows Including Vortex Breakdown,” Ph.D. Dissertation, University of Notre Dame, 1987.
[55] Payne, F.M., Ng, T.T., and Nelson, R.C., “Experimental Study of the Velocity Field on a delta Wing,” AIAA Paper 87-1231, 1987.
[56] Lemay, S.P., Batill, S.M. and Nelson, R.C., “Leading Edge Vortex Dynamics on a Pitching Delta Wing,” AIAA Paper 88-2559, 1988, also J. Aircraft, Vol. 27, No.2 Feb. 1990, pp. 131-138.
CRITICAL ASSESSMENT OF TEST CASES ON VORTEX BREAKDOWN OVER SLENDER DELTA WINGS UNDER STATIC MODEL CONDITIONS
[57] McKenan, J.F. and Nelson, R.C., “An Investigation of the Breakdown of the Leading Edge Vortices on a Delta-Wing at High Angles of Attack,” AIAA Paper 83-2114. Also J. Aircraft, Vol. 25, No. 11, Nov. 1988.
[58] Lowson, M.V. and Riley, A.J., “The Three Dimensional Vortex Sheet Structure on Delta Wings,” AGARD-CP-438, October 1988.
[59] Brandon, J.M. and Shah, G.H., “Effect of Large Amplitude Pitching Motions on the Unsteady Aerodynamic Characteristics of Flat-Plate Wings,” AIAA Paper 88-4331, 1988.
[60] Kegelman, J and Roos, F. “Effect of Leading-Edge Shape and Vortex Burst on the Flowfields of a 70 Degree Sweep Delta-Wing,” AIAA Paper 89-0086, 1989.
[61] Braslow, A.L. and Collier, F.S., “Applied Aspect of Laminar-Flow Technology,” Viscous Drag Reduction in Boundary Layers, Progress in Astronautics and Aeronautics, Vol. 123, 1989.
[62] Panton, R.L., “The Effect of a Contoured Apex on Vortex Breakdown, AIAA Paper 89-0193, 1989.
[63] Magness, C., Robinson, O. and Rockwell, D., “Control of Leading-Edge Vortices on a Delta Wing,” AIAA Paper 89-0999, 1989.
[64] Hawk, J.D., Barnett, R.M. and O’Neil, P.J., “Investigation of High Angle of Attack Vortical Flows over Delta Wings,” AIAA Paper 90-0101, 1990.
[65] O’Neil, Roos, F.W., Kegelman, R.M., Barnett, R.M. and Hawk, J.D., “Investigation of Flow Characteristics of a Developed Vortex,” NADC-89114-60, May 1989, Also AIAA Paper 90-0383, 90-0599.
[66] Roos, F.W. and Kegelman, J.T., “Recent Exploration of Leading-Edge-Vortex Flowfields,” McDonnell Douglas Research Laboratories, 1990.
[67] Torlund, P.A., “Force Measurements and Visualization on a 60° Delta Wing in Oscillatory and Stepwise Pitching Motion,” ICAS 90-3.3.2, 1990.
[68] Wolffelt, K.W., “Investigation on the Movement of Vortex Burst Position with Dynamically Changing Angle of Attack for a Schematic Delta Wing in a Water Tunnel Correlation to Similar Studies in Wind Tunnel,” AGARD CP 413-27.
[69] Roos, F.W. and Kegelman, J.T., “An Experimental Investigation of Sweep Angle Influence on Delta-Wing Flows,” AIAA Paper 90-0383, 1990.
[70] Hanff, E.S. and Jenkins, S.B., “Large-Amplitude High Rate Rolling Experiments on a Delta and Double Delta Wing,” AIAA Paper 90-0224, 1990.
[71] Hanff, E.S. Kapoor, K., Anstey, C.R. and Prini, A., “Large-Amplitude High-Rate Roll Oscillation System for the Measurement of Non-Linear Loads,” AIAA Paper 90-1426, 1990.
CRITICAL ASSESSMENT OF TEST CASES ON VORTEX BREAKDOWN OVER SLENDER DELTA WINGS UNDER STATIC MODEL CONDITIONS
[72] Hanff, E.S. and Ericsson, L.E., “Multiple Roll Atractors of a Delta Wing at High Incidence,” AGARD CP-494, Oct. 1990.
[73] Gordnier, R.E. and Visbal, M.R., “Numerical Simulation of the Unsteady Vortex Structure over a Delta Wing,” AIAA Paper 91-1811, 1991.
[74] Nelson, R.C., “Unsteady Aerodynamics of Slender Wings,” AGARD-R-776, pp. 1-1 to 1-26, 1991.
[75] Lowson, M.V., “Visualization Measurements of Vortex Flows,” Journal of Aircraft, Vol. 28, No. 5, pp.320-327, May 1991.
[76] Ericsson, L.E., “Analysis of Wind-Tunnel Data Obtained in High-Rate Rolling Experiments with Slender Delta Wings,” NRC IAR-CR-14, August 1991.
[77] Hanff, E.S. and Huang, X.Z., “Roll-Induced Cross-Loads on a Delta Wing at HIgh Incidence,” AIAA Paper 91-3223, 1991.
[78] Weinberg, X. “Effect of Tunnel Walls on Vortex Breakdown Location over Delta Wings,” AIAA Journal Vol. 30, No. 6, June, 1992.
[79] Stahl, W.H., Mahmood, M. and Asghar, A., “Experimental Investigations of the Vorex Flow on Delta Wings at High Incidence,” AIAA Journal, Vol. 30, No. 4, pp. 1027-1032, April 1992.
[80] Molton, P., “Etude Experimentale de leclatement tourbillonnaire sur aile delta en coulement incompressible. Caracterisation du champ externe,” ONERA Rapport Tech. Nº 5/1147 AN, 1992.
[81] Miller, L.S. and Gile, B.E., “Effects of Blowing on Delta Wing Vortices During Dynamic Pitching,” AIAA Paper 92-0407, Also J. Aircraft Vol. 30, No.3, 1993, pp.334-339.
[82] Huang, X.Z. and Hanff, E.S., “Prediction of Leading-Edge Vortex Breakdown on a Delta Wing Oscillating in Roll,” AIAA Paper 92-2677, June 1992.
[83] Guglieri, G. and Quagliotti, F.B., “Experimental Investigation of Vortex Dynamics on Delta Wings,” AIAA Paper 92-2731, 1992.
[84] Miau, J.J., Chang, R.C. and Chou, J.H., “Nonuniform Motion of Leading-Edge Breakdown on Ramp Pitching Delta Wing,” AIAA Journal Vol. 30, No. 7, July 1992.
[85] Visser, K.D. and Nelson, R.C., “Measurements of Circulation and Vorticity in the Leading-Edge Vortex of a Delta Wing,” AIAA Journal Vol. 31, No. 1 pp. 104-111, 1993.
[86] Towfighi, J. and Rockwell, D., “Instantaneous Structure of Vortex Breakdown on a Delta Wing via Particle Image Velocimetry,” AIAA Journal, Vol. 31, No. 6, pp. 1160-1162, June 1993.
[87] Huang, X.Z. and Hanff, E.S., “Prediction of Normal Force on a Delta Wing Rolling at HIgh Incidence,” AIAA Paper 93-3686, 1993.
CRITICAL ASSESSMENT OF TEST CASES ON VORTEX BREAKDOWN OVER SLENDER DELTA WINGS UNDER STATIC MODEL CONDITIONS
[88] Rockwell, D., “Three-Dimensional Flow Structure on Delta Wings at High Angle-of-Attack: Experimental Concepts and Issues,” AIAA Paper 93-0550, January, 1993.
[89] Straka, W.A. and Hemsch, M.J., “Effect of a Fuselage on the Leading-Edge Vortex Breakdown of a Delta Wing,” J. Aircraft, Vol. 31, No. 4, 1994, pp.1002-1005.
[90] Lowson, M.V. and Riley, A.J., “Vortex Breakdown Control by Delta Wing Geometry,” AIAA Paper 94-3487, 1994.
[91] Pelletier, A. and Nelson, R.C., “An Experimental Study of Static and Dynamic Vortex Breakdown on Slender Delta Planforms,” AIAA Paper 94-1879, 1994.
[92] Gordnier, R.E. and Visbal, M.R., “Unsteady Vortex Structure over a Delta Wing,” Journal of Aircraft, Vol. 31 No. 1, pp. 243-248, 1994.
[93] Pelletier, A., “An Experimental Investigation of Vortex Breakdown on Slender Delta Planforms,” Final Contract Report, Hessert Center for Aerospace Research, Notre Dame University, August 1994.
[94] Ericsson, L.E., “Comments on Effect of Fuselage on Delta Wing Vortex Breakdown,” Journal of Aircraft Vol. 31, No. 4, pp. 1002-1005, 1994.
[95] Gursul, I., Unsteady Flow Phenomena over delta Wings at High Angle of Attack,” AIAA Journal, Vol. 32, No. 2, pp. 225-231, Feb. 1994.
[96] Gursul, I. and Yang, H., “On Fluctuations of Vortex Breakdown Location,” Physics of Fluids, Vol. 7, No. 1, pp. 229-231, 1995.
[97] Gordnier, R.E. and Visbal, M.R., “Instabilities in the Shear Layer of Delta Wing,” AIAA Paper 95-2281, 1995.
[98] Lowson, M.V., Riley, A.J. and Swales, C., “Flow Structure over Delta Wings,” AIAA Paper 95-0586, 1995.
[99] Traub, L.W. and Redinioties, O.K., “Instabilities of Vortex Breakdown; Their Structure and Growth,” AIAA Paper 95-2308, 1995.
[100] Chu, J. and Luckring, J.M., “Experimental Surface Pressure Data Obtained on Delta Wing Across Reynolds Number and Mach Number Ranges,” Vol. 1 – Sharp Leading Edge,” NASA TM-4645, February 1996.
[101] Chu, J. and Luckring, J.M., “Experimental Surface Pressure Data Obtained on Delta Wing Across Reynolds Number and Mach Number Ranges,” Vol. 2 – Small Leading Edge,” NASA TM-4645, February 1996.
CRITICAL ASSESSMENT OF TEST CASES ON VORTEX BREAKDOWN OVER SLENDER DELTA WINGS UNDER STATIC MODEL CONDITIONS
[102] Chu, J. and Luckring, J.M., “Experimental Surface Pressure Data Obtained on Delta Wing Across Reynolds Number and Mach Number Ranges,” Vol. 3 – Medium Leading Edge,” NASA TM-4645, February 1996.
[103] Chu, J. and Luckring, J.M., “Experimental Surface Pressure Data Obtained on Delta Wing Across Reynolds Number and Mach Number Ranges,” Vol. 4 – Large Leading Edge,” NASA TM-4645, February 1996.
[104] Hanff, E.S. and Huang, X.Z., “Highlights of the IAR/WL High-Alpha Joint Program,” NPU/AIAA AFM 96-016, 1996.
[105] Huang, X.Z. and Hanff, E.S., “Unsteady Behavior of Spiral Leading-Edge Vortex Breakdown,” NPU/AIAA AFM 96-038, 1996.
[106] Huang, X.Z. and Hanff, E.S., “Surface Flow Topology on a Delta Wing Rolling at High Incidence,” NPU/AIAA AFM 96-041, 1996.
[107] Cipolla, K.M., “Structure of the Flow Past a Delta Wing with Variations in Roll Angle,” Ph.D. Dissertation, Leigh University, May 1996.
[108] Huang, X.Z., Hanff, E.S. and Jobe, C.E., “Surface Flow Topology on a Delta Wing at High Incidence for a Range of Rol Angles,” AIAA Paper 96-2398, 1996.
[109] Ericsson, L.E., “Flow Physics of Critical States for Rolling Delta Wings,” Journal of Aircraft Vol. 33, No. 2, pp. 347-352, 1996.
[110] Ericsson, L.E., “Pitch Rate Effects on Delta Wing Vortex Breakdown,” Journal of Aircraft Vol. 33, No. 2, pp. 639-642, 1996.
[111] Ericsson, L.E., “Difficulties in Predicting Vortex Breakdown Effects on a Rolling Delta Wing,” Journal of Aircraft Vol. 33, No. 3, pp. 477-484, 1996.
[112] Huang, X.Z. and Hanff, E.S., “Unsteady Behavior of Spiral Leading-Edge Vortex Breakdown,” AIAA Paper 96-3408, 1996.
[113] Guglieri, G. and Quagliotti, F.B., “Experimental Investigation of Vortex Dynamics on a 65º Delta Wing in Sideslip ,” The Aeronautical Journal, March 1997..
[114] Huang, X.Z. Sun, Y.Z., and Hanff, E.S., “Further Investigation of Leading-Edge Vortex Breakdown Over Delta Wings,” AIAA Paper 97-2263, 1997.
[115] Huang, X.Z. Sun, Y.Z., and Hanff, E.S., “Circulation Criterion for Leading-Edge Vortex Breakdown over Delta Wings,” AIAA Paper 97-2265, 1997.
[116] Ericsson, L.E., “Effect of Angle of Attack on Roll Characteristics of 65 Degree-Delta Wing,” Journal of Aircraft Vol. 34, No. 4, pp. 573-575, 1997.
CRITICAL ASSESSMENT OF TEST CASES ON VORTEX BREAKDOWN OVER SLENDER DELTA WINGS UNDER STATIC MODEL CONDITIONS
[117] Lowson, M.V. and Riley, A.J., “Development of a Three-Dimensional Free Shear Layer,” J. Fluid Mech. 369, pp. 49-89, 1998.
[118] Jobe, C.E., “Vortex Breakdown Location over 65° Delta Wings – Empiricism and Experiment” AIAA Paper 98-2526, 1998.
[119] Addington, G.A., “The Role of Flow Field Structure in Determining the Aerodynamic Response of a Delta Wing,” Ph.D. Dissertation, University of Notre Dame, Notre Dame, Indiana, April, 1998.
[120] Ericsson, L.E., “Effect of Fuselage Geometry on Delta Wing Vortex Breakdown,” Journal of Aircraft Vol. 35, No. 6, pp. 898-904, 1998.
[121] Huang, X.Z., Lui, T.C. and Hanff, E.S., “Selected Data Set from Static and Rolling Experiments on a 65º Delta Wing at High Incidence,” AGARD WG-22, Chapter 16, 1998.
[122] Hummel, D. and Losser, T., “Low Speed Wind Tunnel Experiments on a Delta Wing Oscillating in Pitch,” ICAS 98-3.9.3, Sept. 1998.
[123] Ericsson, L.E., “Effect of Fuselage Geometry on Delta Wing Vortex Breakdown,” Journal of Aircraft, Vol. 35, No.6, 1998, pp898-904.
[124] Ericsson, L.E., “Vortex Characteristics of Pitching Double-Delta Wings,” Journal of Aircraft Vol. 36, No. 2, March-April 1999.
[125] Huang, X.Z. and Hanff, E.S., “Free-to-Roll Trajectory and Related Attractors of a 65 Delta Wing Rolling at High Incidence,” AIAA Paper 99-4103, 1999.
[126] Huang, X.Z. and Hanff, E.S., “Visualization of Bifurcating Vortex Breakdown Location Over Slender Delta Wings,” 9th International Symposium on Flow Visualization, August 2000.
[127] Ericsson, L.E., “Further Analysis of Fuselage Effects on Delta Wing Aerodynamics, AIAA Paper 2000-0981, 2000.
[128] Mitchell, a. M., Molton, P. Barberis, D. and Délery, J., “Characterization of Vortex Breakdown by Flow Field and Surface Measurements,” AIAA Paper 2000-0788, 2000.
[129] Hanff, E.S., Jenkins, J.E., Huang, X.Z., Myatt, J.H., and Addington, G.A., “Highlights of the NRC/USAF/DND Joint Program on Maneuvering Aerodynamics,” Canadian Aeronautics and Space Journal, Vol. 47, No. 3, Sept. 2001.
[130] Mitchell, A.M. and Molton, P., “Vortical Substructures in the Shear Layers Forming Leading-Edge Vortices,” AIAA Journal, Vol. 40, No. 8, pp. 1689-1692. August 2002.
[131] Ericsson, L.E., “Further Analysis of Fuselage Effects on Delta Wing Aerodynamics,” AIAA Paper 2000-0981, 2000.
CRITICAL ASSESSMENT OF TEST CASES ON VORTEX BREAKDOWN OVER SLENDER DELTA WINGS UNDER STATIC MODEL CONDITIONS
[132] Luckring, J.M., “Reynolds Number and Leading-Edge Bluntness Effects on 65º Delta Wing Aerodynamics,” AIAA Paper 2002-0419, 2002.
[133] Taylor, G.S., Gursul, I., and Greenwell, D.I., “Investigation of Support Interference in High-Angle-of-Attack Testing,” Journal of Aircraft Vol. 40, No. 1, pp. 143-152, January-Februray 2003.
[134] Ericsson, L.E., “Multifaced Influence of Fuselage Geometry on Delta-Wing Aerodynamics,” Journal of Aircraft, Vol. 40, No.1, pp. 204-206, January-February 2003.
[135] Luckring, J.M., “Transonic Reynolds Number and Leading-Edge Bluntness Effects on a 65º Delta Wing,” AIAA Paper 2003-0753, January 2003.
[136] Huang, X.Z., “Comprehensive Experimental Studies on Maneuvering Aerodynamics over Military Wing Configurations in IAR,” CASI Paper 357, 2003.
[137] Gordnier, R.E. and Visbal, M.R., “High-Order Compact Difference Schemes Applied to the Simulation of a Low Speed Delta Wing Flow,” AIAA Paper 2003-0620, 2003.
[138] Visbal, M.R. and Gordnier, R.E., “On the Structure of the Shear Layer Emanating from a Swept Leading Edge at Angle of Attack,” AIAA Paper 2003-4016, 2003.
[139] Luckring, J.M., “Reynolds Number, Compressibility and Leading-Edge Bluntness Effects on 65º Delta Wing Aerodynamics,” ICAS 2004-4.1.4, September 2004.
[140] Huang, X.Z., Mebarki, Y. and Benmeddour, A., “Experimental and Numerical Configuration Study on UCAV’s Aerodynamics,” ICAS 2004-P.7, 2004.
[141] Panton, Ronald L., “Incompressible Flow,” A Wiley-Interscience Publication, 1984.
[142] Pirzadeh, S.Z., “Vortical Flow Prediction Using an Adaptive Unstructured Grid Method,” RTO AVT Report-084, 2006.
[143] Huang, X.Z., “IAR Program on Maneuvering Aerodynamics over Military Wing Configurations, Vol. II: Surface and Off-Surface Flow Visualization, IAR Report to be published in 2006.
[144] Huang, X.Z., “IAR Program on Maneuvering Aerodynamics over Military Wing Configurations, Vol. III: Aerodynamic Loads at Static and Different Dynamic Motions,” IAR Report to be published in 2006.
[145] Huang, X.Z., “IAR Program on Maneuvering Aerodynamics over Military Wing Configurations, Vol. IV: Surface Pressure Measurements at Static and Different Dynamic Motions,” IAR Report to be published in 2006.
[146] Klein, C., etc., “Development of PSP Technique for Application on the VFE-2 65º Delta Wing Configuration,” AIAA Paper 2006-59, 2006.
CRITICAL ASSESSMENT OF TEST CASES ON VORTEX BREAKDOWN OVER SLENDER DELTA WINGS UNDER STATIC MODEL CONDITIONS
[147] Konrath, R., etc., “Analysis of PSP Results Obtained for the VFE-2 65º Delta Wing Configuration at Sub- and Transonic Speeds,” AIAA Paper 2006-60, 2006.
[148] Al-Garni, A.Z., etc., “Experimental and Numerical Investigation of 65-deg Delta and 65/40-deg Double-Delta Wings,” AIAA Paper 2006-63, 2006.
[149] Benmeddour, A., Mebarki, Y. and Huang, X.Z., “Computational Investigation of the Centerbody Effects on the Aerodynamics of Delta Wings,” RTO-AVT Rep. 084, Chapter 20, 2006.
[150] Straka, William A. and Hemsch, Michael J., “Leading-Edge Vortex Breakdown for Wing Planforms with the Same Slenderness Ratio,” Journal of Aircraft, Vol. 31, No. 3, 1994.
CRITICAL ASSESSMENT OF TEST CASES ON VORTEX BREAKDOWN OVER SLENDER DELTA WINGS UNDER STATIC MODEL CONDITIONS
Table 1 Summary of experimental investigations considered in this Chapter.
Case No. 1 2 3 4
Λ 70 65, (55-70) 45-76 65, 70
Model Type Half Full ,Half Full Full
L.E.(Upper) flat flat Convex Convex
L.E.(Lower) 7° bevel 16° Convex Convex
T.E. blunt blunt
c 7.75in 8.5in ,47.5in 0.59-1.18ft 18in, 21in
t .0625in 0.1875, 3in
t/c (%) 0.8 2.2, 6.32 6 4
Type water Water, wind wind wind
Test Section Size 5ftx5ft 13inx10in, 9ftx7ft 4ftx3ft 4ft'x3ft
Rec 0.7x10E6 (12ft/s) 0.01~4.6x10⁶ 0.2~0.4x10⁶ (80ft/s) 1x10⁶
Turbulence
Support Semi & false floor Strut Sting Sting
Blockage, r 0.25% 13.0% (Half model) 1.70% 5%
Vis. method Air bubble Dye, vapor Fine tufts Schlieren
Publication Ref. 22 Ref. 24 Ref. 26 Ref. 27
Case No. 5 6 7 8
Λ 60, 68.2, 76 45-85 60, 65, 70, 75, 80 60-80, 60/70, 70/80
Model Type Full Full Full Full
L.E.(Upper) flat 7.5° bevel 15°
L.E.(Lower) 3° 7.5° bevel 15°
T.E. 7.5° bevel 15°
c 0.625m 10-18" 100-300cm 150mm
t 1.52cm 0.1in 1.8mm
t/c (%) 0.022
Type wind wind water water
Test Section Size 1.3 m 0.22mx0.22m 0.25mx0.25m
Rec 1.7x10⁶ 0.3~1x10⁶ 20cm/s 9.8x10³
Turbulence
Support Suspended on wires 2-point strut Sting Strut
Blockage, r 4.60% 1.80% 8.39%
Vis. method Stethoscope/smoke Schlieren Dye Dye & Bubble
Publication Ref. 28 Ref. 32-35 Ref. 39 Ref. 40
CRITICAL ASSESSMENT OF TEST CASES ON VORTEX BREAKDOWN OVER SLENDER DELTA WINGS UNDER STATIC MODEL CONDITIONS
Case No. 9 10 11 12
Λ 60-80 65 70 70, 75, 80, 85
Model Type Full Full Full Full
L.E.(Upper) flat flat flat flat
L.E.(Lower) 26° 25°
T.E. blunt
c 16" 16"
t 0.05in 0.75in 0.25"
t/c (%) 4.7 1.56
Type water water wind wind
Test Section Size 16inx24inx6ft 0.46mx0.6m 2ftx2ft 2ftx2ft
Rec 4.1x10⁴ 3x10⁴ 0.225x10⁶ 0.085x10⁶
Turbulence 0.1-0.2% 0.1-0.2%
Support Sting Sting Strut Strut
Blockage 8% 8%
Vis. method Dye Dye Smoke (section) Smoke (section)
Publication Ref. 42-45 Ref. 46 Ref. 49 Ref. 51, 54, 55
Case No. 13 14 15 16
Λ 60 75 70 45, 70, rectangular
Model Type Full Full Full Full
L.E.(Upper) flat flat 23° flat
L.E.(Lower) 12° 20° 23°
T.E. blunt 23°
c 100mm 0.31m 16.375in
t 3 mm 4.6mm 0.5in
t/c (%) 3 3
Type water water wind wind
Test Section Size 0.45 x 0.55 m 0.8 x 0.4 m 2inx2in' 12 ft Diameter?
Rec 0.08m/s~0.2 m/s 0.26x10⁶ 1x10⁵
Turbulence 0.10%
Support Strut Strut Strut Strut
Blockage 8%
Vis. method Air bubble Smoke (Axes) Smoke
Publication Ref. 68 Ref. 83 Ref. 56 Ref. 59
CRITICAL ASSESSMENT OF TEST CASES ON VORTEX BREAKDOWN OVER SLENDER DELTA WINGS UNDER STATIC MODEL CONDITIONS
Case No. 17 18 19 20
Λ 75 65 60, 70 60
Model Type Full Full Half Full
L.E.(Upper) flat flat flat flat
L.E.(Lower) 40° 20º 25° 12°
T.E. 25° blunt
c 241, 508mm 150mm 76, 54cm 500mm
t 12mm 3.175mm 1.27 cm 4 mm
t/c (%) 2.12 1.7 0.8
Type water water wind wind
Test Section Size 610x914mm 400x180mm 91cm x74cm 2x2m
Rec 1.2~3.6x10⁴ 25cm/s, 3.5x10⁴ 0.3~2x10⁶ 0.7~1.43x10⁶
Turbulence 0.20% 0.1~0.2%
Support Sting Strut Semi & splitter Strut
blockage 7.80%
Vis. method Dye, Hydrogen bubble Fluorescent dye Smoke (section) Smoke/Schlieren
Publication Ref. 63 Ref. 62 Ref. 65 Ref. 67
Case No. 21 22 23 24
Λ 65 59, 63.4, 67, 70 60, 76 75
Model Type Full Full Full Full
L.E.(Upper) flat blunt 5.7, 11.3 flat
L.E.(Lower) 30 5.7, 11.3 25
T.E. 30 blunt blunt
c 850mm 15, 19, 20 cm 0.27, 0.31m 16in
t 20mm 1mm 1.27mm 0.25in
t/c (%) 2.35 1.56
Type wind water water wind
Test Section Size 3 m (Diameter) 60x60 cm 0.61 x 0.91 m 2inx2in
Rec 5.8~2.1x10⁶ 9x10³ 3.3x10⁴ (0.12m/s) 0.25x10⁶
Turbulence 0.30% 0.80%
Support Sting Sting Sting Strut
blockage 2.10% 6.00%
Vis. method Helium-soap bubble Dye Dye Anemometer
Publication Ref. 83 Ref. 84 Ref. 81 Ref. 81
CRITICAL ASSESSMENT OF TEST CASES ON VORTEX BREAKDOWN OVER SLENDER DELTA WINGS UNDER STATIC MODEL CONDITIONS