Publisher’s version / Version de l'éditeur:
AMMCS-2011: INTERNATIONAL CONFERENCE ON APPLIED MATHEMATICS,
MODELING AND COMPUTATIONAL SCIENCE: Advances in Mathematical and
Computational Methods: Addressing Modern Challenges of Science, Technology,
and Society, 2011
READ THESE TERMS AND CONDITIONS CAREFULLY BEFORE USING THIS WEBSITE. https://nrc-publications.canada.ca/eng/copyright
Vous avez des questions? Nous pouvons vous aider. Pour communiquer directement avec un auteur, consultez la première page de la revue dans laquelle son article a été publié afin de trouver ses coordonnées. Si vous n’arrivez pas à les repérer, communiquez avec nous à [email protected].
Questions? Contact the NRC Publications Archive team at
[email protected]. If you wish to email the authors directly, please see the first page of the publication for their contact information.
NRC Publications Archive
Archives des publications du CNRC
This publication could be one of several versions: author’s original, accepted manuscript or the publisher’s version. / La version de cette publication peut être l’une des suivantes : la version prépublication de l’auteur, la version acceptée du manuscrit ou la version de l’éditeur.
For the publisher’s version, please access the DOI link below./ Pour consulter la version de l’éditeur, utilisez le lien DOI ci-dessous.
https://doi.org/10.1063/1.3663481
Access and use of this website and the material on it are subject to the Terms and Conditions set forth at
Towards Inter- and Intra- Cellular Protein Interaction Analysis: Applying
the Betweenness Centrality Graph Measure for Node Importance
Barton, Alan J.; Haqqani, Arsalan S.
https://publications-cnrc.canada.ca/fra/droits
L’accès à ce site Web et l’utilisation de son contenu sont assujettis aux conditions présentées dans le site LISEZ CES CONDITIONS ATTENTIVEMENT AVANT D’UTILISER CE SITE WEB.
NRC Publications Record / Notice d'Archives des publications de CNRC:
https://nrc-publications.canada.ca/eng/view/object/?id=3eb6f465-0ee6-4d69-a072-aeeadc9e6598 https://publications-cnrc.canada.ca/fra/voir/objet/?id=3eb6f465-0ee6-4d69-a072-aeeadc9e6598
Towards Inter- and Intra- Cellular Protein Interaction
Analysis: Applying the Betweenness Centrality
Graph Measure for Node Importance
Alan J. Barton
∗,†and Arsalan S. Haqqani
∗,∗∗∗
National Research Council Canada
†Institute for Information Technology, Bldg. M-50, 1200 Montreal Rd., Ottawa, Ontario, Canada, K1A 0R6
∗∗
Institute for Biological Sciences, 100 Sussex Dr., Ottawa, Ontario, Canada, K1A 0R6
Abstract. Three public biological network data sets (KEGG, GeneRIF and Reactome) are collected and described. Two
problems are investigated (inter- and intra- cellular interactions) via augmentation of the collected networks to the problem specific data. Results include an estimate of the importance of proteins for the interaction of inflammatory cells with the blood-brain barrier via the computation of Betweenness Centrality. Subsequently, the interactions may be validated from a number of differing perspectives; including comparison with (i) existing biological results, (ii) the literature, and (iii) new hypothesis driven biological experiments. Novel therapeutic and diagnostic targets for inhibiting inflammation at the blood-brain barrier in a number of brain diseases including Alzheimer’s disease, stroke and multiple sclerosis are possible. In addition, this methodology may also be applicable towards investigating the breast cancer tumour microenvironment.
Keywords: Protein-protein Interactions, Relevant Proteins, Network Analysis, Betweenness Centrality, Cancer, Blood-Brain Barrier PACS: 87.15.km, 87.14.ep, 7.18.Xr, 89.20.Ff, 87.19.xj
INTRODUCTION
Objects and relationships between objects are of interest within many Sciences and many other human activities. From a mathematical point of view, Category theory studies these in an abstract manner via structures and relationships between them such as via the use of sets and functions. While from a Computer Science point of view, Graph theory studies these using the concept of a graph, G, that is defined to be composed of two sets; a set of nodes (also called vertices) V , and a set of edges, E. Relating these two perspectives may be achieved by noticing that an edge may be present or absent between nodes in a graph and that from a mathematical point of view, this is a binary relation. Further abstractions are also possible. This now leads to two problems of interest: (i) relating objects and relationships to a suitable representation (such as nodes and edges) and (ii) analyzing the representation in order make hypotheses about the original objects of study. The concrete objectives of this study are to investigate three publicly available biological
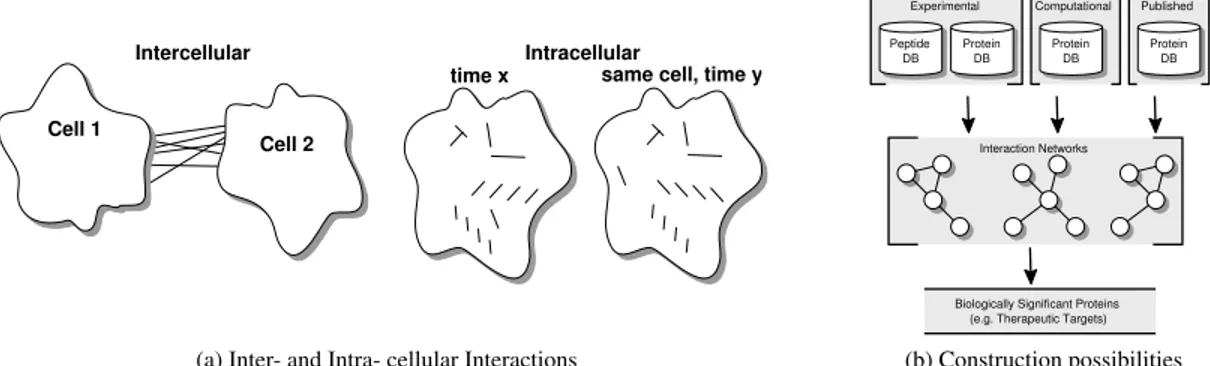
time x same cell, time y
Intercellular Intracellular
Cell 2 Cell 1
(a) Inter- and Intra- cellular Interactions
Interaction Networks Experimental Peptide DB Protein DB Computational Protein DB Published Protein DB
Biologically Significant Proteins (e.g. Therapeutic Targets)
(b) Construction possibilities
FIGURE 1. Protein-protein interactions in terms of intercellular or intracellular interactions may be inferred based on: (i) experimental data, (ii) computational prediction data, or (iii) published data. Publicly available protein-protein interaction (KEGG, Reactome, GeneRIF) data augmenting experimentally obtained mass spectrometry proteomics data are the focus of this paper.
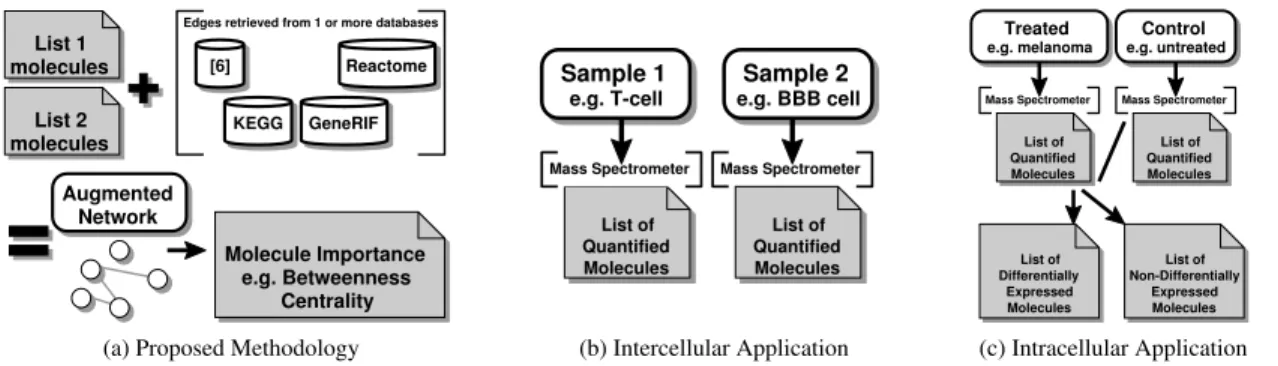
Edges retrieved from 1 or more databases Augmented Network Molecule Importance e.g. Betweenness Centrality List 1 molecules List 2 molecules [6] KEGG GeneRIF Reactome
(a) Proposed Methodology
List of Quantified Molecules Sample 1 e.g. T-cell Sample 2 e.g. BBB cell
Mass Spectrometer Mass Spectrometer
List of Quantified Molecules (b) Intercellular Application Treated e.g. melanoma Control e.g. untreated
Mass Spectrometer Mass Spectrometer
List of Differentially Expressed Molecules List of Non-Differentially Expressed Molecules List of Quantified Molecules List of Quantified Molecules (c) Intracellular Application
FIGURE 2. An interaction graph is constructed by adding: i) each unique molecule (from the two input lists) as a node, and ii) an edge whenever an interaction exists in at least one of the databases of interest, which are not stable in time. Two very different list construction approaches using mass spectrometry provide context specific (non-global) interaction graphs.
TABLE 1. Three public protein-protein interaction networks collected at three different points in time.
Network Source 1stCollection 2010-08-04 2ndCollection 2010-11-17 (+105d) 3rdCollection 2011-02-18 (+93d) Molecules Interactions Molecules Interactions Molecules Interactions
KEGG 3,297 14,695 3,697 18,182 3,843 18,540 (47s)a +400 = 3.8/db +3,487=33.2/d +146=1.6/d +358=3.8/d Reactome 4,070 86,331 4,210 89,520 4,555 106,329 (6.9m)a +140=1.3/d +3,189=30.4/d +345=3.7/d +16,809=180.7/d GeneRIF 34,422 262,840 35,506 274,879 36,904 283,958 (5.6m)a +1,084=10.3/d +12,039=114.6/d +1,398=15.0/d +9,079=97.6/d Unionc 36,842 359,168 38,097 377,145 39,614d(87.4%)e 402,930 (98.6%)e (11.6m)a +1,255=11.9/d +17,977=171.2/d +1,517=16.3/d +25,785=277.2/d
aTotal sequential processing time for 3rdcollection (s=seconds, m=minutes)
b“+x = y/d” indicates that x molecules (or interactions) were collected since the previous time point; averaging y per day cUnion of KEGG, Reactome and GeneRIF networks. Molecule ID’s are converted to a common value (Uniprot ID). Uniprot
has the following time sequence of number of interactions: 1st: 5,254,834, 2nd: 5,698,845 (+444,011=4,228.7/d), and 3rd: 5,950,300 (+251,455=2,703.8/d). Multiple interactions between same molecules are counted as one interaction. Caveat: A molecule may be represented more than once in the Union due to the reliance on common identifiers.
dAverage neighbour degree: 7.695, maximum in degree: 983, maximum out degree: 1,613
eNumber of molecules (interactions) in Union as a percentage of the sum of molecules (interactions) in all 3 base networks
networks containing protein-protein interaction information in order to determine if such information aids the analysis of two specific biological problems, namely: (i) inter- and (ii) intra- cellular analysis (See Fig. 1). There are many avenues of investigation and there is a long history [1–7]. Specific interactions between two or more type of cells play important roles in the pathology of human disease. For example, in multiple sclerosis T-cells from blood interact with endothelial cells in the brain that can subsequently lead to brain damage. The interactions between two (or more) types of cells consist of protein-protein interactions on the cells and are referred to as intercellular interactions. Identifying these specific interacting proteins on the two cells (i.e. T-cells and brain cells) using proteomics and interactomics
TABLE 2. Molecules in the public data sets with highest exact Betweenness Centrality values. GeneRIF plays a large influential role in the overall structure of the combined interaction network.
Source Top Molecules
KEGG GNAL, MAPK1, MAPK3, RHOA, STAT1, TRAF6, PRKACB, PRKACG, PRKX, PRKACA, ... Reactome GNB1, CXCR4, UBA52, RPS27A, CDC42, ARHGEF12,ARHGEF7,CXCR3,ARHGEF1,APC, ... GeneRIF 855668, 2539403, 852755, UBC, 31293, 18519, 850620, 852295, TP53, 18128, ...
TABLE 3. Intercellular analysis (See Fig. 2) results. The union of all networks results in a more connected network. Sequential processing times are: 9s, 19s, 2.1m and 2.4m for the 4 networks. Statistical Betweenness Centrality processing times are: 50m, 63m, 64m and 82m respectively.
Molecule KEGG (49 pieces) Reactome (42 pieces) GeneRIF (48 pieces) Union (40 pieces) IR1 1a 73,411b 2a 50,145b 1a 163,581b 1a 193,916b IR2 2 69,432 1 65,349 2 107,386 2 150,770 IR3 3 38,298 7 19,312 18 23,647 3 73,893 IR4 26c 7,074 24 8,989 3 75,204 4 57,186 IR5 10 14,160 21c 9,782 4 57,286 5 52,087 IR6 5 18,890 12 28,706 6 42,644 IR7 12 13,557 11 12,687 6 39,027 7 41,253 IR8 9 15,978 5 43,611 8 38,118 IR9 10 15,942 7 34,437 9 36,387 IR10 39 6,828 41 11,412 10 34,355 ITGB1 6 16,358 12 12,359 23 18,662 16c 28,962 aBetweenness Centrality rank for the molecule within the respective network bHigh value indicates potentially more influential molecule within network cStatistical Betweenness Centrality is 26 → 25, 21 → 20, and 16 → 15
methods, whose disruption would inhibit the cell-cell interactions (using specific drugs), is an attractive target for the therapy of multiple sclerosis [6]. In addition, changes in protein-protein interactions within a single cell (intracellular interactions), as a result of a change in pathological state, are also considered an attractive target for a number of human diseases. For example, identifying specific changes in protein interactions in a cancer cell as a result of benign-to-malignant transformation and finding which one would destroy the network (and hence the malignant cells) is of therapeutic significance. Proteomics and other ’omics methods generate an overwhelming list of molecules from the analysis of tissues, cell lines etc. that quickly becomes unmanageable. For example, in order to validate a list of proteins, a costly and time consuming process is performed in the laboratory. One reductionist approach often undertaken is to select a couple of the molecules for further evaluation. However, this relies on literature and well studied molecules, with a significant portion of disease-implicated molecules being overlooked. Interactomics links novel molecules with potentially disease related (e.g. cancer) molecules and pathways, hence is one possible approach upon which a methodology for prioritization of targets may be constructed.
RESULTS
This paper investigates three public data sets: i) KEGG [8], ii) Reactome [9], and iii) GeneRIF http://www.ncbi. nlm.nih.gov/projects/GeneRIF/, within two experimental methodologies (See Fig.2): i) Intercellular and
ii) Intracellular. There are 3 aspects reported: i) global network statistics, ii) problem specific intercellular results, and iii) problem specific intracellular results. First, the global statistics for the 3 networks (KEGG, Reactome and GeneRIF) are reported in Table 1 for the 3 collection time points. As can be seen, all networks are increasing in size with a very high rate per day both in terms of number of molecules and in terms of number of new interactions. This indicates that, if a system wide analysis is desired, some form of automated approach is needed to aid an investigator. A few molecules in Table 2 have large betweenness centrality values and since natural systems are robust due to, for example, duplication of pathways, these may not necessarily be the most influential molecules. Second, the results for the intercelluar analysis in Table 3 attempt to answer the question: “Which protein interaction will disrupt the cellular contacts and communication between two cells?”. High scoring interactions included the ALCAM-CD6 and ITGB1, which dimerizes with integrin alpha-4 to form VLA4 adhesion molecule. It has been recently shown that ALCAM is upregulated in multiple sclerosis patients, disrupting ALCAM-CD6 interaction with a therapeutic antibody inhibited T-cell interaction with brain cells and significantly reducing the severity and delayed the time of onset of multiple sclerosis in an animal model [10]. In addition, Natalizumab is a drug that targets VLA4 and is currently being used in clinics for the treatment of multiple sclerosis. More specifically, it inhibits VLA4 on T-cells from binding blood brain barrier and entering/damaging the brain. Furthermore, the proteins IR1, IR2, IR4, IR5 and IR10 have been associated in the literature [6] with multiple sclerosis, Alzheimer’s disease and/or stroke. They are being further validated and
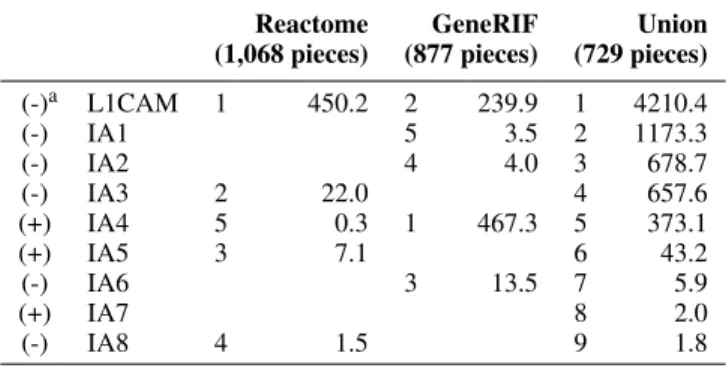
TABLE 4. Intracellular analysis results. No Betweenness Central-ity values computed for KEGG (1,356 pieces).
Reactome (1,068 pieces) GeneRIF (877 pieces) Union (729 pieces) (-)a L1CAM 1 450.2 2 239.9 1 4210.4 (-) IA1 5 3.5 2 1173.3 (-) IA2 4 4.0 3 678.7 (-) IA3 2 22.0 4 657.6 (+) IA4 5 0.3 1 467.3 5 373.1 (+) IA5 3 7.1 6 43.2 (-) IA6 3 13.5 7 5.9 (+) IA7 8 2.0 (-) IA8 4 1.5 9 1.8
a(-) negative differential expression; resp. positive (+)
pursued as novel disease targets. Third, the results for the intracellular analysis in Table 4 attempt to answer the question: “What differentially expressed protein will destroy an interaction network the ’most’?” with high scoring interactions L1CAM, IA1, and IA3 as being identified to be associated with melanoma cells (i.e. cancer cells) under malignant states (e.g. [11]).
CONCLUSIONS
Some of the top hits are known clinical or preclinical targets; a form of validation of the proposed approach. The remaining top hits are thus attractive potential therapeutic targets for which hypothesis-driven biological experiments are possible future work. Results were reported for T-cell/brain cell intercellular interactions and intracellular changes for variants of malignant melanoma. The methodology may also be applicable to other biological systems and diseases.
ACKNOWLEDGMENTS
Dr. Hill at the IBS is thanked for the differential expression data from the NRC’s Cancer GHI-4 Program used for computing the Intracellular Analysis results. Dr. Famili, Dr. Kelly and Dr. O’Connor are thanked for their support.
REFERENCES
1. Jordan, M.C, Sur les assemblages de lignes. 70, pp. 185–190, 1869.
2. Bavelas, A., A Mathematical Model for Group Structures. 7, pp. 16–30, 1948.
3. Freeman, A., A set of measures of centrality based upon betweenness. Sociometry, 40, pp. 35–41, 1977. 4. Newman, M.E.J., The Structure & Function of Complex Networks. SIAM Review, 45-2, pp. 167–256, 2003.
5. Madduri, K., et al., A Faster Parallel Algorithm and Efficient Multithreaded Implementations for Evaluating Betweenness
Centrality on Massive Datasets. In Third Workshop on Multithreaded Arch. and App., 2009.
6. Haqqani, A.S. and Stanimirovic, D.B., Intercellular Interactomics of Human Brain Endothelial Cells and Th17 Lymphocytes:
A Novel Strategy for Identifying Therapeutic Targets of CNS Inflammation. Cardiovascular Psychiatry and Neurology, 2011. PMID: 21755032.
7. Barton, A.J., Towards Parallel Betweenness Centrality: A Study of one Graph Measure on the SIMD GPU. Technical Report, National Research Council Canada, 2010.
8. Kanehisa, M., et al., KEGG for representation and analysis of molecular networks involving diseases and drugs. Nucleic Acids Res. 38, D355-D360, 2010.
9. Croft D et al. Reactome: a database of reactions, pathways and biological processes. Nucleic Acids Res. 2011 Jan;39(Database issue):D691-7.
10. Cayrol R et al., Activated leukocyte cell adhesion molecule promotes leukocyte trafficking into the central nervous system. Nat Immunol. 2008 Feb;9(2):137-45. Epub 2007 Dec 23. PubMed PMID: 18157132.
11. Rawnaq T et al. L1 is Highly Expressed in Tumors of the Nervous System: A Study of Over 8000 Human Tissues. Journal of Surgical Research, 1-6, 2010.