Publisher’s version / Version de l'éditeur:
Fire and Materials, 29, May/June 3, pp. 165-179, 2005-05-01
READ THESE TERMS AND CONDITIONS CAREFULLY BEFORE USING THIS WEBSITE. https://nrc-publications.canada.ca/eng/copyright
Vous avez des questions? Nous pouvons vous aider. Pour communiquer directement avec un auteur, consultez la
première page de la revue dans laquelle son article a été publié afin de trouver ses coordonnées. Si vous n’arrivez pas à les repérer, communiquez avec nous à [email protected].
Questions? Contact the NRC Publications Archive team at
[email protected]. If you wish to email the authors directly, please see the first page of the publication for their contact information.
NRC Publications Archive
Archives des publications du CNRC
This publication could be one of several versions: author’s original, accepted manuscript or the publisher’s version. / La version de cette publication peut être l’une des suivantes : la version prépublication de l’auteur, la version acceptée du manuscrit ou la version de l’éditeur.
For the publisher’s version, please access the DOI link below./ Pour consulter la version de l’éditeur, utilisez le lien DOI ci-dessous.
https://doi.org/10.1002/fam.880
Access and use of this website and the material on it are subject to the Terms and Conditions set forth at
Thermal properties of lightweight-framed construction components at elevated temperatures
Bénichou, N.; Sultan, M. A.
https://publications-cnrc.canada.ca/fra/droits
L’accès à ce site Web et l’utilisation de son contenu sont assujettis aux conditions présentées dans le site LISEZ CES CONDITIONS ATTENTIVEMENT AVANT D’UTILISER CE SITE WEB.
NRC Publications Record / Notice d'Archives des publications de CNRC:
https://nrc-publications.canada.ca/eng/view/object/?id=83cadd84-37da-4b1a-b1aa-2cf845d8b05d https://publications-cnrc.canada.ca/fra/voir/objet/?id=83cadd84-37da-4b1a-b1aa-2cf845d8b05d
Thermal properties of lightweight-framed construction components at elevated temperatures
Bénichou, N.; Sultan, M.A.
NRCC-46907
A version of this document is published in / Une version de ce document se trouve dans : Fire and Materials, v. 29, no. 3, May/June 2005, pp. 165-179
Doi:10.1002/fam.880
THERMAL PROPERTIES OF
LIGHTWEIGHT-FRAMED CONSTRUCTION COMPONENTS AT
ELEVATED TEMPERATURES
Noureddine Bénichou and Mohamed A. Sultan Fire Risk Management Program
Institute for Research in Construction National Research Council of Canada Ottawa, Ontario, Canada, K1A 0R6
ABSTRACT
Fire resistance behaviour of lightweight-framed assemblies is determined by defining the thermal and structural performances of the assembly when exposed to fire. To adequately model thermal behaviour in a lightweight wood-framed assembly, thermal properties of the components of the assembly at elevated temperatures must be well defined. This paper presents results of measurements of thermal properties at elevated temperatures of construction materials commonly used to build lightweight wood-framed assemblies that were conducted at the National Research Council of Canada since 1990. The test results, in graphical form, are given as a function of temperature for thermal conductivity, specific heat, mass loss and thermal expansion/contraction for wood, gypsum and insulation. In addition, effects of temperature on the thermal conductivity, specific heat, mass loss and thermal expansion/contraction of these materials are discussed. Finally, in addition to providing a resource of information, this paper also identifies the additional thermal property tests required to complete the matrix of information.
INTRODUCTION
To obtain a satisfactory level of safety, buildings must comply with a number of requirements specified in codes. These requirements deal with many aspects, including those for fire resistance of compartment barriers, such as lightweight frame walls and floors. When adequate, this fire resistance lowers risk to life to building occupants and minimizes damage to the property and its contents.
In North America, the fire resistance of lightweight-framed assemblies has been traditionally determined by subjecting a wall or a floor to a standard fire test conducted in accordance with CAN/ULC-S101-M891 (Underwriters' Laboratories of Canada) and ASTM E1192 (American Society for Testing and Materials). These tests are used to obtain the time to failure based on fire resistance criteria. These criteria can be manifested in three ways:
• Thermal failure defined as an average temperature rise of 140°C or a local maximum of 180°C on the unexposed face above the ambient temperature;
• Integrity failure defined as flames or hot gases penetrating through the components; or
• Stability failure defined as the loss of load-bearing capacity of structural members. The fire resistance for specific load-bearing and non-load-bearing wall and floor assemblies can also be determined using reference to ready-to-use tables or design procedures such as the component additive method found in Appendices A and D, respectively, of the National Building Code of Canada3 (NBCC). Finally, the fire resistance can be evaluated using engineering calculations. Under a performance-based code design environment, it is expected that the use of engineering calculations in design will increase. Indeed, in recent years, many efforts have been devoted to developing fire resistance models. Fire resistance models have the potential to allow more flexibility in the design and to reduce the high costs and time required by fire resistance testing.
Development of Fire Resistance Models - NRC/Wood Industry Partnership
For many years, the National Research Council of Canada (NRC) has been developing fire resistance models. Recently, NRC, in partnership with the Canadian wood industry, studied the behaviour of lightweight wood-framed assemblies at elevated temperatures and developed a numerical model for predicting the fire resistance of lightweight wood-framed wall assemblies exposed to standard fires.4, 5, 6, and 7 This model will be used to develop fire resistance design equations for wood-framed assemblies and guidelines for the use of lightweight wood-framed assemblies for possible incorporation in codes and standards, as well as for incorporation in NRC’s fire risk assessment tools.
Fire resistance of wood-framed walls is determined by the thermal and structural performance of the wall when exposed to fires. The fire resistance model, being developed, consists of two sub-models for predicting thermal and structural response of wood-stud walls. The thermal response sub-model estimates the temperature profile in the wall, the extent of char in wood, as well as the time to thermal failure of the assembly. The structural sub-model calculates the wood stud’s deflection and the time to structural failure of the assembly. The two sub-models are physically independent, but the structural sub-model uses the temperature distribution and the extent of char predicted by the thermal sub-model as input.
Need for Material Properties
In order to adequately predict the fire resistance performance of a wood-framed assembly, the temperatures inside the assembly must be determined, as they are critical in assessing the structural behaviour of the assembly. For such calculations, knowledge of the thermal properties, at elevated temperatures, of the materials that comprise the assembly, is required. The thermal properties include thermal conductivity, specific heat, mass loss and thermal expansion or contraction. Although the literature provides some data for various components of wood-framed assemblies, it has been shown that the information available to describe these properties is often inconsistent and is extremely variable.8 Thus, the process of selecting a set of accurate thermo-physical properties is difficult.
To avoid this selection difficulty and to have confidence in the measured thermal properties, NRC has carried out a number of tests on the thermal properties at elevated
temperatures of construction materials commonly used to build lightweight wood-framed assemblies. This paper presents the test results from experimental studies on thermal properties at elevated temperatures for various components of wood-framed assemblies, conducted at NRC. The outcome of this study will serve to combine the existing information into a single source directly accessible to researchers and will increase the database of material properties found in the literature. The test results, represented in a graphical form, are given as a function of temperature for thermal conductivity, specific heat, mass loss and thermal expansion/contraction for wood, gypsum and insulation. In addition, the effects of temperature on thermal conductivity, specific heat, mass loss and thermal expansion/contraction of these materials are discussed. The report also identifies additional thermal property tests required to complete the matrix of information.
TEST DATA ON THERMAL PROPERTIES AT ELEVATED TEMPERATURES
The Fire Risk Management Program at the Institute for Research in Construction, NRC, has been engaged in applied materials research for many years.9 For the benefit of researchers and practitioners, this paper is a release of the results on measured thermal properties of components of wood-framed assemblies at elevated temperatures conducted at NRC. The thermal properties measured included the thermal conductivity, specific heat, mass loss, and thermal expansion/contraction of wood, gypsum, and insulation at elevated temperatures. The measurements were carried out using commercially available instruments. For the materials tested, the following information will be presented in detail:
• Graph showing the dependence of the thermal conductivity, k, on temperature T. The thermal conductivity, expressed in W/m°C, is defined as the proportionality constant between the rate of heat transfer and the product of temperature gradient across the solid and the area through which the heat is transferred.
• Calorimeter graph, showing the variation of the specific heat, cp, with the temperature
T. The specific heat, expressed in J/kg°C, of a material is defined as the amount of heat required to raise the temperature of one unit mass of a material 1°C. The specific heat of a material is usually temperature dependent. If, in addition, the material becomes unstable, i.e., undergoes a “reaction”, which can be exothermic or endothermic, the heat necessary to raise the temperature of the material is affected by the reaction heat contribution, which results in a peak in the specific heat versus temperature curve.
• Thermogravimetric graph, depicting the relation between the change in mass M/Mo,
expressed in %, and temperature T (where Mo is the mass of the material at room
temperature and M is that at a temperature T).
• Dilatometric graph, depicting the relation between the change in expansion or contraction ∆l/lo, expressed in %, and temperature T (where lo is a linear
measurement of the material and ∆l is the change in that dimension due to heating).
Description of Materials Tested
In this report, the thermal properties, at elevated temperatures, of wood, gypsum and insulation were measured. A brief description of these materials is listed in the table below (additional information can be found in reference 10). The available information on material identification (common name, density, composition, manufacturer, and any
other pertinent miscellaneous information) is provided, along with a list of which properties were tested. The materials are listed in the order in which they appear in the section showing the figures.
Table 1. Description of products tested
Type of Product
Description of Specimen Name of Specimen Property
Tested
Figure No.
Wood 5/8 Plywood a Plywood Thermal
Conductivity
1
Wood 2x4 SPF b Spruce 1 Thermal
Conductivity
1
Wood 2x4 SPF b Spruce 2 Thermal
Conductivity
1
Wood 2x4 SPF b Spruce 3 Thermal
Conductivity
1
Wood 2x4 SPF b Spruce 4 Thermal
Conductivity
1
Gypsum 12.7-mm Gypsum Board
Type Regular c
Gypsum Board 1 Thermal
Conductivity
2
Gypsum 12.7-mm Gypsum Board
Type Regular Heavy d
Gypsum Board 2 Thermal
Conductivity
2
Gypsum 12.7-mm Gypsum Board
Type X e
Gypsum Board 3 Thermal
Conductivity
2
Gypsum 15.9-mm Gypsum Board
Type X e
Gypsum Board 4 Thermal
Conductivity
2
Gypsum 12.7-mm Gypsum Board
Type Regular Light f
Gypsum Board 5 Thermal
Conductivity
2
Insulation Glass Fibre Insulation g Glass Fibre Thermal
Conductivity
3
Insulation Millboard Fibre
Insulation h
Millboard Fibre Thermal
Conductivity
3
Insulation Rock Fibre Insulation k Rock Fibre 1 Thermal
Conductivity
3
Insulation Rock Fibre Insulation k Rock Fibre 2 Thermal
Conductivity
3
Gypsum 12.7-mm Gypsum Board
Type Regular c
Gypsum Board 1 Specific Heat 4
Gypsum 12.7-mm Gypsum Board
Type Regular Heavy d
Gypsum Board 2 Specific Heat 4
Gypsum 12.7-mm Gypsum Board
Type X e
Gypsum Board 3 Specific Heat 4
Gypsum 15.9-mm Gypsum Board
Type X e
Gypsum Board 4 Specific Heat 4
Gypsum 12.7-mm Gypsum Board
Type X e
Gypsum Board 6 Specific Heat 4
Gypsum 12.7-mm Gypsum Board
Type X e
Gypsum Board 7 Specific Heat 4
Type of Description of Specimen Name of Specimen Property Figure
Product Tested No.
Type X e
Insulation Glass Fibre Insulation g Glass Fibre Specific Heat 5
Insulation Millboard Fibre
Insulation h
Millboard Fibre Specific Heat 5
Insulation Rock Fibre Insulation k Rock Fibre 3 Specific Heat 5
Insulation Rock Fibre Insulation k Rock Fibre 4 Specific Heat 5
Gypsum 12.7-mm Gypsum Board
Type Regular c
Gypsum Board 1 Mass Loss 6
Gypsum 12.7-mm Gypsum Board
Type Regular Heavy d
Gypsum Board 2 Mass Loss 6
Gypsum 12.7-mm Gypsum Board
- Type X e
Gypsum Board 3 Mass Loss 6
Gypsum 12.7-mm Gypsum Board
Type X e
Gypsum Board 6 Mass Loss 6
Insulation Glass Fibre Insulation g Glass Fibre Mass Loss 7
Insulation Rock Fibre Insulation k Rock Fibre Mass Loss 7
Gypsum 12.7-mm Gypsum Board
Type Regular c
Gypsum Board 1 Expansion 8
Gypsum 12.7-mm Gypsum Board
Type Regular Heavy d
Gypsum Board 2 Expansion 8
Gypsum 12.7-mm Gypsum Board
Type X e
Gypsum Board 6 Expansion 8
a
Plywood - Density = 489 kg/m3
b
Spruce-Pine-Fir - Density = 505 to 526 kg/m3
c
Type Regular Gypsum Board – Density = 572 kg/m3
d
Type Regular Heavy Gypsum Board – Density = 616 kg/m3
e
Type X Gypsum Board – Density = 654 to 733 kg/m3
f
Type Regular Light Gypsum Board – Density = 579 kg/m3
g
Glass Fire Insulation – Density = 10.5 kg/m3
h
Millboard Fibre Insulation – Density = 306 kg/m3
k
Rock Fibre Insulation – Density = 31.0 to 44.5 kg/m3
Test Specimens, Test Methods and Instruments
Test specimens for the determination of the thermal conductivity and the thermal expansion were prepared by cutting the material to appropriate sizes. Specimens for the determination of the specific heat were obtained by grinding a portion of the materials. The determination of the mass loss was obtained by cutting the material to specific sizes in some cases and by grinding the materials in other cases. To gather the data presented in this paper, the following methods and instruments were used.
Thermal conductivity: The presence of moisture may have a significant and unpredictable effect on the thermal conductivity of the material at any temperature below 100°C, and may in addition complicate the interpretation of the calorimetric, thermogravimetric, and dilatometric curves. It is imperative to conduct all thermal property tests on specimens brought into a moistureless “reference condition” prior to the tests. Therefore, all materials were dried in an oven at 40°C for 24 hours before testing.
The thermal conductivity of the materials was measured using a TC-31 Thermal Conductivity Meter made by Kyoto Electronics. This meter employs steady-state methods to determine thermal conductivity. The measurements were made in the temperature range between 20°C and 1100°C.
Specific heat: The specific heat was obtained employing differential scanning calorimetry. Test specimens weighing in most cases between 10 and 30 mg were conditioned at 40°C for 24 hours to drive off free moisture. The specimens were placed in a nitrogen atmosphere and tested using a DuPont Differential Scanning Calorimeter (DSC) for temperatures up to 700°C. The DSC measurements were carried out with mainly a heating rate of 5°C/min. Heating rates of 2, 10, and 20°C/min were also used to compare the change of rate on the specific heat. The specific heat was measured up to 700°C.
For materials that do undergo reactions, the specific heat was measured carrying out two runs, one with powdered sapphire (Al2O3) as the calibration material and one with the
sample. A stepwise heating program (namely, a period of constant material temperature followed by a period of temperature rise, which is followed again by a period of constant material temperature, etc.) through the temperature range from 400°C to 700°C, was used during the measurements.
Mass loss: All materials were dried and conditioned under a vacuum at 40°C for 24 hours before testing to drive off free moisture. The change in mass with temperature was determined using a thermogravimetric analysis. When grinding, the test specimens weighing in most cases between 10 to 40 mg were placed in a nitrogen atmosphere and tested by means of a DuPont 951 Thermogravimetric Analyzer (TGA) at a heating rate of 20°C/min. The test specimens cut in sections weighed between 20 to 50 g and were heated in an electric oven to determine their mass loss. The measurements were made in the temperature range from 20°C to 1000°C.
Thermal expansion/contraction: A Theta Dilatory Apparatus with a computer-controlled program was used to measure thermal expansion. The curves showing thermal expansion versus temperature were produced in the range from 20°C to 1000°C. The specimens tested were 30 to 40 mm long and 10x10 to 13x13 mm in cross-section. The rate of heating was 10°C/ min in static air from room temperature to 1000°C.
DISCUSSION OF TEST RESULTS
In the following paragraphs, a brief discussion of trends in the data obtained in the thermal property tests is presented. The thermal properties are also discussed and compared to each other to show the influence of the type of material.
Thermal Conductivity
Thermal conductivity is very sensitive to the microstructure of the material. It is strongly influenced by such factors as mineral composition, degree of crystallinity, impurities in the crystal structure, average grain size, grain orientation, and porosity. For this reason, materials referred to by the same generic name, such as gypsum products, may exhibit differences in their thermal conductivity. Most building materials can be regarded as mixtures of crystalline and amorphous formations. If a material is highly crystalline in
structure, its thermal conductivity is relatively high at room temperature, but gradually decreases with increase of temperatures. If, on the other hand, it is predominantly amorphous, its thermal conductivity is low at room temperature and increases slightly with an increase in temperature.
During testing, a weight is placed on the test specimen to hold it in place. At high temperatures, the weight may crush the specimen, thus preventing the development of fissures and the resultant heat transfer through them by both convection and radiation. Consequently, the thermal conductivity determined for high temperatures may be low. Results of the thermal conductivity measurements are presented in Figures 1 to 3.
Thermal conductivity of wood: Figure 1 shows the thermal conductivity for wood in a number of test specimens. For plywood, the thermal conductivity is almost constant between 40°C and 150°C, then sharply increases linearly from 150°C to about 300°C, after which there is a linear decrease until 525°C. For spruce 1 to 4, the thermal conductivity is linear between 40°C and 125°C, but does not show a consistent trend. For temperatures ranging from 125°C to about 200°C, the thermal conductivity starts increasing almost linearly, then decreases linearly between 200°C and 250°C, to finally increase after about 250°C for the test specimens that were continued for testing after charring. While the trend is similar for all tested specimens, the thermal conductivity data values vary in a band from a minimum of about 0.05 W/m°C to a maximum of approximately 0.19 W/m°C. A mean curve can be extracted for spruce by following the minimum and maximum thermal conductivity values for each specimen. The difference in thermal conductivity values can be attributed to differences in species (spruce versus plywood), grain direction and wood density, which can alter the heat propagation in the specimens.
Thermal conductivity of gypsum board: The thermal conductivity of gypsum board is shown in Figure 2 as a function of temperature. The thermal conductivity, for all test specimens, decreases almost linearly up to a temperature of 200°C, then shows a slight increase from 200°C to about 800°C, and finally shows a sharp increase especially after a temperature of 900°C. The thermal conductivity of gypsum board 1 is higher than that of the other materials in the temperature range of 40°C to 900°C. This can be attributed to the higher crystallinity of gypsum board 1 as compared to other materials. This can also be due to more cracks and propagation in gypsum board 1, which increases the rate of heat transfer in the specimen. The variation is in part also due to the fact that chemical formulation of the gypsum core varies from product to product. From the graph, the trend of the thermal conductivity of gypsum board can be best approximated by three regions (lines): a linear decrease up to 200°C, a constant value between 200°C and 800°C, and a sharp increase after 800°C.
0.00 0.05 0.10 0.15 0.20 0.25 0 50 100 150 200 250 300 350 400 450 500 550 Temperature (°C) Th e rm a l C o nd uc ti v it y ( W /m °C ) Plyw ood Spruce 1 Spruce 2 Spruce 3 Spruce 4
Figure 1. Thermal conductivity for wood
0.0 0.1 0.2 0.3 0.4 0.5 0.6 0.7 0.8 0.9 1.0 1.1 1.2 0 100 200 300 400 500 600 700 800 900 1000 1100 Temperature (°C) T h e rm a l C o n d u c ti v ity (W /m °C ) Gypsum Board 1 Gypsum Board 2 Gypsum Board 3 Gypsum Board 4 Gypsum Board 5
Figure 2. Thermal conductivity of gypsum board
Thermal conductivity of insulation: Figure 3 shows the thermal conductivity of glass fibre insulation, millboard fibre insulation, and rock fibre insulation as a function of temperature. The figure indicates that for millboard fibre insulation and rock fibre insulation, there is a gradual increase in the thermal conductivity as the temperature rises. A straight line or a gradual exponential curve can be fitted to the thermal conductivity
data for the temperature range considered (up to 1100°C). On the other hand, the thermal conductivity of glass fibre insulation increases similarly to rock fibre insulation from 0.022 W/m°C at 24°C to 0.204 W/m°C at 515°C. However, beyond 515°C, the glass fibre thermal conductivity increases very rapidly to 1.587W/m°C at 632°C. This increase is due to the insulation being consumed (melting), thus, allowing for the heat to go through it very easily. The thermal conductivity of glass fibre insulation can be approximated by an exponential function. In addition, the variation of the thermal conductivity among the rock fibre insulation specimens (rock fibre 1 and 2) is due to a change in the chemical composition of the fibre from one product to another.
0.0 0.2 0.4 0.6 0.8 1.0 1.2 1.4 1.6 1.8 0 100 200 300 400 500 600 700 800 900 1000 1100 Temperature (°C) The rm a l C o ndu c tiv ity ( W /m °C ) Glass Fibre Millboard Fibre Rock Fibre 1 Rock Fibre 2
Figure 3. Thermal conductivity for insulation Specific Heat
Materials that undergo exothermic reaction may yield negative values for the specific heat in certain temperature intervals, as shown in Figures 4 and 5. A negative value for specific heat indicates that at the applied rate of heating, the rate of evolution of reaction exceeds the rate of absorption of sensible heat by the material. In this case, the heat is not very high, and an adequate rise in the heating rate can prevent obtaining negative values for the specific heat.
Specific heat of gypsum board: The results of the specific heat of different (tests specimens) gypsum boards are shown in Figure 4, as a function of temperature. The curves were determined using the initial mass of the sample. For all the gypsum boards, the specific heat shows a peak at different temperatures, depending on the rate of heating. The peak in the apparent specific heat is an indication of the large quantity of heat absorbed in the calcination of gypsum and subsequent evaporation of water (dehydration of the gypsum board). The area under the peak gives the energy required to drive out the water from the gypsum boards. Heating rates of 2, 5, 10 and 20°C/min were used in the DSC measurements. Heating rates of 2°C/min and 20°C/min were used to compare the
effect of heating rate on the specific heat. It should be noted that in general, an increase in the rate of heating results in a shift of the peaks (nominal reaction temperature) towards higher temperatures and in a sharpening of the peaks. Indeed, for the boards tested at a heating rate of 2°C/min, the peak is at a temperature of approximately 100°C, while, for those tested at a heating rate of 20°C/min, the peak temperature is at about 140°C. The results also show that the specific heat peak values increase with a decreasing heating rate, and that for the same rate of heating, specific heat peak values may be different, which can be attributed to the difference in the gypsum board core composition. Further, for the temperature range outside the dehydration region (peak region), the specific heat of the gypsum boards does not vary too much (almost constant) and ranges between –0.6 and 1.0 J/g°C. Furthermore, the negative value for the specific heat is an indication that at the applied rate of heating, the rate of evolution of reaction exceeds the rate of absorption of sensible heat by the material. Increasing the rate of heating to higher values can prevent the occurrence of negative values. Finally, the specific heat can be approximated by linear fits as a function of temperature.
-5 0 5 10 15 20 25 30 35 0 100 200 300 400 500 600 700 800 Temperature (°C) S p e c if ic H e a t ( J /g-°C ) Gypsum Board 1 Gypsum Board 2 Gypsum Board 3 Gypsum Board 4 Gypsum Board 6 Gypsum Board 7 Gypsum Board 8
Figure 4. Specific heat of gypsum board
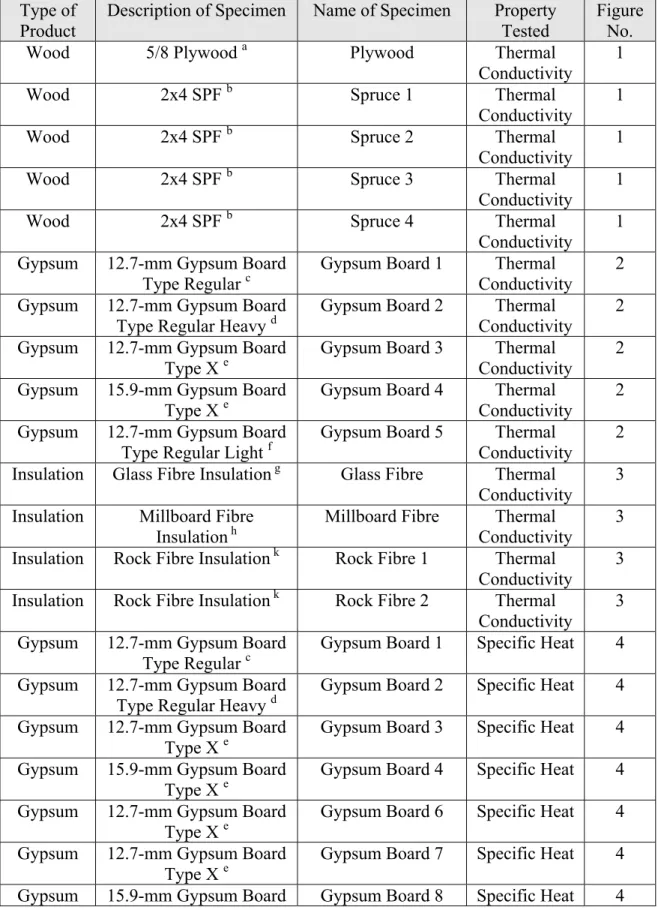
Specific heat of insulation: Figure 5 shows the specific heat of insulation versus temperature for a number of insulation materials. Measurements of the specific heat were conducted at a heating rate of 5°C/min. For all the insulation tested, there is a gradual increase in the specific heat up to a temperature ranging between 300 and 350°C. This is followed by a rapid decrease from roughly 330°C to 470°C, then by a rapid increase to 600°C, and finally a slight variation after 600°C. In the temperature range of 330°C to 600°C, there is formation of peaks, which is an indication of the amount of energy required to raise the temperature of materials. It should be noted, however, that as the insulation is heated, it generates heat (burning of the fibre glue) that may be higher than the applied heat, which explains the negative specific heat values. The peak is more
pronounced for rock fibre as compared to millboard fibre. For glass fibre, the specific heat does not show any peak value, which may be due to the early stop of the measurements. For this insulation type, the specific heat increases with temperature and reaches a maximum of approximately 0.8971 J/g°C at roughly 260°C, after which the specific heat decreases and reaches a value of 0.8764 J/g/°C at 350°C. In addition, rock fibre 3 and 4 insulation samples, weighing approximately 26 and 31 mg, respectively, were used to evaluate the reproducibility of the calorimetric curves at a heating rate of 5°C/min. The reproducibility was found to be reasonable but there is some deterioration at high temperatures, especially at the peak value and after 600°C. Finally, overall, there is some agreement in the trend and the difference in the specific heat data values may be attributed to the difference in the insulation composition. All of the specific heat curves can be approximated by linear or polynomial fits as a function of temperature.
-0.9 -0.7 -0.5 -0.3 -0.1 0.1 0.3 0.5 0.7 0.9 1.1 0 100 200 300 400 500 600 700 800 Temperature (°C) S p eci fi c H e at ( J/ g -° C ) Glass Fibre Millboard Fibre Rock Fibre 3 Rock Fibre 4
Figure 5. Specific heat for insulation
Mass Loss
As in the case of specific heat, an increase in the rate of heating usually shifts the reaction temperature to a higher level and narrows the temperature interval of the reaction in the thermogravimetric curves.
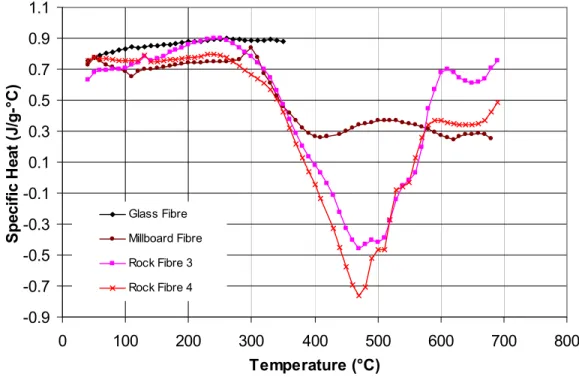
Mass loss of gypsum board: The test results from the TGA analysis are summarized in Figure 6 for all the gypsum boards tested. The mass loss remains almost unchanged up to 100°C. Between 100°C and 160°C, the mass loss of the different boards decreases between 15% and 17% as moisture is driven off. These results are reasonable as gypsum with no additives contains about 21% by mass of water. Between about 160°C and 650°C, the mass loss remains fairly constant, then it decreases, and again changes very little between 740°C and 1000°C. This trend can be approximated by a linear fit. In
addition, as stated earlier, with a lower heating rate employed, this mass loss would have occurred at lower temperatures.
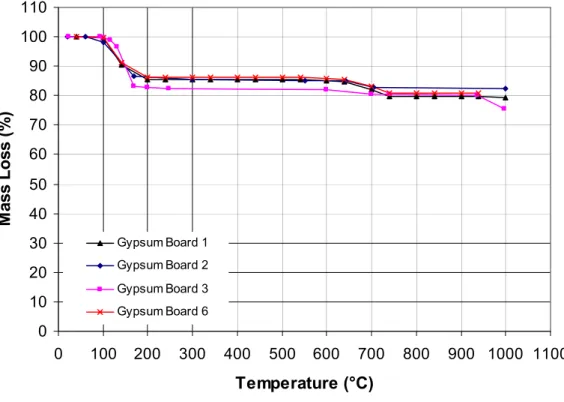
Mass loss of insulation: Figure 7 shows the test results of the mass loss ratio for insulation versus temperature. The mass loss of rock fibre insulation increases gradually from 0% (100% mass remaining) at 25°C to 6% (94% mass remaining) at 1000°C. The mass loss of the glass fibre insulation increases almost linearly with a temperature from 0% (100% mass remaining) at 36°C to 6% (94% mass remaining) at 310°C. After this point, it remains constant until it completely melts. As indicated on the figure, the insulation mass ratio is different for different test specimens due to their chemical composition and their melting point. The fast mass loss and substantial decrease in density for glass fibre insulation is caused by the dissociation and decomposition of components in the insulation in the early temperatures. The mass loss versus temperature graphs can be approximated by linear fit curves.
0 10 20 30 40 50 60 70 80 90 100 110 0 100 200 300 400 500 600 700 800 900 1000 1100 Temperature (°C) M a ss L o s s ( % ) Gypsum Board 1 Gypsum Board 2 Gypsum Board 3 Gypsum Board 6
0.90 0.92 0.94 0.96 0.98 1.00 1.02 0 100 200 300 400 500 600 700 800 900 1000 1100 Temperature (°C) M a ss L o ss Glass Fibre Rock Fibre 1
Figure 7. Mass loss of the insulation
Thermal Expansion/Contraction
Thermal expansion/contraction of gypsum board: The variation of thermal contraction with temperature for gypsum boards tested is depicted in Figure 8. Both gypsum boards 1 and 6 exhibit almost the same behaviour with gypsum board 6 showing slightly less contraction. They shrink very slowly up to 350°C, then between 350°C and 450°C, the contraction is more rapid, and it slows down again up to 900°C. From 900°C to 1000°C, the contraction is very rapid. On the other hand, gypsum board 2 experiences more contraction than gypsum boards 1 and 6 throughout the temperature range between 30°C and 1000°C. The differences in the values of the thermal contraction of the gypsum boards can be attributed to the change in chemical composition from one test specimen to another, which affects the temperature at which the dissociation of components in each material. The differences may also be due to the time and duration of dehydration for each specimen. Although, for all types of gypsum boards tested, the impact of contraction on the density of the gypsum is not great (see Figure 6), the contraction at high temperatures has a profound influence on the heat transfer in wood-framed wall and floor assemblies. The contraction is responsible for the development of cracks and fissures in the board, as well as for the opening up of joints between boards in full-scale test specimens, the occurrence of which may lead to the premature failure of wood-framed wall and floor assemblies. In addition, the temperature dependence of the thermal contraction of gypsum boards can be approximated by linear fits.
-25 -20 -15 -10 -5 0 5 0 100 200 300 400 500 600 700 800 900 1000 1100 Temperature (°C) Th e rm a l C o nt ra c tion ( % ) Gypsum Board 1 Gypsum Board 2 Gypsum Board 6
Figure 8. Thermal expansion/contraction of the gypsum board
SUMMARY
Traditionally, the fire resistance of construction members has been determined by testing methods, which have drawbacks, including high cost and time requirements, limitations of the specimen geometry and loading, effect of restraint and reproducibility. Hence, they should be conducted mainly to validate the outcome of a fire resistance method, to assist in developing new methods, or to permit studies of the effects of variables on the performance of materials. In recent years, the use of analytical and numerical methods for predicting the fire resistance of structural members has been gaining acceptance. These calculation methods are becoming more popular and may well serve the needs of performance-based codes, under which any type of exposure could be considered. However, in order to develop calculation methods and facilitate their use, the building material properties at elevated temperatures are required.
For wood-framed assemblies, these material properties are affected by temperature, moisture content, density, and grain orientation. Thermal properties, at elevated temperatures, are important for defining the heat transfer behaviour of, as well as the temperature distribution inside assemblies. This definition is also critical to an accurate assessment of the structural behaviour. The thermal properties include, thermal conductivity, specific heat, mass loss and thermal expansion or contraction. Many researchers have reported values for these thermo-physical properties of the different components of the assembly, i.e., wood, lining and insulation, either based on experimental tests or on best fitting from numerical analysis. The literature has shown that the information available to describe these properties is limited, and when it does exist, it is often inconsistent and scattered.3
To verify the models for fire resistance behaviour of wood-framed assemblies, NRC has carried out a number of tests on thermal properties of components of lightweight wood-framed assemblies, the results of which are reported in this paper. The data presented in this study can be used as input into existing computer programs to determine the behaviour of wood-framed assemblies at elevated temperatures.
Based on the experimental data presented, the following points can be summarized:
• The thermal conductivity of wood, gypsum board and insulation shows a general trend as a function of temperature.
• The thermal conductivity of glass fibre is generally higher than that of rock fibre, especially after 500°C.
• The specific heat of gypsum board exhibits a peak value, as an indication of the considerable amount of heat needed to dehydrate the water in the gypsum. Hence, the gypsum board plays a major part of fire resistant wood-frame assemblies, as it retards the failure of the assembly until, at least, the drying process of the gypsum is complete. The temperature at which the peak occurs depends on the rate of heating.
• The specific heat of insulation also exhibits a negative peak value as an indication of the heat released due to the burning of the insulation fibre glue.
• The mass loss of gypsum board occurs most in the temperature range between 100°C and 160°C. The maximum mass loss observed was 24.5% at 1000°C.
• The mass loss of glass fibre is significant before reaching a temperature of 300°C. On the other hand, the mass loss in rock fibre is spread over the temperature range of interest (1000°C).
• The thermal contraction of gypsum board is gradual up to about 800°C, after which the contraction becomes more significant.
• In all the tests conducted, the chemical composition of the specimen had an effect on the thermal property tested.
Finally, it should be noted that some of the materials were not tested for some thermal properties. In the next phase of testing, the matrix of thermal properties of different components of wood-framed assemblies will be completed.
CURRENT AND FURTHER RESEARCH
At present, studies are in progress, to complete the matrix of data for thermal properties at elevated temperatures and to develop mechanical properties for wood and gypsum at elevated temperatures. The data on thermal and mechanical properties will be used to develop thermal and mechanical relationships, as a function of temperature, for wood, lining material and insulation material. These relationships can be used as an input to numerical computer models, which can be used to predict the behaviour of structural lightweight wood-framed assemblies at elevated temperatures. The development of computer models is ongoing at NRC, for the calculation of fire resistance of lightweight wood-framed wall and floor assemblies. Along with this, full-scale tests on wood-framed walls and floors are being carried out to verify the computer models. These computer models will be used to conduct detailed parametric studies to determine the influence of various parameters, such as wood strength, load intensity and stud/joist spacing on the fire resistance of lightweight wood-framed assemblies. Results from the parametric studies will be used to develop simplified design equations and guidelines for predicting the fire resistance of lightweight wood-framed assemblies.
ACKNOWLEDGEMENTS
The research presented in this paper is part of a partnership between the National Research Council of Canada and Forintek Canada Corp.
NOMENCLATURE
ρ = Density
cp = Specific heat
k = Thermal conductivity
l = Length of sample at temperature T
lo = Original length of sample
M = Mass of sample at temperature T
Mo = Original mass of sample
T = Temperature
REFERENCES
1 CAN/ULC-S101-M89, Standard Methods of Fire Endurance Tests of Building
Construction and Materials, Underwriters' Laboratories of Canada, Scarborough, Canada, 1989.
2 ASTM E119, Standard Methods of Fire Tests of Building Construction and
Materials, American Society for Testing and Materials, Philadelphia, USA.
3 National Building Code of Canada, Canadian Commission on Building and Fire Codes, Institute for Research in Construction, National Research Council of Canada, Ottawa, Canada, 1995.
4 Richardson, L.R., McPhee, R.A., and Batista, M., “Sound-Transmission Class and Fire-Resistance Ratings for Wood Frame Floors”, Fire and Materials, 24, (1), pp. 17-28, 2000.
5 Takeda, H., and Mehaffey, J.R., “WALL2D: A Model for Predicting Heat
Transfer Through Wood-Stud Walls Exposed to Fire”, Fire and Materials, 22, pp. 133-140, 1998.
6 Bénichou, N., and Sultan, M.A., "Fire resistance behaviour of lightweight framed construction," SiF 2004 Third International Workshop on Structures in Fire, Ottawa, Ontario, Canada, pp. 119-136, May 2004.
7 Sultan, M.A., and Bénichou, N., “Fire resistance performance of lightweight floor assemblies," Designing Structures for Fire Conference, Baltimore, MD, pp. 203-214, October 2003.
8 Bénichou, N., and Sultan, M.A., "Fire Resistance Performance of Lightweight Wood-Framed Assemblies," Fire Technology, 36, (3), August, pp. 184-219, 2000 9 Harmathy, T.Z., “Properties of Building Materials at Elevated Temperatures,”
DBR Paper No. 1080, Division of Building Research, National Research Council of Canada, Ottawa, Canada, 1983.
10 Bénichou, N.; Sultan, M.A., MacCallum, C.; and Hum, J., “Thermal Properties of Wood, Gypsum and Insulation at Elevated Temperatures”, Internal Report,
Institute for Research in Construction, National Research Council Canada, 710,