STORAGE
by
John Theodore Roosevelt Nickerson S. B., assachusetts Institute
1932
Submitted in partial fulfillment of
of Technology
the requirements for the degree of
Master of Science from the
Massachusetts Institute of Technology 1934
Department of Biology ahd.Public Health
Signature of the Author'.
Professor in Charge of Research..
.... -- - - - --- -.-.-. --- --Chairman of Departmental n Graduate Committee.. Head of Department... .-
-13
MAY1935 WLBRAR 9.. ... * - 9 - - --TABLE OF CONTENTS
INTRODUCTION:
Purpose ... .. ... ,.
Manner in which the problems were selected REVIE7 OF THE LITERiATURE
Sterility of living animal tissues,... Decomosition of fish muscle due to the
action of enzymes and bacteria...
Refrigeration of fish.,... Plastein formation.,...,...
The-use of toluene as a disinfectant... The effect of low temperatures on enzymes. Methods for the aseptic isolation of fish
muscle... ... ... ..
Methods to determine biochemical changes in protein substrates..
EXERIME\TTAL WORK AND RESULTS
To determine wihether or not fish muscle is sterile:
lethods used.. ,... ...
To determine whether or not bacteria are present in fish blood:
LMethods used...
Results...,,,... ...
Proteolytic changes in fish muscle during incubation at different temperatures: i.ethods used. .,... . ... ,.... 2005411 4 10 13 16 19 20 21 23 35...45 38.. .46 48 49 50 .. 0 . . . .
Results: Van Slyke and electrometric titration values for enzyme and bacterial action on fish muscle.
Muscle held at 00... 58 Muscle held at 4 50 ... 60 Muscle held at + 100 C0...*... .* 6 2
LMuscle held at + 170 C.,...,, 01
Formol titration and
electro-metric titration values for enzyme and bacterial action on fish mtuscle.
Muscle held at 0o .. 66
Iuscle held at + 50 a...,...,..,. 68 Mtuscle held at 4 0 C0... 70 T.uscle held at + 150 C... 72
Ammonium nitroCen and electro-metric titration values for enzyime
and bacterial, action on fish muscle,
7uscle held JI 4- 7 C... 74
Muscle held at 4 1000... 7
uscle held at 4 15 0... 70 Percentage Curves:
Van Slyke values for enzyme action on fish muscle...
Van Cvlc values for bactrial action
on fish. uscl...
Ammoniuma nitrogen values for cnzymie
action on fish muscle... 24 Aonium nitrogren values for
bacter-ial action on fish muscle. .
Relative values of certain kinds of commercial ice when used to refri:-erate fish:
1:ethods used.... ...
Results... .. . .. . ... .. 90
The effect of lowy temperatures on enzymes: LHethods ... ... 96
Pae plastein formation:
7Methodsus d . . . .. . . . .. 9
Results... *... 100
Toluene as a disinfectant to stop the growth of bacteria in fish muscle mashes: Lethods used.. .*.*.... ... 101
Results ... , ... . ... . .102
DISCUSSION OF RESULTS: Sterility of fish tissues... 104
Sterility of fishblood... 1o6 The decomposition of fish incubated at different temperatures... 10
The relative values of certain biochem-ical tests to determine the proteo-lysis of fish... 111
G ener'al.. . .. ... .. .. . .. .. . .. . . . .. ... * . 1 12 Changes in the pH of fish muscle during incubation at different temratures 115 The value of certain kinds of commercial ice when used to refrigerate fish,.. 116
The value of toluene as a disinfectant to stop bacterial action in fiph muscle...*... 118
A THEORY OF THE CAUSE OF THE DECREASE IN A.INO ACIDS IN THE LATER STAGES OF THE INCUBATION OF STERILE HUSCLE ... ... -- --. 119
CONCLUSIOiS...--- 122
SUGGESTIONS FOR FUTURE 2 O ... *... 124
APPENDIX...- - - - -- 126 BIBLIOGRAPHY...-.-.- -0..---.. I
PURPOSE
The purpose of this thesis is threefold.- Firstly to determine whether bacteria are normally present in the living tissues of healthy haddock,(Melanogrammus aeglifinus).
Second-ly an investigation of the biochemical changes which take place
in haddock muscle during storage, due to enzyme and bacterial action. The third section is concerned with a somewhat un-related yet timely investigation to determine the value of cer-tain kinds of commercial ice as a means of lowering the temper-ature of fish.
THE MANNER IN WHICH THE PROBLEMS WERE SELECTED
Many investigators have found that the musculature
of normal healthy fish remains sterile until several hours af-ter death. More recent work in this field has led to the
con-clusion that bacteria may be found in the tissues of, at least, a small percentage of appartently normal fish. After
considering the more recent work the author decided that a
further investigation of the sterility of fish muscle might contribute something of value.
Several investigators have carried out experiments
to determine the role of enzyme action in the decomposition of haddosk muscle. Excepting the work of one investigator, tol-uene has been used as a disinfectant, to kill or stop further
growth of bacteria in the fish muscle. In view of the fact that certain workers have found that toluene does not inhibit bacter-ial growth to such a degree as to warrant its use in such a man-ner, it is difficult to make any conclusion as to the signifi-cance of enzymes in the decomposition of haddock muscle. It occurred to the author that, should the haddock muscle prove to be sterile, this sterile muscle might be used in an endeavour to obtain~ further facts concerning.the role of enzymes in the
de-composition of haddock muscle.
All previous researches on the problem of bacterial decomposition in fish muscle, as shown by biochemical changes, have been carried out with the u-se of ground muscle, in flasks. It seemed possible that such methods might give different re-sults from those which would be obtained by taking the muscle from the fish itself, without masceration, as it is required for each observation. It was believed that the latter method would give a more representative picture of bacterial decomposition as it takes place in the dead fish.
The temperature at which fish are held is very im-portant since both enzyme and bacterial action are involved in their decomposition. In many cases a few hours at a temperature that is too high, and such conditions are often brought about by poor iceing, may result in sufficient decomposition to make the difference between a fresh fish and a slightly stale fish. It was believed, therefore, that something of practical value might be learned from an investigation of the refrigeration value of
LITERATURE DEALING WITH THE STERILITY OF LIVING TISSUES The greater part of the work dealing with the ster-ility of muscular tissues has been carried out on warm-blooded animals.
Fedor(18), in 1884, injected saprophytic
micro-organisms into the blood of living animals and was unable to re-cover them from the blood several days after the injection. He concluded that the blood and organs of warm-blooded animals are able to destroy bacteria, and that the tissues are probably sterile.
Hauser's, (29), work in 1386 would seem to show
that the musculature of healthy, warm-blooded animals is sterile. In 1896, Neisser, (41), using mice, rabbits, and
guinea pigs was unable to isolate bacteria from the flesh of the normal animals.
Opitz, (44), in 1898, found that the muscle and a large percentage of the glands, (liver, kidney, spleen and lungs),
of freshly slaughtered'dattle and calves are sterile.
Selter, (55), in-his work of 1906, concluded that the liver, spleen and kidneys of normal animals are sterile.
Messner, although he examined 145 samples of the
flesh of numerous freshly slaughtered animals, was unable to find bacteria in any of them.
In 1911, Zwick and Weichel,
(80),
examined 59 samplesis sterile.
Grunt, (26), in 1912, found bacteria in only 10 per cent of 540 muscle samples from slaughter animals.
Conradi, (12), in 1909 is the first reference that we have to report results contrary to the work already cited. He examined 150 samples of the muscle, liver, kidneys, lungs, lymph nodes and spleen of slaughtered cattle and hogs and obtained bacteria in 72 of these samples.
Amako, (3), 1910, using the technique of Conradi,
ex-amined 22,samples each of the muscle, liverspleen and kidneys of cattle and obtained bacteria in 48 of these samples. Six, or
27.2 per cent of the muscle samples were found to contain bacter-ia.
In 1910, Bierotte and Machida, (6), found bacteria in
59 per cent of their samples from the muscle, kidneys, liver and
spleen of cattle.
Bugge and Kiessig, (9), 1911, used 241 muscle samples from 66 freshly slaughtered cattle and obtained bacteria from 36
of these samples, or in 54.5 per cent of thie animals.
Galippe, (22), in 1918, working with muscle samples from cattle that had been slaughtered only two or three hours, found that bacteria were present in a large percentage of such samples.
Bugge and Kiessig, (10), in 1919, repeated their
work of 1911. Their experiments showed that 64 samples, out of
In 1926 Reith, (49), carried out a very thorough re-search on the sterility of hog muscle. All of the samples used
by Reith were obtained less than one hour after the animal had
been slaughtered. Bacteria were obtained from 77 per cent of
216 samples. Cultures of the musculature of healthy living hoga,
rabbits and guinea pigs showed the presence of bacteria in 83
per cent of 108 samples. Thirty-eight samples from the blood of these animals were found to contain bacteria in 84 per cent of
the cultures taken.
It is difficult to draw~i any definite conclusion from
the results of the above investigators. A number of workers
have found that there are no bacteria in the musculature of nor-mal, living animals while just as many research workera have
found that bacteria are present in a large percentage of the sam-ples examined. It would appear, however, that the more recent workers have all reported the presence of bacteria in the tissues of'normal, living animals. The consensus of present day opinion would, therefore, seem to support the idea that bacteria are
normally present in the musculature and tissues of normal,living
mammals.
In considering the question of whether or not the mus-cle of fish is sterile during life we are apparently dealing with with a different problem from that in the case of warm-blooded animals. As has been already pointed out, the evidence, for and against the concept that the living tissues of mammals are
evidence, almost without exception, supports the idea that the
muscle of living fish is sterile.
Browne, (8), in 1918, concludes that fish muscle is sterile and that autolysis, rather than bacterial action, seems to play the most important part in the initial decomposition of fish.
Hunter, (35), in 1920, working with four species of Pacific Coast salmon; the sockeye, (Onchorhynchus nerka), the
humpback, (0. gorbuscha), the silver or coho, (0. kisutch), and
the chum or dog salmon (0. keta); concluded that both the flesh from the dorsal and ventral sides of the fish is sterile if
ex-amined within two hours after the fish is caught.
In 1926, Harrison, Perry and Smith, (28), examined the flesh of eight haddock and found that it was sterile up to three hours after being caught.
Fellers, (19), in 1926, examined the muscle of 252
Pacific Coast salmon and found the flesh of those freshly caught to be sterile. He also found that the stomach and
in-testines, of those well advanced in their spawning migration, were usually sterile.
In 1930, Stewert, (59), exaained 3 codlings. The
fish were placed in a sterile box and conveyed to the
labora-tory as soon as possible after being caught. From these
eight codlings 143 cultures were made and in only 5 of these cultures were bacteria obtained. These 5 organisms were found to be similar to those normally found in the slime of fishes and were regarded as accidentical contamination.
Stewart also examined the bacterial flora of the slime, gills, etc., of 19 haddock and was able to isolate a spore forming
bacterium of the'Mesentericus group, (see Gee), only once.
Gee, (23), (24), 1927 and 1930, is the only worker, to whom we have reference, who concluded that there are bact-eria in living fish muscle. He found, in 1927, that he was con-sistently able to isolate a spore forming rod of the Mesenter-icus type, from the flesh of freshly caught and spoiled haddock.
In 1930 Gee examined the muscle of the following
fish:
Species No. of individuals
Dogfish...*...*. *.* 0..0 .00...0.0.0 * 0a0....
Squirrel hake (Urophycis chuss)...
Silver hake (Merluccius bilinearis)...
From the above Gee obtained bacteria from the
of 2 dogfish, 1 cod and 2 haddock, The number of sample from each fish is not given in Gee's paper so that the a
3 4 3 6 1m . 1 1 8 muscle s taken ctual
percentage of positive cultures cannot be determined, Suppos-ing, however, that only one sample were taken from each fish,
10.
LITERATURE CONCERNING THE DECOMPOSITION OF FISH MUSCLE DUE TO ENZYMATIC AND BACTERIAL ACTION
Rusconi found that much more tyrosine was obtained when fish, (tench), were allowed to decompose under anaerobic conditions, than was found under aerobic conditions.
Almy, (2), in 1926, showed that decomposition in
herring is chiefly due to trypsin from the pyloric caeca. He found that the flesh of "feedy" fish was also invaded by bact-eria. Bursting of the stomach, which is the cause of consider-able trouble in catches of small herring, was shown to be due to enzyme action rather than bacterial action.
Reed, in 1926, found that the hydrolysis of fish muscle, in which toluene had been used to inhibit the
bacter-ial action, was at first slow and then increased rapidly. Fish muscle in which bacteria were allowed to develop showed approximately the same amount of hydrolysis for the first six-teen to eighsix-teen hours after which it increased rapidly over that of the toluene muscle mixture.
Reed, Rice and Sinclair, (48) , in 1929, used the
toluene method of Reed to follow the hydrolysis of haddock, lob-ster and clam muscle due to enzyme and bacterial action. They found that after 24 hours the non-coagulable nitrogen had
in-creased 43 per cent in the lobster, 45 per cent in the clam and
only 6.4 per cent in the haddock. These values were taken to be representative of the amount of hydrolysis due to enzyme action.
de-composition greatly and was shown to be similar, in extent, in the lobster and the clam, but much slower in the haddock.
The freshly mascerated muscle of the haddock had a pH of 6.1 to 6.5 with an average of 6.3. During incubation there
was no definate pH change. In the infected muscle the pH
reach-ed 7.0 in about 24 hours and only very slowly became more
alka-line.
Wynne, in 1929, (78), showed that more hydrolysis took place in fresh muscle to which trypsin had been added, than in smoked, salted or dried muscle which was treated in a similar manner. He was unable to demonstrate that the size of the
par-ticles of fish muscle had any affect on the rate of hydrolysis due to enzyme action.
In 1929, (50), Rice found that certain bacteria,
which are commonly found on fresh fish, (Achromobacter and Pseudomonas) when grown upon fresh and autolyzed clam muscle, bring about no increase in the amount of non-coagulable nitrogen, but rather, a marked decrease, She concluded that this type of bacteria is able to use only the products of protein hydrolysis
and unable to utilize the native protein. In-the case of the Bacillus, first a decrease in non-coagulable nitrogen was ob-tained and then an increase, which would appear to show that Bacilli are capable of splitting native protein.
In 1930, Gibbons and Reed, (25), made determinations on the ammonium nitrogen and non-coagulable nitrogen formed in aseptically collected muscle and in infected muscle. They
12.
found that in the sterile muscle the non-coagulable nitrogen in-creased slightly during the first 24 hours, followed by a similar increase in 48 hours. The increase in ammonium nitrogen was
found to be proportionally greater in the sterile muscle in 24 hours than was the increase i.n non-coagulable nitrogen. After 48 hours the increase in ammonium nitrogen was noticeably
great-than at the 24 hour period.
The increase in both ammonium nitrogen and non-coag-ulable nitrogen in the infected muscle was found to be much greater than in the case of the -sterile muscle. After 48 hours this difference was much more noticeable than at the 24 hour period.
Wynne, (79), in 1932 found that practically no
auto-lysis took place at temperatures from 30 to 36 deg., F. He
found that bacterial decomposition and bacterial growth rate at
LITERATURE CONCERNING THE REFRIGERATION OF FISH
Stiles, (60), in an excellent report dealing with the refrigeration of foods, has brought our many important points which are essential to a thorough investigation of the subject. The factors considered by Stiles to be important in the refriger-ation of fish are outlined below: internal factors; depending up-on the thermal cup-onductivity, specific heat, density, and specific surface of the body to be cooled. Exernal factors; dealing with the temperature, conductivity, specific heat, and density of the
cooling medium.
Fish muscle io composed of approximately
8o
per centwater and due to that fact the thermal conductivity of fish mus-cle does not differ appreciably from that of water.
The specific heat of a substance is defined as the quantity of heat required to raise the temperature of a unit mass of the substance 1 0. It is obvious, then, that when dealing with two substances which differ in their specific heat values, the temperature of the substance with the lower speci-fic heat will fall further, under the same identical conditions of refrigeration, than will the temperature of the substance with the higher specific heat.
The rate at which heat is taken from a substance is inversely proportional to the density of that substance.
Therefore, the greater the density of the substance to be cool-ed, the greater the amount of refrigeration required to lower the temperature of that substance to a given temperature.
The specific surface, that is, the amount of sur-face per unit pass of the substance to be cooled, is an import-ant factor upon which the cooling time always depends. The greater the amount of exposed surface the greater the area from which heat can be taken; similarly, the greater the surface the shorter the distance to the center of the body to be cooled. Under the same conditions of refrigeration substances with large surface areas cool more quickly than those with smaller surface areas, provided that all are of the same material and weight.
The thermal conductivity of the cooling medium is vastly important due to the fact that there are great variations In the thermal conductivities of cooling media. Gases have a low thermal conductivity and therefore carry away a
comparative-ly small amount of heat. Cooling by air is an inefficient
pro-cess due to the low thermal conductivity of air. Solids, es-pecially those which contain much water, and metals, on the
other hand, have a high thermal conductivity. For this reason liquids and metals make the most efficient refrigeration mediums.
Contrary to the case of the body to be cooled, the higher the specific heat of the cooling medium the more effic-ient is the medium as a refrigerant.
This is explained by the fact that the temperature of that part of the cooling medium immediately surrounding the body to be cooled is raised less, if this medium has a high specific heat, than it is if the specific heat of this medium is low.
The greater the specific gravity of the cooling med-ium the smaller the rise in temperature of this medmed-ium due to the absorption of a given amount of heat. For this reason it is well to choose a cooling medium with a high specific gravity.
Heat must be carried away from a body by conduction, convection, radiation, or some combination of these three factors. When a warm body is placed in a colder medium, heat is withdrawn
from this body until the temperature of the whole system becomes alike throughout. Conditions at the surface of the body to be cooled differ from those in the interior of the body. The con-ductivity of the external, cooling medium governs the rate at which heat is carried away from the surface of the body to be
cooled, while the conductivity of the cooled body itself governs the rate at which heat is carried away from the interior of that body.
When a body is cooled from one temperature to another without a change in phase, supposing the temperature to be
con-stant throughout the body at the outset, the temperature grad-ually falls, but, the rate at which the temperature of the
cool-ed body approaches that of the external cooling mcool-edium dimin-ishes progressively,
16.
LITERATURE DEALING WITH PLASTEIN FORMATION
It is generally believed, to-day, that enzymes are capable of synthesizing complex compounds from the hydrolytic products of these compounds. Many enzyme reactions have been shown to be reversible and it is quite possible that all enzyme reactions are reversible reactions,
Danilewski, (14), in 1866, is said to be the first investigator to report the formation of plastein by enzymes, Sawjalow, (54)1, is said to be the first to give the phenomenon the name of "plastein formation".
Robertson, (51), in 1907, was able to obtain a sol-id substance from a peptic digest of casein which he named para-nuclein formation. He believed this to be an enzyme synthesis.
Taylor in 1907, (62), described the synthesis of the protein protamin through the action of trypsin on the hydrolytic products of protamin hydrochloride. He obtained the trypsin from the livers of the soft shell California clam.
Henrique and Gjaldbak, (31), were able to show that a solid substance, a typical plastein which did not gelatinize, is formed by the action of pepsin and trypsin on peptic and tryptic digests. They found that the amino acid content of these digests decreased during plastein formation while the free ammonia content of the same digests did not change. They, therefore, concluded that anonia takes no part in the synthesis.
Wasterneys and Borsook, (71), in 1924, confirmed the work of Henrique and Gjaldbak. They concluded that the
sub-stance synthesized by peptic action is of the order of complexity of native protein. They consider peptic activity to be revers-ible, a linkage being synthesized in concentrated solution
which is hydrolysed in dilute solution.
Wasterneys and Borsook, (72), in a later article show-ed that up to the point of destruction of the enzyme, (pepsin), increasing amounts of protein are formed with increasing
temper-atures at the optimum pH of 4.0.
In their third paper on the subject Wasterneys and Borsook, (73), showed that the amount of protein formed in a pepsin synthesis is partially dependent upon the concentration of the enzyme.
In 1925, Wasterneys and Borsook, (74), showed that no synthesis takes place when the concentration of the enzyme lies between 4.0 and 0.05 per cent. The addition of synthesized pro-tein or of native propro-tein to the solution of the digest and pep-sin was found to inhibit the synthesis as would be expected
according to the laws of mass action.
'Rona and Chrometzka, (52), in 1927, found that when a
protein splitting enzyme is incubated with its hydrolysate a plastein is formed and that there is a corresponding decrease in amino nitrogen. They are of the opinion that no true protein synthesis takes place since they found that ammonia increases
simultaneously with the increase in amino nitrogen. They
be-lieve, therefore, that the decrease in amino nitrogen is due to
18.
number of carboxyl groups was found to remain unchanged.
Cuthbertson and Tompsett, (13), found that there is
no appreciable liberation of ammonia during the formation of
plastein. They showed that there is a corresponding decrease in
the amino and carboxyr groups of the 'amino acids' during' the'
process of plastein--formation. Their work, like that of
Henri-ques and Gjaldbak s , would tend to nullify the results of Rona
and Chrometzka.
The consensus of scientific opinion appears to sup-port the idea that enzyme syntheses of protein do take place. In view of the ease with which certain carbohydrates,(b-methyl-glucosides, etc.) and esters, (butyl acetate, etc.) may be syn-thesized in the laboratory with the help of specific enzymes, it seems logical to conclude that protein syntheses are just as possible when optimum conditions for temperature, enzyme con-centration, substrate concon-centration, pH, etc., are afforded.
LITERATURE DEALING WITH THE USE OF TOLUENE AS A DISINFECTANT
In 1912, Wells and Cooper, (75), showed that spore
forming bacteria, such as Bacillus subtilus, held in pure
tol-uene, were still viable after a period of 10 days.
Benians, (4), in 1913, stated that the tubercle
bac-illus is killed if shaken for :1 hour in a solution containing 10
per cent of toluene. B. coli was killed. in 4 hours by the same
method. It required 17 days of this treatment to kill Staphlo-coccus aureus.
Dewitt- and Sherman, (15), in 1914, found that toluene has only slight disinfecting powers.
Waksman and Davidson, (69), state that toluene is a good disinfectant to use as a means of inhibiting bacterial
growth during'enzyme hydrolyses provided that the containers
used in the process are sterile.
Parker, (45), in 1928, found toluene to be useless as a disinfectant to inhibit bacterial growth during enzyme
hy-drolyses due to the fact that the enzyme preparations were
heav-ily contaminated with different types of bacteria.
Reed, in 1926, and Reed, Rico and Sinclair, (43), in
1929, used toluene as a means of inhibiting bacterial growth in
ground fish muscle. They found that while all the bacteria were
not killed by this method, there was no great increase in the number of bacteria during several days incubation.
20.
LITERATURE CONCERNING- THE EFFECT OF LOW TEMPERATURES ON ENZYMES According to Hepburn, (32), enzymes survive low temp-eratures and are able to carry out their,.usual'hydrolyses when the temperature is raised the right amount and other conditions are
0 favorable. He. kept lipase for 89 months at a temperature of -9.4
0 0
to. -12 0., pepsin, trypsin, and rennin at a temperature of -191
C., for 45 minutes or more and was unable to show that there was
LITERATURE DEALING WITH THE ASEPTIC M2ETHODS OF ISOLATING FISH MUSCLE
In 1926, Hunter, (35), used the following method to isolate fish muscle aseptically. The body of the fish was thor-oughly washed in alcohol and the alcohol was burned off. With instruments sterilized by flaming in alcohol,.a small flap of skin just posterior to the dorsal fin was carefully lifted and pinned back. A portion of muscle.weighing approximately one gram was cut out with a sterile scalpel and transferred to a sterile flask. Sterile glass and sterile physiological salt
solution.were then added and. the whole shaken until the muscle
was disintegrated. The suspension of tissues was then diluted
and plated out. Samples of flesh were taken from the belly in
the same manner.
Harrison, Perry, and Smith, (28), in 1926, used a method which differed considerably from that of Hunter.. The
room was shut up during operations. Tables were washed with a
1/1000 solution of mercury bichoride, clean aprons were worn by
the operator and the hands and arms of the operator were washed with alcohol or mercury bichoride solution. All instruments and utensils were sterilized with flaming alcohol. The fish was
wiped with alcohol and flamed. It was then placed on the table
and the skin was cut and fastened back. 5 grams of the flesh
were then removed to a sterile mortar, 5 grams of sterile sand Were added and the flesh was mascerated with a sterile pestle.
22.
muscle. Plates and dilutions were made from this material.
Gee, (23), in 1930, used live fish brought to the
laboratory in a tub of salt water. The fish were stunned with
a blow on the head. The area from which the sample was to be
taken was charred with a blowtorch and removing the burned sur-face tissues, pieces of muscle about 1/10 grams in weight were cut out with sterile scalpels and transferred to 5 cc.'portions
of sterile fish broth in tubes. Counts were made from the in-cubated broth tubes on fish agar.
Gee first sterilized his instruments by dipping them in alcohol and then burning the alcohol off, he found., however, that this treatment did not always sterilize the instruments and was forced to abandon this method.
Stewert, (59), in 1930, had his fish transported to the laboratory in a sterile box shortly after they were caught. The exterior of the fish was sterilized with a solution of 0.5 per cent crystal violet and 0.5 per cent brilliant green in 50 per cent alcohol. The fish were immersed in this solution for
20 minutes and then removed and allowed to dry slightly. An
incision was then made close to the vertebral column with a sterile scalpel and a flap of tissue was turned back. A port-ion of flesh, approximately 1 gram in weight, was removed to sterile dilution water in tubes which also contained broken
glass. Dilutions and plates were made from this muscle mixture, The procedure of isolating the muscle was carried out in a
CHANGES IN PROTEIN SUBSTRATES
The Van Slyke Method. In 1911, Van Slyke, (63), de-scribed a method to determine proteolytic products which is, to-day, commonly known as the Van Slyke method to determine amino nitrogen. This method depends upon the reaction of primary aliphatic amines with nitrous acid as shown by the following equation: R.NH2+ HNO2 = H20 + N2. The nitrogen formed leaves the system in gaseous form and the reaction therefore proceeds from left to right.
In order to carry out the Van Slyke determination a complicated apparatus is used. Firstly glacial acetic acid and secondly a 30 per cent aequous solution of sodium nitrate are measured into the apparatus in definite amounts. This forms
nit-rous acid which, in solution, spontaneously decomposes to form nitric acid and nitric oxide. 2 HNO2 = HNO2 + NO. The latter reaction is utelized to displace all the air in the apparatus. The deaminizing bulb is now shaken until the liberated nitrous oxide forces the level of the reacting solution back to a cali-bration on the deaminizing bulb and by closing a stop-cock, the sodium nitrate-acetic acid mixture is held at this level. The unknown amino acid solution is then introduced, with the result that nitrous oxide and nitrogen gas is evolved. The deaminiza-tion bulb is shaken, always for the same period of time, to fac-ilitate the action of the nitrous acid upon the amino acid.
24.
permanganate solution and the pure nitrogen gas is thereafter measured by means of a special gas burette.
Since proteins are composed of different amino acids,
all of the amino acids of which a protein is composed are not
primary amino acids. Now nitrous acid reacts more slowly on
amino acids which are not primary acids, that is, on amino acids
which have an amino group in some other position than the alpha.
Lysine, CH2(NH2). CH2. CH2. CH2. CH(NH2). COOH, for instance,
requires thirty minutes to react completely with nitrous acid while ordinary primary aliphatic amino acids require only three minutes to complete this reaction. It is probable that the de' composition products of fish muscle would not be made up of pri-mary amino acids alone. Nevertheless, if the same deaminization time is used for all determinations, the results obtained should
be comparable, since we are dealing with the same type of protein
in all cases.
Pure proteins, egg albumin, edestin,_etc., also react with nitrous acid but the amount of nitrogen evolved in each case
is only a very small fraction of that contained in the protein molecule. Soluble proteins in fish muscle, then, would have
little effect upon the result. obtained.
Ammonia reacts with nitrous acid to give nitrogen gas. Ammonia is said to require from one and one-half to two hours to react quantitatively. In the case of fish muscle where
the decomposition is far advanced, ammonia would be present in large quantities and might be the source of some error.
Urea, methyl amine and other simple amines require long periods to react quantitatively with nitrous acid so that it is probable that they would be of little significance in
pro-teolytic determinations made upon fish muscle.
Van Slyke concluded that the nitrous acid method is appropriate to follow the quality and extent of proteolysis.
In 1911, Van Slyke, (64), used the above method to determine the amount of proline in amino acid mixtures and found the method to be very satisfactory for this purpose.
Van Slyke and White, (65), used the Van Slyke method to follow the digestion of protein in the stomach of the dogfish. They concluded that their results were not absolutely accurate due to the fact that much urea is present in the stomach of the dogfish. The error involved, however, was believed to be small enough as to have little affect upon the results.
Following the suggestion of Van Slyke, White and
Crozier, (73), used the Van Slyke method to follow the digestion of boiled beef, boiled cod and bolied dogfish muscle, with try-psin. They obtained concordant results and found the method to be excellently suited to this type of work.
In 1912, Van Slyke, (66), suggested that certain mod-ifications be made in the apparatus and that ammonia should be
removed from proteolysed solutions before the determination is made.
In 1912, Van Slyke, (67), suggested that still further
changes be made in the apparatus and at the same time introduced
26.,
solution instead of the 10 cc. used by the macro apparatus. Sturges and Rettger, (61), found that the Van Slyke method yields valuable results provided that no reliance is. placed on a single determination. They stated that at least two
determinations should always be made.
In 1922, Bushnell, (11), found that the results of
Van Slyke determinations, made on a substrate which had been
brok-en down by a saprophytic anaerobe, were thrown off by the presence
of large amounts of anmonia. Their work showed that different amounts of nitrogen are evolved at different temperatures when
the same amount of ammonia is present.
Dunn and Schmidt, (17), in 1922, found that in Van
Slyke determinations the rate of deaminization of the alpha and
gamma amino groups of amino acids is markedly influenced by
tem-perature.
De Bord, (16), in 1923, was unable to obtain control
analyses on a one per cent peptone solution using the micro Van Slyke apparatus. The failure to obtain consistent control
anal-yses was found not to-bo due to the apparatus or reagents )sed,
since control blanks were always obtained.
Morrow concludes that the Van Slyke method is
limit-ed in its application to pure proteins, solutions of proteins, or proteins free from carbohydrates, fats, fibers, etc.
Wilson, (77), in 1923, drew attention to a statement by Northrop to the effect that the Van Slyke method is more
deter-minations of amino acids.
In 1924, Wagner, D'ozier and Heyer, (63), found that
the Van Slyke method is sufficiently accurate to follow the amount of amino nitrogen formed by bacteria in 2 per cent pep-ton cultures.
From the above literature cited, it is clear that all research workers do not agree that the Van Slyke method is the best method by which to determine.the amount of proteolysis in protein solutions. The majority of workers, on the other hand, seem to believe that the Van Slyke is a very accurate method of determining the extent of proteolysis.
The Formol Titration. In 1908, Sorensen,
(55),intro-duced the formol titration as a means of titrating amino acids. In this type of titration the free amino nitrogen of the amino
acids is allowed to act with formaldehyde to form a methyl der-ivitive. The acidity of the carboxyl group is then neutralized with a standard alkali solution. The theory behind this
titr-ation, at this time, was that the carboxyl group is released from the neutralizing powers of the free amino group, since the amino group is bound by the formaldehyde, and is therefore free
to be titrated. R. H. NH2 + OHCH = R . H. NCH2 + H20
00H COOH
Jodidi, in 1918, (37), called attention to certain ab-normalities in the formol titration. He showed that the formol titration yielded accurate results only in the case of amino acids which have amino, (NH2), and carboxyl, (cooH), groups in
their molecule. Amino acids which have an imino group, (NH),
in their molecule, such as proline, H? - H2, give a value
H2
H-000H
NH
which is too low when titrated by the Sorensen method. Irreg-ular results were also obtained with amino acids which contain
phenol or guanidine, H2, groups in their molecules in addition
NH1
to the regular amino and carboxyl groups. Too low results were obtained with diamino acids such.as lysine, CH2(NH2). CH2. CH2.
CH2. CH(NH2 ). COOH.
In 1919, Brickner, (7), noted that amino acids,
which in aequous solutions are nearly neutral to phenolphthalein,
are distinctly acid in alcoholic solutions.
Foreman, (21), in 1920, confirmed the results of
Jodidi and was further unable to obtain quantitative results with the formol titration when using certain monoamino monobasic acids.
Foreman, following the findings of Brickner, developed
the following titration which he found to be the most efficient
in estimating the acid value of amino acids: (1) A portion of
an aequous solution of the amino acid mixture is titrated with N/I0 aequous sodium hydroxide, using phenolphthalein as an
in-dicator. (2) A similar portion is titrated with N/10 alcoholic
potassium hydroxide in the presence of 85 per cent, by weight,
of alcohol. (3) Neutral formaldehyde is added to the
same endpoint with alcoholic potassium hydroxide. Phenolphtha-lein is used as an indicator in both stage 2 and stage 3.
Harris, (27), in 1923, pointed out that the idea that the amino group is bound by the formaldehyde, in the formol tit-ration did not give a proper explanation of the facts since the amino group of amino acids acts as a base only in acid solutions while the carboxyl group acts as an acid only in alkaline sol-utions. In aequous solutions the carboxyl groups are ized at pH 11.75 while in the presence of formaldehyde neutral-ization takes place at about pH 8.70. He concluded that the for-mol titration depends upon the formation of methyl amino derivi-tives which have a dissociation constant about 1000 times great-er than that of the amino acids from which they are dgreat-erived.
Harris showed that the acid value of amino acids can be accurately estimated by either of the following methods: (a)
Rg titrating in the presence of 80 per cent, by volume, of
ethyl alcohol and 5 per cent, by volume, of neutral formaldehyde, using N/10 sodium hydroxide to neutralize the acid and phenol-phthalein as an indicator. (b) By titrating to a blue color with
N/10 sodium hydroxide in the presence of 80 per cent by volume, of ethyl alcohol, using thymophthalein as an indicator.
Folin, (20), in 1922, used a colorimetric method to determine the amino acids in blood and in urine. The samples are made alkaline with a sodium carbonate solution after which a de-definite amount of a solution of the sodium salt of betanaphtho-quinone sulfonic acid is added. The mixture is allowed to stand
30.
for from 19 to 30 hours after which acetic acid and sodium thiosulfate are added, the sample is then dilited and compared
colorimetrically against a known standard.
De Bord, (16), utelized the method of Folin success-fully to study the nitrogenous metabolism of certain bacteria.
In 1924, (70), Wasterneys and Borsook, used the foll-owing methods to determine the products of protein hydrolysis: The total nitrogen of the hydrolysate is first determined. 10
cc. of a 10 per cent solution of trichloracetic acid are then added to 40 cc. of the hydrolysate. After standing for 1 hour the solution is filtered and the total nitrogen is determined. The difference between the values of the first and the second total nitrogen determinations shows the quantity of protein and metaprotein nitrogen. The filtrate is then boiled for three hours to decompose the trichloracetic acid and then made up to its original volume. 20 grams of sodium sulfate are now added
0 1
and the solution is left at 33 C., for 2 hour. This precip-itates the proteose. The solution is then filtered and another
total
nitrogen
determination is made to obtain the value of theproteose nitrogen. The peptone is now precipitated with tannic acid and another total nitrogen determination is made, the diff-erence between the last two total nitrogen determinations is the -value of the peptone nitrogen.
These methods are probably the most accurate of any
for the determination of decomposition products, they are,
at all limited.
Rona and Kleinmann, (53), in 1924, used the Nephelom-eter to follow the rate of disappearance of casein in a tryptic digest. This method is applicable only when turbid solutions are being used.
Northrop and Hussey, (43), used a viscometer to
foll-ow the hydrolysis of gelatin by trypsin and pepsin. This method can be used only with viscous solutions.
Reed, Rice, and Sinclair, (48), in 1929, used the method of Allen and Davidson, (1), to determine the amount of
ammonia produced by enzyme and bacterial action in fish muscle. In this method the samples are weighed out into 100 cc. volume-tric flasks, the volume is made up to 1000 cc. with distilled water, the flask is allowed to stand for 1 hour. After this time a definite portion is pipetted off into a 100 cc. volume-tric flask. 10 cc. of Nessler's solution are then added and the volume is made up to 100 cc, with distilled water. The solution is then compared colorimetrically with a'known standard and the value tabulated. The authors found this method to give good re-sults and to be easily carried out.
Non Coagulable Nitrogen, Along with the ammonium rogen test, Reed, Rice and Sinclair used the non-coagulable nit-rogen determination. The protein of the hydrolysate is
precipit-ated with tannic acid (9 parts of tannic acid to 1 part of
glac-ial acetic acid). The precipitate is filtered off and a Kjeldal
32.
non-coagulable nitrogen. This method is considerably longer than the ammonium nitrogen method and it seems to give no better results.
Volatile Basic Nitrogen. In 1932, Hess, (30), used
the volatile basic nitrogen determination as a means of follow-ing decomposition in fish muscle at different temperatures.
This method is said to give a value for ammonia and volatile nit-rogenous bases. 3 to 10 grams of muscle are ground and transfer-red with 20 cc. of distilled water to the distilling flask. The sample is then distilled with 80 cc. of alcohol after liberating the ammonia with MgO. 50 cc. of the distillate is collected in
N/10 HCl and the excess HC1 is titrated with N/50 NaOH. Hess
found this method to be very dependable and excellent for this type of work.
The Electrometric Titration Method, In 1933, Lemon
and Stansby,
L37),
worked out the electrometric titration methodfor the detection of relative freshness of haddock muscle. This method depends upon the theory that enzymatic, or primary
chan-ges, which take place in fish muscle, can be detected by
titrat-ing with 0.0165 N. HCl from a pH of 6.0 to a pH of 4.3. Enzyme
action breaks down the protein molecule, the protein molecule acts as a buffer between the pH values of 6.0 and 4.3, therefore the greater the amount of enzyme action the greater the disapp-earance of protein molecule, and consequently, the smaller the amount of buffer action between pH 6.0 and pH 4.3. The more acid used, then, between the indicated pH range the better the
fish since this indicates much buffer action and denotes that little of the protein has been disintegrated by enzyme action.
In order to determine the amount of bacterial decom-position or secondary change, that takes place in fish muscle the electrometric titration method uses 0.0165 N. HCl to tit-rate the fish muscle to a pH of 6.0. The value obtained indic-ates the amount of basic products present in the fish muscle and hence the amount of secondary decomposition.
In order to carry out the electrometric titration the muscle is ground and 5 grams are transferred to a 150 cc. bottle,
70 cc. of distilled water are added and the bottle'is shaken. for
10 minutes. The contents of this bottle are transferred to a 250 cc. flask, the bottle is rinsed with 30 cc. of distilled
water which is also transferred to the Erlenmeyer flask and an excess of quinhydrone is added. The flask is now shaken for 2 minutes after which its contents are transferred to a 250 cc. beaker. The titration is then made as outlined above, using the 0.0165 N. HCl. A qiunhydrone electrode is used to deter-mine the pH.
Lemon and Stansby used the electrometric titration method on numerous haddock. The haddock were brought to the laboratory a few hours after they were caught, determinations were then made on fish held in ice water, packed in ice, and
held at various temperatures. The A value ( measure of enzyme
action ) was found to corredpond very colsely for different fish
34.
value ( measure of bacterial decomposition ) was found, as the A
value, to give good results.
Lemon and Stansby conclude that a fresh haddock prob-ably has a B value between 7 and 8 (cubic centemeters of 0.0165
N. acid used) when first caught and that this value falls to 5
when lactic acid forms if no pronounced bacterial decomposition setsin. Any value less than 8, then, for B is an indication of little or no bacterial decomposition. If the value exceeds 8 suspicion is raised that the fish, at some previous time, was allowed to stand at too high a temperature. Haddock with a B value of 12 or greater is said to be stale. The amount of pri-mary change is said to be pronounced when the A value is less than 18 and extreme when the value is less than 16.
The Biuret Method. Nickerson, (42), in 1932 showed that the biuret test is quantitative for pure proteose or pure peptone fractions. This test is carried out by adding caustic soda and dilute copper sulfate solution to the protein fract-ion. A violet color is given with compounds which contain two
CO-NH groups in the molecule. This test is of little use to
determine proteolytic products since protein and metaprotein must be precipitated before it can be carried out.
EXP 7RIMENTAL
MT.HODS USED TO DETERMINE WHETHER OR NOT BACTERIA ARE PRESENT
IN FISH MUSCLE AND IN FISH BLOOD
The author was unable to make arrangements whereby live fish could be brought to the laboratory. The nature of this research necessitated that the fish should arrive at the laboratory before any biochemical changes had taken place in the muscle, and also before the bacteria of the slime, gills, etc., had an opportunity to penetrate into the muscle of the fish. It was believed, provided that the fish were quickly frozen, immed-iately after being caught and kept in the frozen state until they arrived at the-laboratory, that the required conditions would be fulfilled. It was also believed that the frozen con-dition of the muscle would facilitate the ease with which the fish muscle could be removed aseptically.
Muscle Samples. The fish, melanogrammus aeglifinus, three haddock and three scrod, (small haddock), were caught on a beam trawler. As soon as they were caught they were thrown into an ice-box containing "dry ice" (solid
C02).
which has a temperature of -703C. They were transported to the cold stor-age plant in the frozen condition. They were stored in the cold0
storage'plant at 0 F., for from 1 to 4 weeks until they were used. The fishwere then brought to the laboratory in the
froz-0 en state. The temperature.of the muscle was approximately 0 F at this time. An area of the skin was first stripped from the
flesh, a flap of the muscle was then cut away from the surface of the muscle with a sterile scalpel and a portion of the
froz-en muscle, approximately 5 grams in weight, was cut out with a
..sterile gouge. The muscle was then transferred to a wide mouth Erlenmeyer flask containing 50 cc. of sterile dilution water and broken glass. The -flask was stoppered with a sterile
rab-ber stopper and then shaken in, a mechanical shaker for 15
min-utes in order to disintegrate the muscle. Dilutions were made
from this mixture. 1 gram samples were removed from the same
area of the fish and placed directly in broth tubes and petri dishes wihtout disintegrating the muscle.
The scalpels and gouges used were sterilized by
flaming thoroughly with a Bunsen burner, cooling in 95 per cent alcohol and burning off the alcohol.
Samqples Taken. Portions of flesh were taken from near the head on each side of the fish, from the middle port-ion on each side of the fish and from near the tail on each side of the fish when the haddock were used. A total number of 90 samples were taken from three haddock.
The scrod were small enough so that the portions of muscle were taken only from the middle section of the fish on
each side. 30 samples were, therefore, taken from the scrod.
Dilutions, Dilutions were made from the muscle mix-ture in the wide mouth 100 cc. Erlenmeyer flask. All dilutions were covered by duplicate agar plates.and broth cultures. The
any antibodies from the muscle which might have an inhibiting effect on the growth of bacteria.
Medium. Fish broth and fish agar, as used by Gee,
(23), were used as a medium of growth for bacteria from fish
muscle. 500 grams of the ground haddock muscle were addedto 1000 cc. of tap water. This mixture was stirred while cold for 1 hour. The mixture was then heated for 20 minutes until it came to a boil and then boiled for 5 minutes. This was filtered and the filtrate was autoclaved at 15 pounds pressure for 20 minutes to bring down the remaining coagulable protein. After
the second filtration the medium was tubed and sterilized. Sol-id media was made by adding 1 .5 per cent agar-agar, filtering the resulting mixture and sterilizing.
All sterilizations by autoclave were carried out at 20 pounds pressure for a period of 20 minutes.
Incubation Period Of Cultures, All cultures, both agar plates and broth tubes, were incubated for 168 hours at 20 C.
38.
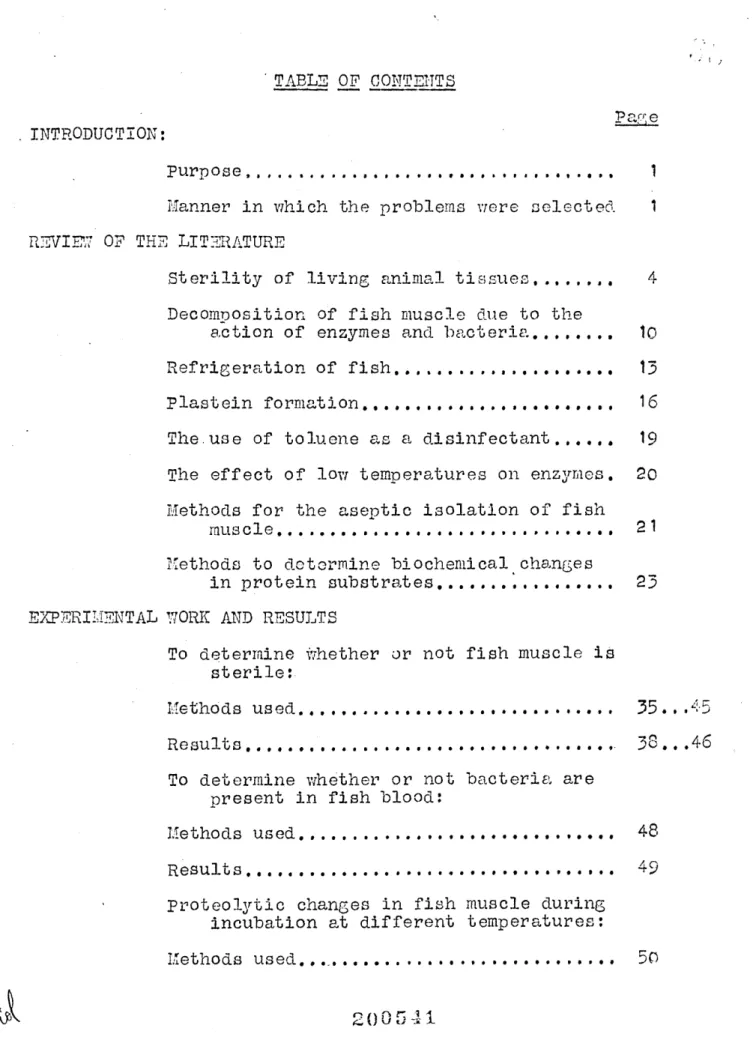
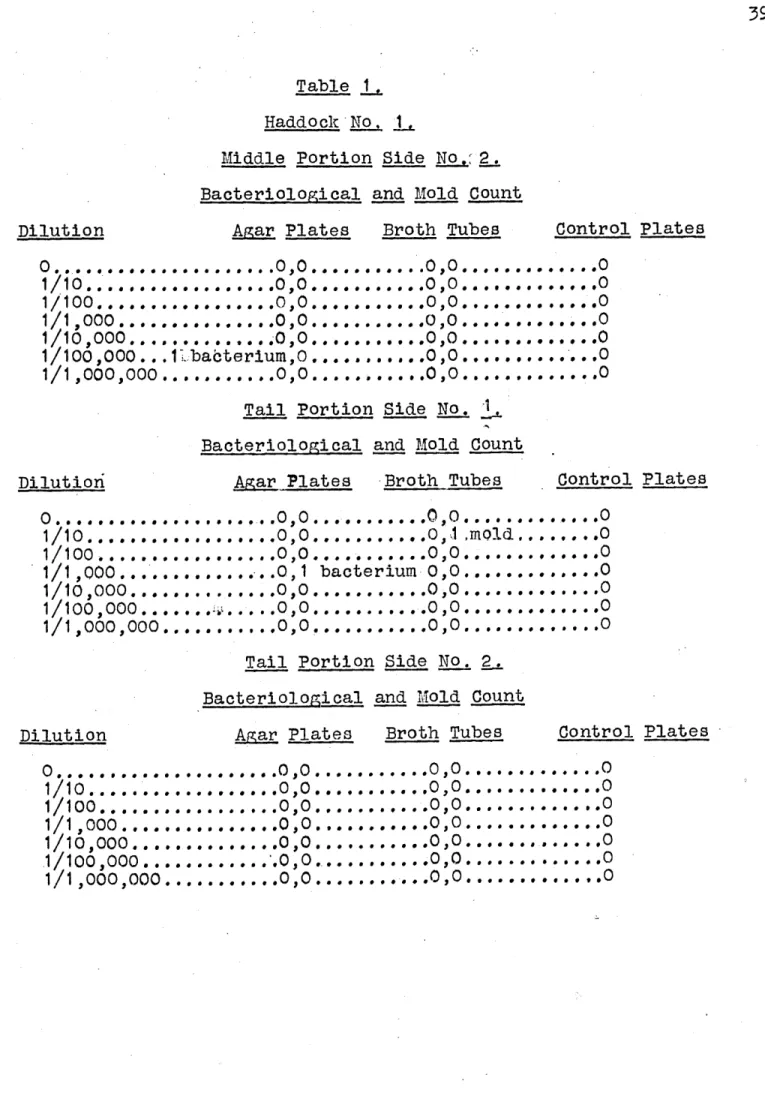
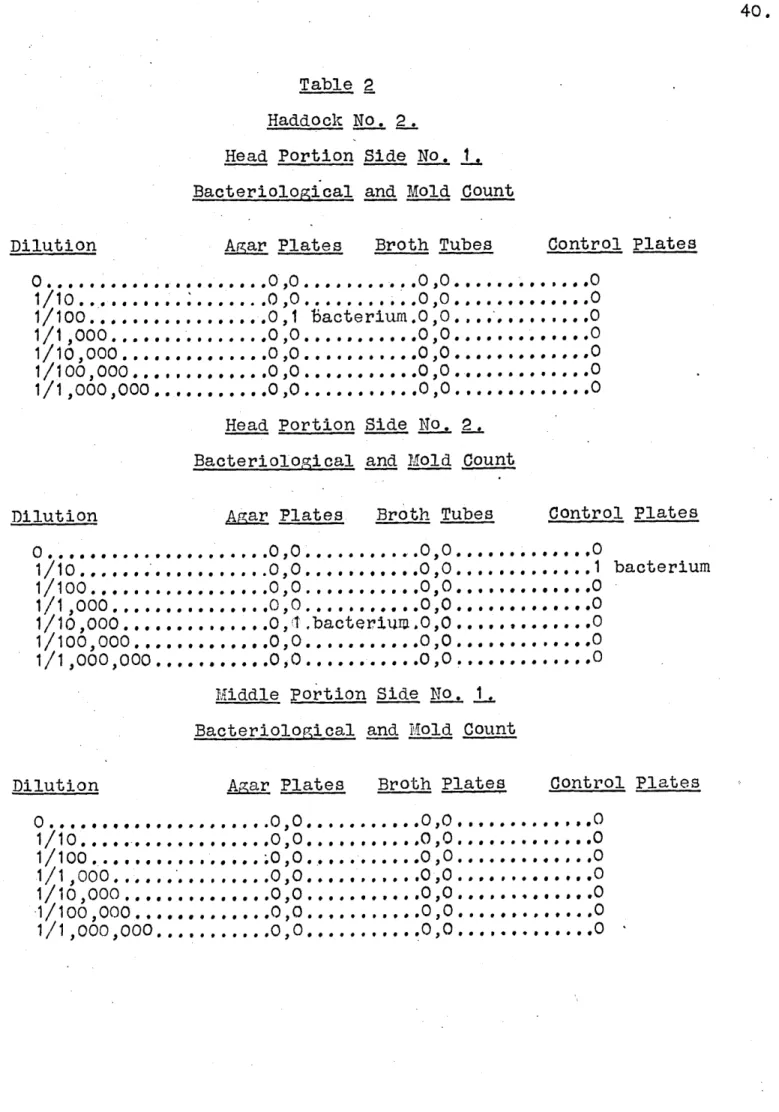
RESULT S Table 1, Haddock No. 1.
Head Portion Side No. 1. Bacteriological and Mold Count Dilution 0 1/ il 10.. .... 1/10. .. . . 1/1n01,.. 1/1000 0... 1/100,000..: 1/1 ,000,000o Agar Plates .0,0 .. ,. .0 0... 0, 1mold. .0,0... .0,0... . .0,0 .... .0,0 .... . Broth tubes .0, 0
.())o
.0,0 .0,o .0,0 .0,0 .0,0 Control Plates ... .0 ... 1 bacterium ... .0 *. .. ...0 ... 00Head Portion Side Io.
Bacteriological and Lold Count
Dilution Agar Plates Broth tubes Control Plates
11i0 .# # 0-9, 1/100... . .
1/100.. ...
1/1000... 1/100,000.. 1/1,000,000 .0,0 .0,o .0,0 .0,0 ,0o .0,0 .0,o0 .0,0 .0,0 .0,0 .0,0 .,,Middle Portion Side N 1 Bacteriological and Mold dount
Dilution Arar Plates Broth tubes Control Plates 0.... . . .
0/i.
F * 0 ,-F F 3, 1/10...1/100..
..
1/1000...
1/10,)000...
1/1)0000,. 1/1,000,000 .0,0 .0,o .0 0 010 .0 0 .0;o .,O0. .0,0. .0,0. .0,0. .0 0. .0',0.Table 1 Haddock No, 1i
Middle Portion Side No.: 2. Bacteriological and Mold Count
Dilution Agar Plates Broth Tubes Control Plates
0... 1/10... 1/100...
1/1,000....
1/10,000...
1/100,ooo..
1/1,9000,000
*. . .,.. ... 0,0. .;babterium ,0. .. #...,.00. .0,0. .0,0. .0,0. .0,0. .0,0. ,0,0. .0,0. Tail Portion Side No.Bacteriological and Mold Count
Dilution Agar Plates -Broth Tubes Control Plates 0... 1/10. ... ... 1/100...,. 1/10,000... 1/100,000.. 1/1 ,000,000 .0,0... .0,0....0,1*0bacter .0,0... .0,0... ... ium .0,0 .0,1 .0,0 0,0 .0,0 .0,0 .0,0 ... ,mold. ... ... ... ...
Tail Portion Side No. _.
Bacteriological and Mold Count
Dilution Agar Plates Broth Tubes Control Plates 033*3333333 1/10... .
1/100...
1/1,000.0.. 1/10,000... 1/100,000..i/1
,000,000 .. 0,0. ..0 ,0 .0,0o. .0,0 ,0,0 .0,0 .0,0 .0,0 .0,0 .0,040.
Table 2 Haddock No. 2. Head Portion Side No.
Bacteriological and Mold Count
Dilution
Agar
Plates
Broth Tubes Control Plates 0. . 1/10... 1/100... 1/1,000.... 1/10,000... 1/100,000.. 1/1,000,000 000
bacterium.0,0. 000 0* 00 000 00 00 98 00 0 Head Portion Side No. . Bacteriological and Mold CountDilution Agzar Plates Broth Tubes Control Plates
0
... 1/10.,....1/100...
1/,ooo....1/10,000...
1/100,000..
1/1,000,000
bacterium .0,0 ... 0,0 .0,0...0,0 .0 ,;.T.bacterium.0,20 .0,#0...00Y .0,0 ... 0,0 Middle Portion Side No.L
Bacteriological and Mold CountDilution Agar Plates Broth Plates Control Plates 1/1of0... 0 1/100 . . . . 1/1,J000...0 1/10,000 ....
1/100,000...
1/1,000,000.
.0,0
.0,0 ;0,0 .0,0 .0,0 .0,0.0,0
.0,0 0,0 .0,0 .0,0 .0,0.0,0
.0,0
.0
.0.0
.0
.0 .0.0
Haddock No]' 2
Middle Portion Side No. 2. Bacteriological and Mold Count
Dilution Agar Plates Broth Tubes Control Plates
0
. , . . . . 1/10 . . . . . 1/100...1/,o000
....
1/10,000.,.1/100000..
1/1,000,000
.0,0 . .0,0. .0,0. .0,0. .0,0. .0,0. .0,0,Tail Portion Side NO. 1. Bacteriological and Mold Count
Dilution Agar Plates Broth Tubes Control Plates 0.9... 1/10... ... 1/100.... 1/1 ,Q000,. 1/10,000... 1/100,000.. 1/1,000,000 .0,0 ..0,0 .0,0 * .0,0 .0,0 .0,0 (bacteria)0 *. . ... .. .,*.,... .....00 ... 0 ... 09 ... 0 ,bacteria. ,0 .. . . . ... 20 ,10..,...,. 0... ... ,0, . . . Tail Portion Side No. 2. Bacteriological and Mold Count
Dilution Agar Plates Broth Tubes Control Plates 0 1/10... 1/100...
1/1,000....
1/10,000... 1/100,000..1/1,000,000
.0,0 .0,0 .0,0 .0,0 .0 ,0 .0,0 .0,0 .0,0. .0,0. .0,0. .0,0. .0,0. .00. .0,0. .0,0 .0,0 .0,0 .0,0 .0,0 .0,0 .0,0Table 3 Haddock No.
Head Portion Side io. L Bacteriological and Mold Count
Dilution Agar Plates Broth Tubes Control Plates 1/i.,. .,,.
,11,000... i/ia0,000... 1/100,000.. 1/1,000,000
Head Portion Side No. 2. Bacteriological and Mold Count
Dilution Agar Plates Broth Tubes Control Plates
1/10...0 1/100. ... . 1/1,)000... 0 1/10,000... 1/100,000.. 1/1,000,000 .0,0. .0,0. .0,0. .0,0. .0,0. .0,0. ,0,0, .0,0. .0,0. .0,0. .0,0. .0,0. .0,0, .0,0. Middle Portion Side NO.
Bacteriological and Mold Count
Dilution Agar Plates Broth Tubes Control Plates
0-.. 0 . ., . 1 / 10... i/100..., 1/1,000.... 1/l0,oo... 1/100,000.. 1/1,000,000 .0,0 .0,0 .0,0 .0,0 .0,0 .0,0 ,0,0 ,0 ,0. .0,0. .0,0. .0,0, .0,0. .0,0. .0,0. .0,, ,0 .0 .0 .0 .0 .0 .0,0 .0,0 .0,0 .0,0 .0,0 .0,0 .0,0
Table 3 Haddock No.
L
Hiddle Portion Side No. 2. Bacteriological and Mold Count
Dilution Agar Plates Broth Tubes Control Plates
0 .& 0 0 .o 100i/i .... 1/1000.... 1/10,000...8
1/100,000..
1/1,0000ooo
.0,0. .0,0. .0,0. .0,0.,0,o.
.0,0. .0,0.Tail Portion Side No. 1_,. Bacteriological and Mold Count
Dilution Agar Plates Broth Tubes Control Plates
1/10.. .... 1 100.. . . 1/1,000.... 1/10,000... 1/100,000..
1/1,000,000
Tail Portion Side No. 2.
Bacteriological and Mold Count
Dilution Agar Plates Broth Tubes Control Plates 0..,...,. 1/10... 1/10 . .. . 1/1,000.... 1/10,o00... 1/100,000.. 1/1,000,000 .0,0. .0,0. .0,0. .0,0. .0,0. .0,0. .0,0. .0,0. .0,0. .0,0. .0,0. .0,0 .0,0. ,0, .0,0. .0,0. .0,0. .0,0. .0,0. .0,0. .0,0. .0,0 .0,0 .0,0 .,o .0,0 .,0 .0,0 .0,0. .0,0. .0,0.
.0,0.
.0,0. .0,0. .0,0.44.
Table 4 Scrod No. 1.
Middle Portion Side No. 1,and 2 Bacteriological and Mold Count
Dilution Agar Plates Broth Tubes Control Plates
1/100,0#0...oo...o0,o...o
Scrod No.
Middle Portion Side No. 1 and 2. Bacteriological and Mold Count
Dilution Agar Plates Broth Tubes Control Plates
1/ 10 ... . . . . , . . . , . . . . 1/10,00...0,0...0,O0*000...
1/100,000.... .... ... 0,0 .*0. .. . .. . .. . .. . 1/1,000,000...0,0...* .
o
. . . ..Scrod No. 3.
Middle Portion Side No. I and 2. Bacteriological and Mold Count
Dilution Agar Plates Broth Tubes Control Plates
1/1,000... 000 .. 09 .0,0...0,0..00 000 .0
Tests Made to Determine the Sterility of Muscle Used to Determine Proteolysis. Excepting the first week, a
small piece of muscle was taken from each portion of muscle used and placed aseptically in sterile, nutrient broth before
proteolytic tests were made at the start of each day's run. Agar plates were made from these broth tubes at the end of the
120 period, thus the presence of any infected muscle was indic-ated. During the first week, a sterile loop was drawn over the surface of the muscle in the flasks and then streaked over agar slants. This method was diacontinued thereafter due to the fact that the above method was preferable. Three broth tubes from the last weeks work were incubated anaerobically.
46& Table 5 Haddock Number. 4. 4. 4. 4. 4. Haddock Number. 5. 5. 5. 5. 5. Haddock
Number,-Sterile Muscle Sample
.24 .48 .72 .96 120 hours hours hours hours hours
Sterile Muscle Samole
.24 ,48 .72 .96 120 hours hours hours hours hours
Sterile Muscle Samole
.24 .48 .72 .96 120 Haddock Number. 7. 7. 7. 7.
7.
hours hours hours hours hoursSterile Muscle Sample
.24 .48 .72 ,96 120 hour.s hours hours hours hours Bacteria found in Broth Tubes ,... .0 ,... .... .0 . . . .. .,..0 Bacteria found in Broth Tubes ,...0 ,.... .. bacteria ... O present , ... 0 0 . . S . .000 Bacteria found in Broth Tubes .0 ,...00 , ... .0 Bacteria found in Broth Tubes *...0 , ... .0 ,...l...0O ,...l.... .0