Publisher’s version / Version de l'éditeur:
Advances in Powder Metallurgy & Particulate Materials-2009: proceedings of the 2009 World Congress on Powder Metallurgy & Particulate Materials, PowderMet 2009, June 28-July 1st, Las Vegas, pp. 4-81-4-94, 2009
READ THESE TERMS AND CONDITIONS CAREFULLY BEFORE USING THIS WEBSITE.
https://nrc-publications.canada.ca/eng/copyright
Vous avez des questions? Nous pouvons vous aider. Pour communiquer directement avec un auteur, consultez la
première page de la revue dans laquelle son article a été publié afin de trouver ses coordonnées. Si vous n’arrivez pas à les repérer, communiquez avec nous à PublicationsArchive-ArchivesPublications@nrc-cnrc.gc.ca.
Questions? Contact the NRC Publications Archive team at
PublicationsArchive-ArchivesPublications@nrc-cnrc.gc.ca. If you wish to email the authors directly, please see the first page of the publication for their contact information.
NRC Publications Archive
Archives des publications du CNRC
This publication could be one of several versions: author’s original, accepted manuscript or the publisher’s version. / La version de cette publication peut être l’une des suivantes : la version prépublication de l’auteur, la version acceptée du manuscrit ou la version de l’éditeur.
Access and use of this website and the material on it are subject to the Terms and Conditions set forth at
Development of titanium dental implant by MIM : experiments and
simulation
Thomas, Yannig; Baril, Eric; Hetu, Jean François; Ilinca, Florin
https://publications-cnrc.canada.ca/fra/droits
L’accès à ce site Web et l’utilisation de son contenu sont assujettis aux conditions présentées dans le site LISEZ CES CONDITIONS ATTENTIVEMENT AVANT D’UTILISER CE SITE WEB.
NRC Publications Record / Notice d'Archives des publications de CNRC: https://nrc-publications.canada.ca/eng/view/object/?id=0553741b-cb31-440d-a4cc-f856c53e86fe https://publications-cnrc.canada.ca/fra/voir/objet/?id=0553741b-cb31-440d-a4cc-f856c53e86fe
Development of titanium dental implant by MIM :
Experiments and simulation
Yannig Thomas*, Eric Baril*, Florin Ilinca ** and Jean-François Hetu **
* Powder Forming group, ** Process Modelling group
Industrial Materials Institute of the National Research Council Canada (QC)
Abstract
Present work at IMI deals with the development of a composite porous/dense dental implant based on two powder metallurgy approaches: Metal injection molding (MIM) of titanium for the dense core and titanium foam coating for the outer surface. A first series of MIM dense cores were produced using a wax based binder and CpTi -45µm powder and some defects and instabilities were observed in both the molded and sintered components. This paper will focus on the understanding of the origin of these defects. To achieve this goal, several MIM feedstocks were prepared with the same volume of wax based binder but with powders having different particle sizes. A commercial feedstock was also used as a reference. The physical and rheological properties of these feedstocks were first characterized in order to obtain the data required for the full 3D modelling of the mold filling. The filling behaviour of these feedstocks was then examined through the production of short shots and the characterization of the molded parts by micro CT tomography. These experimental results were further compared with the mold filling simulation of the feedstocks using a 3D finite element code including free-surface flow.
Introduction
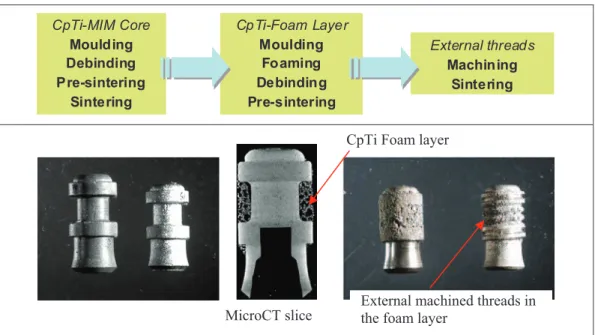
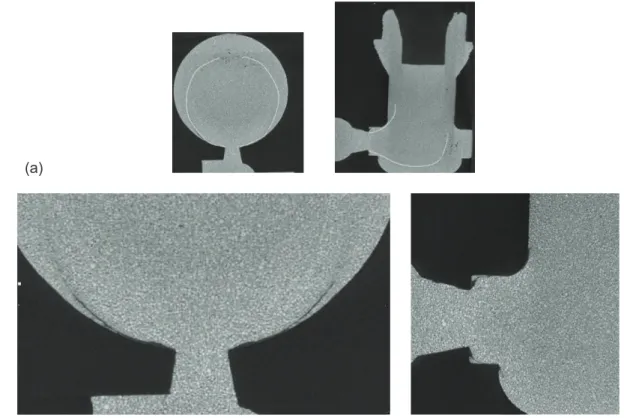
Dental implants are posts that are placed into the jawbone to take the place of missing tooth roots. They provide means of replacing lost teeth and restoring natural dental function. New implant designs with porous coating have been proposed to enhance osseo-integration and the bone-implant interface. In particular, present work at IMI deals with the development of a composite porous/dense dental implant based on two powder metallurgy approaches: Metal injection molding (MIM) of titanium for the dense core and titanium foam coating for the outer surface [1]. Figure 1 presents the proposed design and process that merge Titanium-Foam and Titanium-MIM technologies. In the course of the development of the MIM dense cores using a wax based binder and CpTi -45µm powder, some defects and instabilities were observed in both the molded and pre-sintered components, as shown in Figure 2, and were localized in the top of the implant close to the injection point.
CpTi-Foam Layer Moulding Foaming Debinding Pre-sintering CpTi-MIM Core Moulding Debinding Pre-sintering Sintering External threads Machining Sintering
CpTi Foam layer
External machined threads in the foam layer
MicroCT slice
Figure 1. Description of the composite porous/ dense dental implant technology
This paper focuses on the understanding of the origin of these defects. To achieve this goal, several MIM feedstocks were prepared with the same volume of wax based binder but with powders having different particle sizes. A commercial feedstock was also used as a reference. The physical and rheological properties of these feedstocks were first characterized in order to obtain the data required for the full 3D modelling of the mold filling. The filling behaviour of these feedstocks was then examined through the production of short shots and through the characterization by micro CT tomography of the molded parts produced at different injection speeds. These experimental results were then compared with the mold filling simulation of the feedstocks using a 3D finite element code including free-surface flow.
Figure 2. Defects observed in the top of the dense core a) as molded and b) pre-sintered with CpTi<45µm
Experimental Procedure
Materials
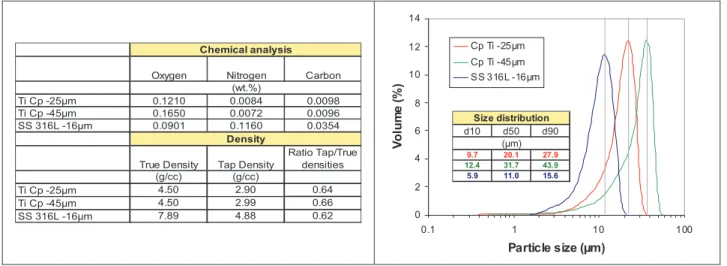
CpTi–Grade 1 (< 45 µm and <25 µm) spherical powder produced by plasma atomization (AP&C, Boisbriand, Canada) as well as gas atomized spherical stainless steel ANVAL 316L powder were used in this study. Typical size distributions measured by laser diffraction are presented in Figure 3. Chemical analyses performed on LECO analyzers as well as true and tap densities are also given in Figure 3. Three feedstocks were prepared by mixing 66%vol. of each of these powders with the binder components in a
planetary mixer using HV-type blade at 150°C. The binder mixture used in this work was composed of polyethylene, paraffin wax and stearic acid. A commercial ADVAMET stainless steel 316L feedstock (Advanced Metal Working Practices, Inc., Carmel, IN, USA) was also used as comparison.
Oxygen Nitrogen Carbon Ti Cp -25µm 0.1210 0.0084 0.0098 Ti Cp -45µm 0.1650 0.0072 0.0096 SS 316L -16µm 0.0901 0.1160 0.0354
True Density Tap Density
Ratio Tap/True densities (g/cc) (g/cc) Ti Cp -25µm 4.50 2.90 0.64 Ti Cp -45µm 4.50 2.99 0.66 SS 316L -16µm 7.89 4.88 0.62 Density Chemical analysis (wt.%) 0 2 4 6 8 10 12 14 0.1 1 10 100 Particle size (µm) V o lu m e ( % ) Cp Ti -25µm Cp Ti -45µm SS 316L -16µm d10 d50 d90 9.7 20.1 27.9 12.4 31.7 43.9 5.9 11.0 15.6 Size distribution (µm)
Figure 3: Characteristics of titanium and stainless steel powders used in this study
Injection molding processing conditions
Injection molding of the core of the implant was performed on a Battenfeld Microsystem-50 micromolding machine using the four different feedstocks described above. Overall dimensions of the core are 11.35 mm for the part height, 5.57mm for the part diameter, and 0.375mm x 1 mm for the gate. Typically two different injection speeds were evaluated, the remaining processing parameters being kept constant as described in Table 1. For the 100mm/s injection speed, short shots were collected to be compared with the mold filling simulation results.
Table 1. Molding processing conditions used
Injection speed 100 mm/s Injection speed 600 mm/s
Molding temperature 145°C 145°C
Mold temperature 45°C 45°C
Total volume injected (included the runner)
345 mm3 345 mm3
Flow 1963.5 mm3/s 11,781.0 mm3/s
Injection time 0.175 s 0.029 s
Rheological Characterization
Rheological characterization of the feedstocks for apparent shear rates between 100 s-1 and 10,000 s-1was performed on a Rosand capillary rheometer using a 20mm long, 1mm diameter capillary die, at 150°C for the three in-house feedstocks and at 175°C for the commercial feedstock. To be able to obtain the full rheological characterization required for the mold filling simulation, dynamic rheometry was also performed on a TA Instruments ARES parallel-plate strain controlled rheometer to determine the variation of apparent viscosity at low shear rates and the yield behaviour of the feedstocks.
X-Ray Micro Computed Tomography Characterization
The X-Tek HMXST 225 X-ray microfocus X-ray system (Metris, Tring, UK) was used. The system is equipped with a 225kV microfocus X-ray tube with a focal spot down to 5 µm at 110kV and 0.4mA, producing a cone beam that is detected using a PE 1621 AN amorphous silicon 409.6X409.6 mm flat panel sensor coupled with CsI scintillator screen (PerkinElmer Optoelectronics, Fremont, CA). The resulting images are 16-bit grey-scale images of 2000 pixels squared. The source to panel distance is 1173mm. The 3D cone beam reconstruction, by Feldkamp-Davis-Kress (FDK) algorithm, was done with X-Tek CT Pro software.
The scan parameters were 130kV and 0.65mA, and a 0.5mm Cu filter was used to reduce beam hardening effect. The flat panel acquisition time was set to 1s and 8 frames average was used for each projection. The specimen was positioned at 39.021mm from the source and a rotation step of 0.248° was used for a rotation angle of 360°. A full 3D image of the whole component was obtained with a cubic voxel size of 6.0µm. The resulting volume size was 1000X1600X1860 voxels for a total file size of 11 Go.
Mold Filling Simulation
Three-dimensional modeling of the flow during mold filling is based on conservation of mass, momentum and energy for an incompressible fluid. Neglecting body forces and viscous dissipation and considering a generalized Newtonian fluid model, the governing equations are given by:
)), ( 2 ( u u u u
!
'&%# $#" ( ) * + , $ "# -p t , 0 & " # % u ), (k T T t T cp '&#" # ( ) * + , # " $ -u!
where
(
u
)
&
(
#
u
$
(
#
u
)
T)
/
2
is the velocity gradient tensor (shear rate tensor) and t, u, p, T,!
, , and k denote time, velocity, pressure, temperature, density, viscosity, specific heat and thermal conductivity respectively.p c
The flow front position in the mold cavity is computed using a pseudo-concentration technique [2]. The approach defines a smooth function such that a critical value represents the position of the free surface. The pseudo-concentration function is convected using the velocity field:
) , ( tx F
F
c . & # " $ -on 0 u F t FThe fluid flow solution is obtained for all three components of the velocity by solving the complete momentum-continuity equations, which determine the ability to predict flow separation and jetting [2]. Jetting is produced near rapid changes in part thickness when the flow has a preferred direction of propagation away from the adjacent walls.
The boundary conditions complete the statement of the problem. On the inlet section of the cavity, both the velocity and temperature are imposed. Non-slip boundary conditions are imposed on the filled cavity walls. The heat transfer between the cavity and the mold is given by
mold
on
)
(
%
/
&
c m mh
T
T
q
where
T
m is the mold temperature andhcis a surface heat transfer coefficient. This coefficient accounts for any heat transfer resistance not accounted for by the use of the estimated mold wall temperature and also by any contact resistance between the feedstock and the mold wall. This contact resistance results, at least in part, from a binder-rich layer adjacent to the mold wall.At each time step, the global system of equations is solved in a partly segregated manner. The momentum-continuity equations are solved by a mixed velocity-pressure finite element method. Continuous piecewise linear elements are used for both velocity and pressure, as well as for the scalar variables (temperature and front tracking function). More details on the finite element approach used can be found in [3]. Computations were carried out using a four-node tetrahedral mesh having 197,782 nodes and 1,078,830 elements.
Feedstocks Rheological Characterization
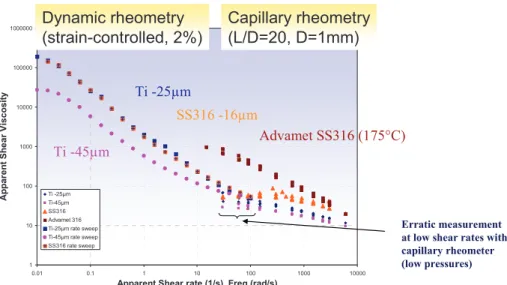
The rheological behavior of the different feedstocks is presented in Figure 4. Similar behavior at 150°C was obtained for the in-house feedstocks using the same binder formulation and solid loading (66 vol%). At lower shear rates, the feedstock with the coarser titanium powder (Ti <45µm) had however, as expected, lower apparent viscosity as compared to feedstocks with finer titanium powder (Ti<25µm) and stainless steel 316L powder. At higher shear rates, viscosity behavior measured with capillary rheometer of the two titanium feedstocks was closer, while the feedstock of SS316 had higher viscosities. As a comparison, the commercial stainless steel feedstock evaluated at 175°C had a significantly higher viscosity. Some erratic measurements were obtained in the capillary rheometer at low shear rates (<100 s-1) due to the low pressures measured (<0.3 Pa) as compared to the pressure sensor available.
1 10 100 1000 10000 100000 1000000 0.01 0.1 1 10 100 1000 10000
Apparent Shear rate (1/s), Freq (rad/s)
A p p a re n t S h e a r V is c o s it y Ti -25µm Ti-45µm SS316 Advamet 316 Ti-25µm rate sweep Ti-45µm rate sweep SS316 rate sweep Dynamic rheometry (strain-controlled, 2%) Capillary rheometry (L/D=20, D=1mm) Ti -45µm SS316 -16µm Ti -25µm Advamet SS316 (175°C) Erratic measurement at low shear rates with capillary rheometer (low pressures)
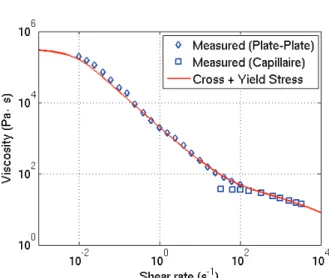
Figure 4. Rheological characterization of the three in-house feedstocks and commercial SS316L feedstock The flow characteristics of the in-house feedstocks used in this study are typical of a Non-Newtonian fluid exhibiting yield stress. The viscosity can be modeled with the Cross model:
0
1
%n$
&
1 * 0 0/
1
3
2
,
And to take into account the yield stress behaviour of the powder-binder mixtures, the Herschel-Bulkley model with the modification due to Papanastasiou [4] was used. The effective viscosity described by this model is:
0
1
0
1
y 1 exp
ef & $
2
% % a3
3
where
2
y and a are constants. The pressure dependence of the viscosity is not known in our case and is neglected in the analysis. The values of the model constants are summarized in Table 2. Figure 5 shows that there is a good correlation of the results with these models.Table 2. Material properties for the titanium metal powder feedstocks
Model parameter Cp Ti -25µm Cp Ti -45µm
0 (Pa s) 36 180
n;2*(Pa) 0.42; 4.1 104 0.68; 100
2y (Pa), a(s) 2 10
3; 160 500; 100
Figure 5. Correlation for the Titanium -25µm feedstock between the measured data and the viscosity model
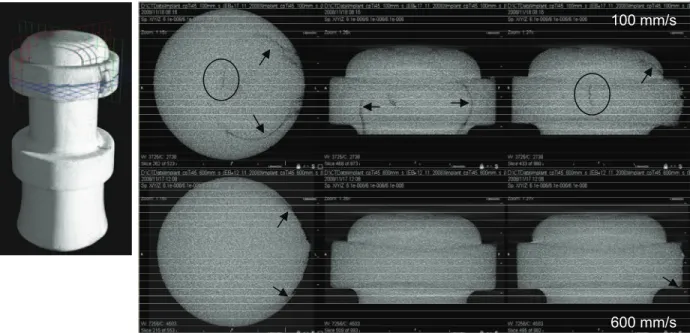
Analysis of the defect origin
In order to better understand the origin of the defects, various parameters were studied in relation
with their presence and their size. The figure 6 shows µCT slices of as-molded parts produced
with the feedstock containing -45µm titanium powder and injected at 100mm/s and 600mm/s.
The defects are clearly visible at the lower speed while, at the highest feed rate, defects are only
visible at the very surface in the vicinity of the gate. At 100mm/s, two types of defects can be
observed: (a) cracks (circle) and (b) hairlines (arrows). At 600mm/s, only the hairline defect is
present in a much smaller extent than at 100mm/s.
600 mm/s 100 mm/s
Figure 6. µCT slices at the gate level in the 3 main orthogonal planes of the as-molded implant produced
with - 45µm feedstock at 100mm/s and 600mm/s.
To further analyse the origin of the defects, three different feedstocks prepared with CpTi-45µm, CpTi -25µm and SS316-16µm powders were compared to the commercial feedstock Advamet SS316. Figure 7 illustrates the comparison at 100mm/s and 600mm/s. Then again, the hairline defect is more visible at low injection rate for all the feedstocks. This defect seems more important with CpTi-45µm feedstock than with CpTi-25µm, and even less important with SS316-16µm. The hairline is also clearly visible in parts produced with Advamet SS316 feedstock and the importance of the defect is similar to the SS316-16µm feedstocks. This relative ranking is less visible at a higher injection rate.
CP Ti -45µm Cp Ti -25µm SS316 -16µm
Advamet
SS316
100 mm/s
600 mm/s
Figure 7. µCT slices in the gate plane perpendicular to the axis of the as-molded implants produced with four
The shape of the hairline defect suggests that it originates from the gate. The darker gray level of the defect in µCT slices indicates lower x-ray attenuation. This should be due to the presence of a lower density phase which could be air or binder constituents. The location and extent of the defect should be directly related to the flow patterns during mold filling.
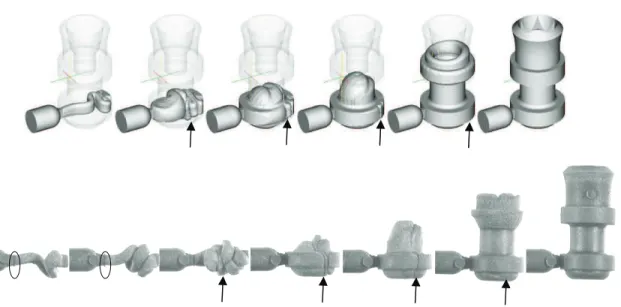
Mold filling simulations coupled with short shots production were used in order to better understand the flow patterns during the complete duration of the cavity filling. The figure 8 shows the comparison between the virtual and the experimental short shots obtained at 100mm/s filling rate, 145°C melt temperature with CpTi-45µm powder containing feedstock. There is a strong correlation between the fluid front in the numerical simulation and actual short shots. The initial feedstock jet exits the gate and directly hits the opposite cavity wall. Then, the jet is folding many times before filling a significant portion of the lower part of the cavity. After this stage, the feedstock starts to flow up into the cavity. Once the flow front hits the central core pin, the flow restriction leads to an increase of the internal pressure which eases the filling of the surface voids created by the initial folds (see arrows in Figure 8) and leads to a complete filling of the lower part of the implant. Finally, the flow front moves gradually to the top of the implant, until the complete filling of the cavity.
Figure 8. Mold filling simulation (top) and short shots (bottom) at 100mm/s injection speed (CpTi-45µm)
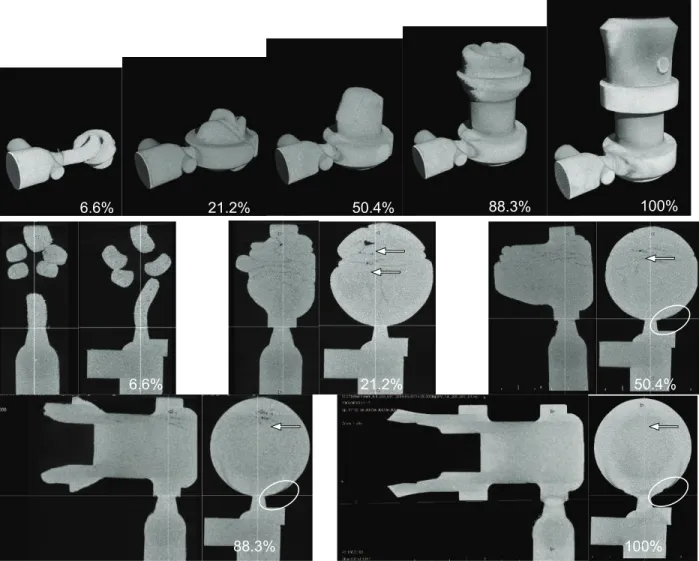
MicroCT scans of selected short shots were then performed to try to identify at which stage of the mold filling the defect occurs (see Figure 9). The folding of the initial jet entraps air bubbles inside the bottom parts of the component (see arrows). These bubbles are then collapsed by the internal pressure resulting from the flow restriction occurring when the flow front hits the central core pin. When the cavity is 100% full, the entrapped bubbles and weld lines between folds are not visible anymore, while the hairline defect is clearly visible (see circle in Fig. 9).
100% 88.3% 6.6% 21.2% 50.4% 50.4% 21.2% 88.3% 100% 6.6%
Figure 9. µCT reconstruction of the short shots produced at 100mm/s injection speed with CpTi-45µm feedstock
and orthogonal slices at the level of the gate and parallel to the main axis of the component.
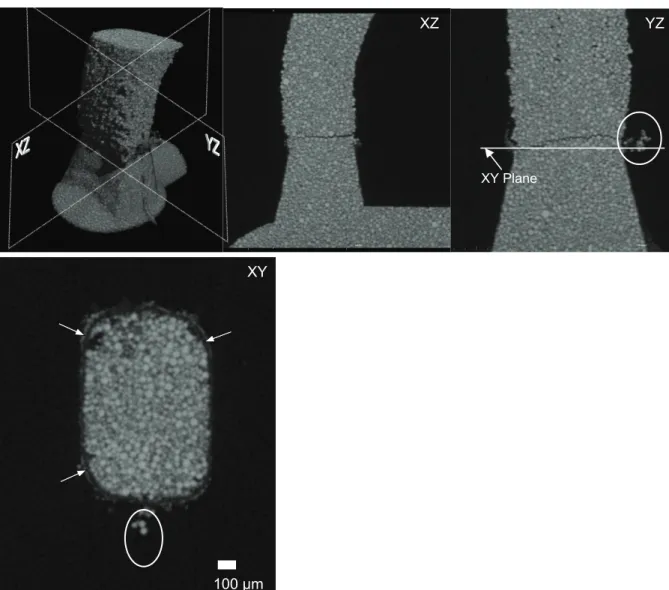
Moving back to earlier stages of the cavity filling, the evolution of the hairline defect can be seen easily at 88.3%. At 50.2% of cavity filling, the defect is not visible in the volume but slightly visible at the surface of the parts. Looking at the µCT orthogonal slice in Figure 9 at the early stage of filling (6.6%), shortly after the collapse of the initial folds, the defect is not yet visible. Higher resolution is required in order to see the origine of the hairline defect using MicroCT reconstruction of the region of the gate. Figure 10 shows MicroCT scan of the gate area of a short shot after 6.6% cavity filling. The geometrical resolution of this reconstruction is 4.4 µm with X-ray source dimension of about 5 µm. This zoom of the gate area reveals two important features: (1) some kind of “binder accumulation” along the wall of the cavity, perpendicular to the flow axis of the gate, (2) a layer of binder on the surface of the gate walls. The “accumulation” is circled in Figure 10 and it can also be seen in Figure 8 (black circles). This feature is located at the exact position of the gate emerging point in the cavity. It is characterized by a thin, about one particle diameter thick, film of feedstock. On the other hand, the layer of binder surrounds the whole gate section and ranges in thickness around 25µm.
XZ YZ
XY Plane
XY
100 µm
Figure 10. High resolution MicroCT reconstruction of the 6.6% short shot produced at 100mm/s injection speed
with CpTi-45µm feedstock and orthogonal slices across the gate.
To push the understanding a step forward, the numerical modelling was once again used to calculate the flow lines. The Figure 11 shows, after 92% of the filling completed, the flow lines superimposed on the map of the fluid velocity magnitude. Comparison of this figure with the Figure 12, that shows the µCT slice of the short shot at 88.3% filling cavity, clearly indicates that the hairline defect has similar shape as the flow lines and is located in the region between high and low velocities.
In summary, at a low injection speed of 100mm/s, the hairline defect originates from the gate area at the early stage of the cavity filling. A binder-powder separation was shown to occur which induces the formation of a thin binder-rich layer at the periphery of the gate. When the die filling progresses, the binder-powder separation at the gate seems to become a source of binder that propagates with the flow at the boundary between high velocity flowing region and relatively low velocity or frozen region. The high resolution zoom of the 88.3% short shot (Figure 12b) shows also that some binder accumulates on the wall of the cavity in the vicinity of the gate that explains the observed darker region around the gate on molded part surface.
Figure 11. Numerical modelling results after 92% cavity filling at an injection speed of 100mm/s showing flow lines
superimposed on the velocity magnitude (mm/s).
(a)
(b)
Figure 12. (a)MicroCT slices from the 88.3% short shot with high resolution zoom of the gate area, the hairline
defect is highlighted with white lines, (b) Details close to the gate area
Binder-powder separation at the gate during mold filling has already been reported and has been attributed to small size gate and high feedstock flow velocity [5]. Binder separation can occur due to particle migration from high shear region to low shear region or due to fluid flow through the interstices between particles under pressure gradients [6]. This last reference proposed that the binder-powder separation occurs at the end of the filling stage and during packing stage of the molding cycle. As shown earlier in this paper, the defect related to binder-powder separation is more important at low flow velocity (100mm/s) than at high velocity (600mm/s) which suggests that the segregation is not only linked to high shear rates. In addition, our experiments showed that the binder separation occurs at the very early stage of the filling.
The mechanism of binder separation due to fluid flow through the interstices between particles under pressure gradients, as proposed by Rhee [6], should occur not only at the end of filling but at the very beginning of mold filling. It is suggested that the binder separation observed in the early stage might be related to the pressure gradients between the runner and the cavity on each side of the gate. When the flow front moving in the runner reaches the restriction of the gate, a rapid increase of the pressure in the runner occurs, while the pressure in the cavity remains close to atmospheric pressure. This pressure gradient could force the migration of the binder through the powder bed towards the lower pressure regions. During the complete duration of the filling, the gradient can remain important and, therefore generates a continuous binder-powder separation. This mechanism creates at the gate a localized source of binder which propagates along the stream of the flowing feedstock.
This mechanism can be associated to the permeability through a porous media or a packed bed of particles. This is described by the Darcy equation which relates the flow rate to the pressure gradient, the viscosity of the fluid (binder) and the characteristics of the media itself (permeability). When the injection rate is high, assuming a similar pressure gradient, the time for the fluid to migrate through the powder bed is shorter than with low injection rate, which results in a smaller source of binder for the generation of the defect. This could explain partly the smaller defects observed at 600 mm/s. This assumption of a similar pressure gradient between the two flow conditions may not be valid. Indeed, it is expected that the pressure gradient at the gate level could be higher at higher velocities. However, it can be assumed that increasing by six times the feedstock velocity will not necessarily increase as much the pressure gradient in the gate. Therefore the binder flow rate in the particle bed will not be increased by the same order, and therefore the source of binder is still smaller than at 100mm/s.
As shown previously, the size distribution of the particles used for the feedstocks seems to have an effect on the importance of the defect. In relation to the mechanism described above, the permeability of a porous media is mainly influenced by the porosity. In our case, porosity which corresponds to the volume content of binder was identical for each feedstock. Then the differences in the importance of the defect should be more related to the differences between the solid loading and the critical loading that vary as a function of the powder characteristics. When the difference between these loadings is high, there is more room to compress the feedstock under pressure and induce the migration of the binder. In this work, the critical loading has not been evaluated, but it can be correlated to the ratio between tap density and true density (Figure 3). The importance of the binder-powder separation defects seems to be directly
correlated to the tap/true densities ratio. As mentioned before, the defect is more important in CpTi-45µm feedstock, which has the lowest tap/true densities ratio (0.62), while the SS316-16µm feedstock has a smallest defect and the highest tap/true densities ratio (0.68).
Conclusions
In the course of the development of MIM dense cores to be used in the fabrication of porous/dense dental implant, some defects and instabilities were observed in both the molded and pre-sintered components, and were localized close to the injection point of the implant. The objective of this paper was to investigate the origin of these defects. To achieve this goal, several MIM feedstocks were prepared with the same powder loading but with powders having different particle sizes, and rheological and micro-CT characterization. Mold filling simulations were also performed. The following results were obtained:
A very good agreement was obtained between the 3D filling simulation and the experimental results. The simulation was able to reproduce the folding of the jet entering the cavity as observed in the actual short shots.
Although feedstocks with particles as large as 45µm were used, it was possible to inject parts through a small gate (which corresponds to ~20 particles), with results quite similar to those obtained with lower particle sizes of -16µm.
The use of µ CT was shown to be very helpful to better understand the filling behavior and validate the simulation, but also to identify filling problems.
The hairline defect was shown to originate from the gate area at the early stage of the cavity filling. It was proposed that the binder-powder separation that occurs at the gate induces the formation of a thin binder-rich layer that becomes a source of binder that propagates with the flow at the boundary between high velocity flowing region and relatively low velocity or frozen region.
Even though the extent of the defects was more pronounced with larger particle sizes, the major effect was seen on the injection rates, the highest injection rate of 600 mm/s generating much less defects than the lowest injection rate of 100 mm/s.
Mechanisms involving pressure gradients at the gate were proposed.
ACKNOWLEDGEMENTS
The authors would like to acknowledge different colleagues from IMI-NRC: Shirley Mercier and Daniel Simard that prepared the different feedstocks, Normand Nardini that performed the injection molding experiments, and finally Pierre Sammut and Richard Gendron that performed and analyzed the rheological characterization of the feedstocks.
1 E. Baril, L.P. Lefebvre, Y. Thomas, F. Ilinca, Foam-coated MIM gives new edge to titanium implants, Metal Powder Report, 63 (8) September 2008, pp. 46-50, 52, 54-55.
2 F. Ilinca and J.-F. Hetu, “Finite element solution of three-dimensional turbulent flows applied to mold-filling problems”, Int. J. Num. Methods Fluids, 2000, vol. 34, pp. 729-750.
3 F. Ilinca and J.-F. Hetu, “Three-dimensional free surface flow simulation of segregating dense suspensions”, Int. J. Num. Methods Fluids, 2008, vol. 58, pp. 451-472.
4 T. C. Papanastasiou, “Flows of materials with yield”, J. Rheol., 1987, vol. 31, p. 385.
5 R. German, Powder Injection Molding, Design and Applications, Eds Innovative Materials Solutions, 2003.
6 B.O. Rhee, C.I. Chung, “Effects of the Binder Characteristics on Binder Separation in Powder Injection Molding”, 1992 Powder Injection Molding Symposium, San Francisco, CA, USA, Ed. MPIF, Princeton, NJ, 1992, pp. 131-153.
MIM Towards Enhanced Performance and Cost Reduction Dunstan Peiris - SolidMicron Technologies, Singapore
1. Introduction
The Metal Injection Moulding technology has found a prominent position in the precision engineering manufacturing as a product performance enhancing and cost cutting tool. The increasing transparency of this multi stage process is gradually leading MIM to be a standard manufacturing process. Over the past five years the number of captive and jobbing players has increased. The increased number of MIM operations has prompted design engineers to take advantage of the capabilities encouraged by the purchasing community. MIM being ideally a mass production process, the cost advantage needs to be harnessed through consistent quality and high yields. MIM parts need to satisfy the material cost – processing cost - processing yield envelop to be an effective cost cutting tool. In addition to these, the design and material flexibility offered by MIM lead to generating designs and materials contributing to enhancement of product performance.
MIM parts are increasingly used in high performance applications. This requires the MIM parts to demonstrate wrought bar design properties. In the past MIM parts were predominantly used for static applications that did not demand serious cyclic fatigue properties. Examples of such applications are parts for hard disc drive, watches, counter weights, etc. As such, not much emphasis was given to high strength and cyclic or dynamic loading requirements. Industries like automotive, aerospace, firearms, power etc. are looking for ways to optimize the performance of the products at a proportionate cost advantage. It is commonly experienced that these new dynamic applications are in high performance strategic components or modules. They have to demonstrate mechanical properties that can be extreme while satisfying a multiple of physical properties. These demands lead to high value added designs, materials, processing techniques and testing. MIM is evolving to confront these challenges.
2. Challenges
The parts that are manufactured for high performance application need to be reliable. Design engineers establish the reliability by using the physical and mechanical properties of wrought bar material as reference. A general assumption made by design engineers with regard to MIM parts is that the mechanical properties are 15% to 20% lower than that of wrought bar material. This assumption eliminates a range of high performance applications out of reach for MIM parts. Accordingly, it is important to manufacture MIM parts with wrought bar material properties thus opening very important market segments requiring advanced applications.