Publisher’s version / Version de l'éditeur:
Vous avez des questions? Nous pouvons vous aider. Pour communiquer directement avec un auteur, consultez la première page de la revue dans laquelle son article a été publié afin de trouver ses coordonnées. Si vous n’arrivez Questions? Contact the NRC Publications Archive team at
[email protected]. If you wish to email the authors directly, please see the first page of the publication for their contact information.
https://publications-cnrc.canada.ca/fra/droits
L’accès à ce site Web et l’utilisation de son contenu sont assujettis aux conditions présentées dans le site LISEZ CES CONDITIONS ATTENTIVEMENT AVANT D’UTILISER CE SITE WEB.
Technical Report; no. TR-2011-14, 2011-07
READ THESE TERMS AND CONDITIONS CAREFULLY BEFORE USING THIS WEBSITE. https://nrc-publications.canada.ca/eng/copyright
NRC Publications Archive Record / Notice des Archives des publications du CNRC :
https://nrc-publications.canada.ca/eng/view/object/?id=998beb8f-f01a-484f-aefb-716c32a84d54 https://publications-cnrc.canada.ca/fra/voir/objet/?id=998beb8f-f01a-484f-aefb-716c32a84d54
NRC Publications Archive
Archives des publications du CNRC
For the publisher’s version, please access the DOI link below./ Pour consulter la version de l’éditeur, utilisez le lien DOI ci-dessous.
https://doi.org/10.4224/19456788
Access and use of this website and the material on it are subject to the Terms and Conditions set forth at
Human thermal responses in extreme conditions Power, Jonathan; Simões Ré, António
DOCUMENTATION PAGE REPORT NUMBER
TR-2011-14
NRC REPORT NUMBER DATE
July 2011
REPORT SECURITY CLASSIFICATION
Unclassified
DISTRIBUTION
Unlimited
TITLE
HUMAN THERMAL RESPONSES IN EXTREME CONDITIONS
AUTHOR (S)
J. Power, A. Simões Ré.
CORPORATE AUTHOR (S)/PERFORMING AGENCY (S)
National Research Council, St. John’s, NL
PUBLICATION
SPONSORING AGENCY(S)
Transport Canada
IOT PROJECT NUMBER
42_2435_16
NRC FILE NUMBER KEY WORDS
Immersion suit, immersion, deep body temperature, heat flow, skin temperature, water leakage, wind, waves. PAGES v, 33, App. A FIGS. 24 TABLES 4 SUMMARY
The thermal responses of 12 volunteers were measured over 3 hour immersions in 5°C water and air in a calm condition,(Calm) and in a condition that included wind and increased water velocity (Weather). Immersions in the Weather condition resulted in a significantly greater increase in mean skin heat flow (MSHF) compared to Calm.
Immersions in the Weather condition resulted in a significantly greater rate of change of mean skin temperature compared to Calm. There were no significant differences in the rate of change of deep body temperature, mean body temperature, and oxygen consumption between the two conditions.
The use of a flume system in this experiment allowed for the successful replication of the increase in heat flow due to waves in a facility that was not capable of wave generation. Wind and waves, and the addition of water underneath the immersion suit, will cause a significant increase in MSHF compared to calm conditions while dry inside the suit. This increase in MSHF may be compensated for by people, but at great effort on their part. When testing people in immersion suits, it is important to consider the effort expended to maintain a stable deep body temperature in the specific test conditions. More severe conditions than those tested, may push people past their thermoregulatory capabilities, resulting in falls in deep body temperature.
ADDRESS National Research Council
National Research Council Conseil national de recherches Canada Canada Institute for Ocean Institut des technologies
Technology océaniques
HUMAN THERMAL RESPONSES IN EXTREME CONDITIONS
TR-2011-14
Jonathan Power António Simões Ré
ACKNOWLEDGEMENTS
The research team would like to thank Transport Canada for their continued financial support and interest in this work.
We would also like to thank all the exceptionally talented people at NRC-IOT who were involved in this project for their hard work and effort. The project would never have been completed if it were not for their creative, insightful input and dedicated support.
The primary author would like to thank Dr. Peter Tikuisis for his generous assistance and contributions to this work.
Last, but certainly not least, we would like to extend a very big thank you to all the participants who volunteered for this study. All the participants were a pleasure to work with thanks to the positive, accommodating attitude they had during the experiment.
TABLE OF CONTENTS
Acknowledgements... i
List of Tables ... iii
List of Figures ... iv Glossary ...v 1.0 INTRODUCTION...1 1.1 Experimental Hypotheses ...3 2.0 TEST SETUP ...4 2.1 Thermal Flume...5 2.2 Environmental Conditions ...6 3.0 PARTICIPANTS...7 3.1 Immersion Suits ...7 3.2 External Bladders...7 4.0 INSTRUMENTATION ...8
4.1 Heat Flow Sensors ...8
4.2 Gastrointestinal pills ...10
4.3 Heart Rate Monitor ...10
4.4 Metabolic Measurements ...11
4.5 Body Composition Measurements...12
5.0 PROCEDURE ...13
5.1 Calculations...14
5.1.1 Mean Skin Temperature and Mean Body Temperature...14
5.1.2 Mean Skin Heat Flow ...15
5.1.3 Surface Area...15
5.1.4 Metabolic Rate ...15
5.1.5 Clo Value ...16
5.1.6 Predicted V·O2 to Maintain Thermal Balance ...16
5.2 Statistical Analyses ...16
6.0 RESULTS ...16
6.1 Urine Production...17
6.2 Mean Skin Heat Flow ...18
6.4 Gastro Intestinal Temperature Change ...20
6.5 Mean Body Temperature Change ...21
6.6 Oxygen Consumption ...22
6.7 Clo Value ...23
7.0 DISCUSSION ...24
7.1 Cold Exposure Survival Model Predictions...25
7.2 Change in Clo Value...27
7.3 V·O2 Required to Maintain Thermal Balance...28
8.0 RECOMMENDATIONS...31
9.0 REFERENCES...32
APPENDIX A: Cold Exposure Survival Model Survival Time Predictions Reports LIST OF TABLES Table 2.1: Immersion conditions. ...6
Table 3.1: Participant anthropometric data...7
Table 4.1: Measurements acquired from the participants during the immersions...12
LIST OF FIGURES
Figure 2.1: Concept drawing of the Ice Tank located at NRC-IOT...4
Figure 2.2: Test setup...5
Figure 2.3: NRC-IOT Thermal Flume. ...6
Figure 3.1: White’s Marine Abandonment Suit...7
Figure 4.1: Heat flow sensor...8
Figure 4.2: Self contained data loggers connected to heat flow sensors (second logger is magnetically attached behind logger “Skin Temp A2” pictured in photo.) ...9
Figure 4.3: Logger package in the vest worn by a participant...9
Figure 4.4: CorTemp Ingestible Sensor pill...10
Figure 4.5: CorTemp Data Recorder. ...10
Figure 4.6: Polar Heart Rate monitor...11
Figure 4.7: Cardio Coach CO2...11
Figure 4.8: Tanita Body Composition Analyzer (Method 1)...12
Figure 4.9: Beta Technology Skin Fold Callipers (Method 2). ...13
Figure 5.1: Heat flow sensor placement. ...13
Figure 6.1: Rate of urine production (Mean [SD]. n =10). ...17
Figure 6.2: MSHF at 1 hour (Mean [SD]. n =12. * = P < 0.05). ...18
Figure 6.3: Rate of change in TSK (Mean [SD] n =11. P < 0.05). ...19
Figure 6.4: Rate of change of TGI (Mean [SD]. n = 12)...20
Figure 6.5: Rate of change of MBT (Mean [SD]. n = 11). ...21
Figure 6.6: V·O2during the last 20 minutes of immersion (Mean [SD]. n = 12.). ...22
Figure 6.7: Clo values for the present experiment (Nov 2010) and previous work (Mar 2009). (Mean [SD]. ** = P < 0.001. n= 11 for Nov 2010; n = 12 for Mar 2009). ...23
Figure 7.1: CESM predicted survival times for two separate groups of participants. (“Dry” = no water underneath immersion suit, “Wet” = 500mL of water underneath immersion suit. “Turbulent” = wind and waves) (25). ...26
Figure 7.2: % change in Clo from calm water values in various immersion conditions. ...27
GLOSSARY NRC National Research Council of Canada IOT Institute for Ocean Technology OEB Offshore Engineering Basin TC Transport Canada
PERD Program for Energy Research and Development REB Research Ethics Board
PFD Personal Flotation Device CSR Cold Shock Response LSA Life Saving Appliances
JONSWAP Joint North Sea Wave Analysis Project SD Standard Deviation
TSK Mean Skin Temperature (°C) MBT Mean Body Temperature (°C) MSHF Mean Skin Heat Flow (W·m-2) V·O2 Oxygen Consumption (L·min-1)
HUMAN THERMAL RESPONSES IN EXTREME CONDITIONS 1.0 INTRODUCTION
Across the world, many people in varying industries work or travel over open water. Since the majority of the planet is covered in water that is below human thermoneutral temperatures, the use of life saving appliances that offer thermal protection is often required. If an unprotected human was to become suddenly immersed in cold water (< 15°C) a series of physiological responses termed the “Cold Shock Response” occur that are responsible for the majority of drowning deaths within the first few minutes of immersion (27). Even in unprotected individuals, hypothermia (a drop in deep body temperature of 2°C or more) does not usually occur before 30 minutes of immersion (11).
Life Saving Appliances (LSA), such as Personal Flotation Devices (PFD), liferafts, and lifeboats, are required on any sea-faring vessel in order to improve the survival changes of those on board; the best approach to protecting people from the cold water is to keep them out of it. In an emergency situation however, there is always a chance that the people will be immersed. In these situations, immersion suits can greatly increase the chance of a person being able to avoid the CSR, and prolong their survival time.
Current Transport Canada (TC) regulations require immersion suits to be carried on board all class 9 ships and higher, in a sufficient quantity for every person on board. Offshore oil installations follow a similar policy. The immersion suits are usually a one-piece suit system that provides thermal protection and buoyancy to the wearer (1).
Current Canadian General Standards Board (CGSB) requirements for marine abandonment suits (CAN /CGSB-65.16-2005) are for them to be tested for material strength, flame resistance and thermal protective properties. The thermal protective properties can be tested using a thermal manikin or human participants. For human participant tests, a rectal thermometer measures deep body temperature; the skin temperatures of the index finger and large toe are also measured. The participant is immersed in calm, circulating 0-2°C water for up to 6 hours. The test is terminated if the deep body (core) temperature of the participant drops 2°C lower than baseline conditions, if the finger or toe temperature drops below 5°C, or the if the attending physician determines the participant should not continue (1).
A knowledge gap currently exists between the calm water testing conditions used to determine human thermal responses in immersion suits, and a marine accident. This knowledge gap between how people in immersion suits perform in controlled laboratory conditions and during a marine accident can lead to what Tipton referred to as “unexpectedly, poor performance” when the latter occurs (26). Unfortunately, recent marine accidents with people in immersions have occurred that have resulted in “unexpectedly, poor performance” compared to predicted survival times.
In February 2008 off the North East coast of Newfoundland, the Checkmate III began taking on water forcing the two crew members to don immersion suits and abandon ship into the water. The crew members managed to radio for help before abandoning ship and Search and Rescue
(SAR) assets were deployed to the area. In less than 2 hours, a SAR fast rescue craft recovered the two men from the water, only to find that they had both perished. Later reports into the accident found that while the immersion suits were donned properly, they were in poor condition (12). In the expert opinion of the Coast Guard captain of the ship that recovered the men “….the suits must either have suffered a spectacular failure, or the suits were not properly fitted prior to the casualties abandoning the vessel” (12).
On March 12th 2009, Cougar flight 491 crashed off the eastern coast of Newfoundland, killing 17 of the 18 occupants of the helicopter. The sole survivor of the incident was wearing a helicopter transportation immersion suit that, while certified to a different standard (CAN/CGSB-65.17-99) than marine abandonment suits, passed the same thermal protective tests required by CAN/CGSB-65.16-2005. Even though the sole survivor was in the water for only approximately 90 minutes, his deep body temperature was near lethal values (~29°C) by the time he arrived at the hospital less than 2 hours after the crash. Predicted survival times for the survivor were higher than what was actually observed (3) .
Previous works conducted by other authors have investigated the change in performance of humans and immersions in moving calm water, to conditions that include wind and waves. Tipton reported a 30% reduction in predicted survival times for participants wearing a non-insulated immersion suit when they were immersed in wind and waves compared to calm water (26). Ducharme and Brooks found that wave heights 30cm and above produced a significantly greater increase in heat flow for participants wearing an un-insulated immersion suit compared to calm water, but no drop in deep body temperature (4).
Other authors have found contradictory results with regards to the effect of rough weather compared to calm water immersions. Hayes et al. found that wave motion did not significantly increase the rate of body cooling compared to calm conditions across a variety of clothing ensembles, ranging from swimming trunks to flight suits with long underwear underneath (10). Later work carried out by Steinman et al. examined the effects of rough seas on the thermal performance of several anti-exposure garments ranging from wet suits to dry immersion suits (22). When the participants wore loose fitting wet suits, mean rectal temperature and back skin temperature decreased significantly in rough conditions compared to calm (22). When the participants wore two different kinds of dry immersion suits, there was no significant difference in the rate of change of rectal temperature between immersions in calm and rough water for one suit. The other suit had a significantly greater change in rectal temperature for calm immersions compared to rough conditions (22).
The contradictions in the literature on the effects of wind and waves on the thermal responses during immersion were the rationale for the formulation of the project: “Human Thermal Regulation in Wind and Waves”. This multi-year project was funded by both Transport Canada and the Program for Energy Research and Development, and consisted of three separate studies.
differences in the change of deep body temperature was measured. The lack of change of deep body temperature was attributed to the short immersion durations, and relatively warm water (~10°C) and air (~17°C) temperatures.
Building upon the results of the March 2008 study, a new study conducted in March 2009 examined thermoregulatory responses during 3 hour immersions in varying wind and wave conditions (20). Twelve healthy males performed 3 hour immersions in the following conditions: Calm water (Calm); 0.34m waves and 3.5m·s-1 wind (Weather 1); and in 0.67m waves and 4.6m·s-1 wind (Weather 2). Similar to our earlier findings, the two weather conditions (Weather 1 and 2) produced a significantly greater increase in MSHF compared to Calm. Also similar to our previous findings, there were no significant differences in the measured change in deep body temperature, which was attributed to the warm water (~11°C) and air (~17°C) temperatures, and the high quality of the immersion suit used (20).
A third study in the project was conducted in March 2010 and built upon the findings of the previous two. Current CGSB standards assume that water ingress into immersion suits is an eventuality, and water leakage was reported in the immersion suit of the sole survivor of Cougar Flight 491 (3). To simulate water leakage into immersion suits, 500mL of water was applied underneath the immersion suits worn by our 12 male participants in the March 2010 study over their torsos. Tipton and Blami reported that 500mL of water applied over the torso of their participants resulted in a 30% degradation in clothing insulation of their un-insulated immersion suits (28). We hypothesized that the addition of the 500mL of water underneath the immersion suit, in combination with wind and waves, would result in a significant decrease in deep body temperature.
There were no significant decreases in deep body temperature measured across all immersion conditions with the 500mL of water applied to the torsos of our participants (19). Even with the water underneath the immersion suit, the participants were able to successfully thermo regulate in the conditions and maintain a stable deep body temperature. One of our recommendations following that study was to conduct immersions with wind and waves in colder water and air temperatures. A higher thermal gradient between the participants and external environment may result in them not being able to thermo regulate and maintain a stable deep body temperature (19).
Our recommendation to conduct further testing in colder water and air temperature was the rationale for the work described in this report. The Ice Tank at NRC-IOT is capable of producing, and maintaining, air temperatures below –20°C, but has no wave generation capability. To replicate the increase in heat loss due to wave action, NRC-IOT fabricated a “thermal flume”. The thermal flume was designed to allow water to travel past a participant at a rate equivalent to that of the largest waves used in our previous experiments.
1.1 Experimental Hypotheses
1. Immersions in cold conditions that include wind and increased water movement (flow) past the participants will cause a significantly greater increase in mean skin heat flow compared to calm conditions.
2. Immersions in cold conditions that include wind and flow will cause a significantly greater decrease in deep body temperature compared to calm conditions.
2.0 TEST SETUP
All experimental trials were conducted in the National Research Council of Canada’s Institute for Ocean Technology’s (NRC-IOT) Ice Tank. The Ice Tank is a rectangular tank 90m in length, 12m in width, and 3m in depth. The Ice Tank uses an ammonia based refrigeration system to allow for temperatures as low as –30°C. A tow carriage runs along a series of rails on the north and south side of the Ice Tank.
Figure 2.1: Concept drawing of the Ice Tank located at NRC-IOT
On the east end of the Ice Tank, scaffolding was erected and a movie screen was secured to it to allow participants to watch movies during the immersions. At the base of the scaffolding was a single, analog controlled fan that generated wind. A stairway was built from additional scaffolding to allow the participants to walk into and out of the water.
Figure 2.2: Test setup.
2.1 Thermal Flume
In order to produce the necessary current speeds equivalent to the wave particle velocity associated with 0.67m waves, the volume of water to be moved past the participant had to be reduced. A box fabricated from sheets of plywood was constructed to reduce the total volume of water around the participant. The box was open on the top and back end. At the front end of the box were a series of cylinders that were used to straighten the flow of water past the participants. Five DC powered Duramaxx trolling motors were attached to the outside of the box and pushed water through the cylinders, which subsequently straightened the flow of water, and past the participants. Six Pitot tubes were installed in the box to measure flow speed.
Figure 2.3: NRC-IOT Thermal Flume.
2.2 Environmental Conditions
Table 2.1 provides the wind speeds, flow velocity, water temperature, and air temperature of the two immersion conditions. The flowspeed used was equivalent to the wave particle velocity of a wave with a height of 0.67m, and period of 1.71s.
Table 2.1: Immersion conditions. Condition Mean Flow
Speed (m·s-1) Mean Wind Speed (m·s-1) Mean Water Temperature (SD) (°C) Mean Air Temperature (SD) (°C) Calm 0 0 4.7 (0.1) 5.0 (0.1) Weather 0.80 4.6 4.8 (0.1) 4.8 (0.1)
In order to prevent the risk of injury to the participant from physical contact with the equipment, the wind speed was calibrated prior to any human immersions. A custom-built wind anemometer was placed in the flume in the location where the participants would be during the tests, with a second one mounted on the leading edge of the flume. The wind speed was calibrated with the two anemometers in place, and the anemometer in the location of the participant was removed. All further Weather conditions were run with the calibrated drive signal voltage. The remaining anemometer was used to ensure the correct drive signal was being used.
3.0 PARTICIPANTS
A required sample size of 11 participants was determined using a power calculation (95% confidence interval, σ = 0.5, β = 0.3); however 12 healthy individuals volunteered for this study. All participants gave their written informed consent to participate, and NRC’s Research Ethics Board approved the protocol (NRC-REB#: 2010-43). Before starting any of the tests, the participants underwent a medical screening by a certified doctor to determine if they were physically fit to participate. The anthropometric data of the participants is given in Table 3.1.
Table 3.1: Participant anthropometric data.
n = 12 Age Height (cm) Weight (kg) Body Fat % Surface Area (m2) Mean 25.5 180.75 87.93 20.3 2.10 SD 5.9 5.15 17.17 5.5 0.23 3.1 Immersion Suits
White’s Marine Abandonment Suit was selected for use during this study, pictured in Figure 3.1.
Figure 3.1: White’s Marine Abandonment Suit.
3.2 External Bladders
In order to allow the participants to urinate throughout the 3-hour immersion, an external bladder was attached to them. The external bladder consisted of a condom catheter, a urine collection bag, and the absorbent powder from the Travel John disposable urinal (Reach Global Industries, Irvine, CA, USA) in the bag. The external bladder was worn by the participants underneath their clothing, and allowed them to urinate throughout the immersion. The pre-immersion weight of
the external bladder was subtracted from the post immersion weight to calculate the amount of urine produced during the trial.
4.0 INSTRUMENTATION 4.1 Heat Flow Sensors
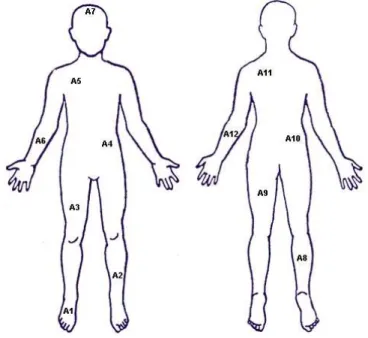
Heat flow sensors manufactured by Concept Engineering (Old Saybrook, CT, USA) were used to measure both heat flow and skin temperature at 12 different sites on the body based on the Hardy and DuBois weighting formula, with a slight modification as no measurements were taken from the hand (9). The sites used were: the right foot; left shin; right calve; right quadriceps; left hamstring; left abdominal; right lower back; left scapula; right pectoral; underside of the right forearm; top of left forearm; and the forehead.
Figure 4.1: Heat flow sensor.
The heat flow sensors were connected to self-contained data loggers manufactured by ACR data systems (Surrey, BC, Canada). Two separate types of ACR data loggers were used: a logger that could measure the heat flow, and a second that was able to measure skin temperature. The loggers were self-contained and the data collected during the immersion was stored and downloaded immediately after the trial was completed. Heat flow and skin temperature were measured once every 8 seconds.
Figure 4.2: Self contained data loggers connected to heat flow sensors (second logger is magnetically attached behind logger “Skin Temp A2” pictured in photo.)
The logger and heat flow sensor system were protected from mechanical stress during the immersion by being attached to a plastic guard by Velcro, and then sealed inside a splash-proof bag. The logger packages were then placed inside a thin mesh vest, which provided little to no thermal insulation, worn by the participants over their test clothing, seen in Figure 4.3.
4.2 Gastrointestinal pills
Gastro-intestinal temperature (TGI) was measured using CorTemp Ingestible Sensor pills manufactured by HQ Inc (Palmetto, FL, USA). The pills measure 22.4mm long with a diameter of 10.9mm, and contain a temperature sensor.
Figure 4.4: CorTemp Ingestible Sensor pill.
The pills transmitted the readings wirelessly to the CorTemp Data Recorder (also manufactured by HQ Inc.) that was housed inside the vest worn by the participants. This was the same vest that contained the data loggers packages.
Figure 4.5: CorTemp Data Recorder.
In turn, the data recorder stored the measurements from the pills and transmitted the values wirelessly in real time to a base station computer. This allowed the research team to monitor the TGI of the participants to ensure that no one experienced a drop of more than 2°C. TGI was measured once every 20 seconds through the use of the pills.
4.3 Heart Rate Monitor
Heart rate was measured using a Polar Heart Rate monitor manufactured by Polar Inc. (Lake Success, NY, USA). The heart rate monitor consists of a band worn around the chest, with conducting gel applied to the back of the band.
Figure 4.6: Polar Heart Rate monitor.
The polar heart rate monitor measured the heart rates of the participants and was recorded wirelessly by the CorTemp Data Recorder. The CorTemp Data Recorder then transmitted the heart rate data wirelessly, in real time, to a shore-based computer where the research team could monitor it. The heart rate was measured and recorded once every 20 seconds.
4.4 Metabolic Measurements
V·E , V·O2 , and V·CO2 measurements were made every 15 seconds using a Cardio Coach CO2, manufactured by KORR Medical Technologies (Salt Lake City, UT, USA.) Participants wore disposable latex facemasks that allowed their exhaled gases to travel through a ~12m tube to the Cardio Coach CO2 located on the shore.
Figure 4.7: Cardio Coach CO2
Table 4.1 summarizes the different measuring devices, respective sample rates, and units of measure during immersions.
Table 4.1: Measurements acquired from the participants during the immersions.
Measurement Units Sample Rate
Heat Flow W·m-2 0.125 Hz
Skin Temperature °C 0.125 Hz
Deep body temperature °C 0.05 Hz
Heart Rate BPM 0.05 Hz V·E L·min -1 0.06 Hz V·O2 /V·CO2 L·min -1 0.06 Hz
4.5 Body Composition Measurements
Participant’s body fat percentage was measured using two separate methods:
Method 1: A body composition analyzer manufactured by Tanita Corporation of America Inc. (Arlington Heights, IL, USA). Before each immersion, the participants had two measurements taken using the body composition analyzer: the first measurement was using the scale with the person’s profile set to “normal”, the second with the profile set to “athlete”. Given the rather broad description of “athlete” by the manufacturer, the research team recorded both readings for body fat percentage from the analyzer.
Figure 4.8: Tanita Body Composition Analyzer (Method 1).
Method 2. Skinfold thickness measurements were also taken on each participant. Skin fold thickness was measured using skin fold callipers manufactured by Beta Technology (Santa Cruz, CA, USA). After the participants performed their last immersion, skin fold thickness was measured at the locations according to the Durnin and Womersly method for estimating body fat percentage (5).
Figure 4.9: Beta Technology Skin Fold Callipers (Method 2).
5.0 PROCEDURE
Participants were instructed to refrain from consuming alcohol the night before a test, and not to consume caffeine at least 3 hours before arriving at the facility. Upon arrival at the facility for their test, participants were tested to see if they still had a gastro-intestinal pill present from a previous trial. If they did not have a pill, they ingested a new one with a small amount of water at room temperature. If a pill was already present in the participant’s body, they did not consume a second and continued on with the protocol.
In a separate warm room, the participants put on a pair of swim trunks, and then attached the external bladder themselves. A research team member attached the 12 heat flow sensors to the participants in the locations illustrated in Figure 5.1:
Figure 5.1: Heat flow sensor placement.
Once the heat flow sensors were applied, the participants changed into a clothing ensemble that consisted of two pairs of wool socks, cotton sweat pants, cotton undershirt, swim trunks, and a
long sleeved cotton shirt. The clothing ensemble was based on CGSB testing standards (1), with the exception of the extra pair of wool socks added for this protocol to help reduce the risk of a non freezing cold injury. After the participants were dressed they donned the immersion suit and gloves, leaving it unzipped, and proceeded to the Ice Tank.
At the Ice Tank, the participant sat quietly on a chair while the loggers were initialized and checked for functionality. The immersion suit was then fully donned and a disposable metabolic face mask (KORR Medical Technologies, Salt Lake City, UT, USA) was secured to the participants. Five minutes of baseline data was collected while they sat quietly on the chair. After the baseline data collection the immersion suit was zipped closed, vented and then the participants descended the stairs into the ice tank where a research team member manoeuvred them into position into the flume. Once in the flume, a research team member secured their feet through an ankle tethered made out of plastic Taigon tubing. The research team member also helped the participant don a pair of leather mittens over the immersion suit gloves. This extra pair of gloves was used to help reduce the risk of a non-freezing cold injury from occurring. Participants were instructed to keep their hands out of the water, and to place them on their thighs.
The termination criteria for the immersions were:
1) A 2°C drop in deep body temperature from pre-immersion values. 2) 3-hour time limit was reached.
3) Participant request.
4) Finger or toe temperature dropped below 8°C for more than 15 minutes.
After the immersion was ended, the participants exited the water by the same set of stairs they used to enter, and all data was downloaded from the loggers at the monitoring station next to the experimental area. The participants returned to the warm room used for instrumentation where a research team member removed the immersion suit, sensors, and all clothing except the swimming trunks. The external bladder was removed by the participant and was then weighed. Participants were re-warmed in a circulating water bath filled with 40°C water. Once the deep body temperature of the participant approached pre-immersion values, they exited the water bath and changed into their street clothing. The participants were then offered hot beverages and snacks while they completed the exit questionnaire. After their well-being was assured, the participants were allowed to exit the facility.
5.1 Calculations
5.1.1 Mean Skin Temperature and Mean Body Temperature
Table 5.1: Skin temperature and heat flow measurement site weighting values (9). Measurement Site Weighting Value
Right Foot 0.07 Left Shin 0.065 Right Quadricep 0.095 Left Abdominal 0.0875 Right Pectoral 0.0875 Right Underarm 0.07 Forehead 0.07 Right Calve 0.065 Left Hamstring 0.095
Right Lower Back 0.0875
Left Shoulder 0.0875
Left Overarm 0.07
Due to the lack of the hand measurements, the calculated TSK value was divided by 0.95. The formula used for calculating TSK was:
TSK(°C) = (∑ (Measurement Site * Weighting Value))/0.95 (1) Previous work by Burton (2) has shown that Mean Body Temperature (MBT) is a combination of both deep body temperature (TGI in the present experiment) and TSK. MBT is calculated as the following:
MBT(°C) = (64% · TGI°C) + (36% · TSK°C) (2)
The change MBT and TSK was determined by averaging the values from a 5 minute segment at the beginning of the immersion, and subtracting from that the value calculated MBT and TSK during a 5 minute segment at the end of the immersion. This value was then divided by the length of the immersion to give the change of MBT and TSK per hour (°C·hr-1).
5.1.2 Mean Skin Heat Flow
Mean Skin Heat Flow (MSHF) was calculated using the same weighting values as described in 5.1.1 from measurements taken at 1 hour into the immersions.
5.1.3 Surface Area
Participant Surface Area (SA) was calculated by the following formula developed by Gehan and George (7):
SA(m2) = 0.1644 · Weight(kg)0.51456 · Height(m)0.42246 (3) 5.1.4 Metabolic Rate
Oxygen consumption (V·O2 ) for each condition was calculated by averaging the values measured during last 30 minutes of the immersion. V·O2 was used to calculate the metabolic rate (M·) for the participants using the following formula from Peronnet and Massicotte (17):
M· (W·m-2) = (281.65 + 80.65 · RER) · (V·O2 )/SA (4) RER was given a value of 1.0 due to the low sensitivity of M· to RER (23).
5.1.5 Clo Value
Clo value was calculated based on the formula as reported by Romet et al. (21).
Clo (°C/W/m2) = ((TSK – TWATER)/MSHF)/0.155 (5) 5.1.6 Predicted V· O2 to Maintain Thermal Balance
Equation (5) can be rearranged to predict MSHF (MSHFP) for a given Clo value, water temperature, and TSK.
MSHFP = (TSK – TWATER) / (Clo · 0.155) (6)
Substituting MSHFP for M· in equation (4) allows the calculation of the predicted V·O2 (V·O2 P) required to equal the heat lost to the environment, keeping the participants (with a SA of ~2.1m2) in thermal balance, for a given Clo value, water temperature, and TSK.
V·O2P = (MSHFP · SA) / (281.65 + 80.65 · RER) (7) 5.2 Statistical Analyses
The Shapiro Wilks test was used to test for normal distribution. A within subject, repeated measures study design was used for this experiment, and a between subject design was used when comparing the data to previous results. Analysis of variance (ANOVA) was performed on all collected results. Tamahrene T2 post hoc tests were performed to determine significance, with a P value of less than 0.05 considered as significant.
6.0 RESULTS
Two of the twelve participants requested to end the immersion before the 3-hour time limit during the Calm condition. Six of the twelve participants requested to end the immersions before the 3-hour time limit during the Weather condition. Many participants reported feeling pain in their hands and feet as the reason for ending the immersions early, while others reported feeling too cold to continue.
Due to the large number of immersions with varying durations, Mean Skin Heat Flow (MSHF) is reported at 1-hour into both the Calm and Weather conditions; Gastro Intestinal Temperature (TGI), Mean Skin Temperature (TSK), Mean Body Temperature (MBT) are reported as rates of change per hour (°C·hr-1); and V·O2 is reported during the last 30 minutes of the immersions.
6.1 Urine Production
Two participants did not urinate in the external bladder after their two immersions; as a result their data is not included in the analysis.
There was no significant difference in the rate of urine production (g·hr-1) between the two conditions (Figure 6.1). Urine production was 335.09 ± 216.92 g·hr-1 in Calm, and 349.61 ± 173.59 g·hr-1 in Weather.
Figure 6.1: Rate of urine production (Mean [SD]. n =10).
0.00 100.00 200.00 300.00 400.00 500.00 600.00 Calm Weather Immersion Condition Urine Production (g·hr-1)
6.2 Mean Skin Heat Flow
Participants had a significantly greater MSHF in Weather compared to Calm after being immersed for 1 hour (Figure 6.2). MSHF in Calm was 84.68 ± 5.61 W·m-2 and 105.79 ± 10.81 W·m-2 in Weather.
Figure 6.2: MSHF at 1 hour (Mean [SD]. n =12. * = P < 0.05).
0.00 20.00 40.00 60.00 80.00 100.00 120.00 140.00 Calm Weather Immersion Condition MSHF at 1 hour (W·m-2) *
6.3 Mean Skin Temperature Change
Immersions in Weather produced a significantly greater rate of change of TSK compared to Calm (Figure 6.3). The rate of fall of TSK in Calm was –1.21 ± 0.27°C·hr-1 and –1.62 ± 0.41°C·hr-1 in Weather.
Figure 6.3: Rate of change in TSK (Mean [SD] n =11. P < 0.05).
-2.50 -2.00 -1.50 -1.00 -0.50 0.00 Calm Weather Immersion Condition
Mean Rate of Tsk Change (°C·hr-1)
6.4 Gastro Intestinal Temperature Change
There was no significant difference in the rate of change of TGI between immersions in Calm and Weather (Figure 6.4). The rate of change of TGI in Calm was 0.07 ± 0.10°C·hr-1, and –0.04 ± 0.12°C·hr-1 in Weather.
Figure 6.4: Rate of change of TGI (Mean [SD]. n = 12).
-0.30 -0.25 -0.20 -0.15 -0.10 -0.05 0.00 0.05 0.10 Calm Weather Immersion Condition
6.5 Mean Body Temperature Change
There was no significant difference in the rate of change of MBT between immersions in Calm and Weather (Figure 6.5). The rate of change of MBT in Calm was –0.48 ± 0.10°C·hr-1, and – 0.61 ± 0.14°C·hr-1 in Weather.
Figure 6.5: Rate of change of MBT (Mean [SD]. n = 11).
-0.80 -0.70 -0.60 -0.50 -0.40 -0.30 -0.20 -0.10 0.00 Calm Weather Immersion Condition Rate of MBT Change (°C·hr-1)
6.6 Oxygen Consumption
There was no significant difference in V·O2 between immersions in Calm and Weather (Figure 6.6). V·O2 in Calm was 459.53 ± 80.06 mL·min-1, and 527.61 ± 120.63 mL·min-1 in Weather.
Figure 6.6: V·O2 during the last 20 minutes of immersion (Mean [SD]. n = 12.).
0.00 100.00 200.00 300.00 400.00 500.00 600.00 700.00 Calm Weather Immersion Condition Me a n VO2 (ml·min-1 )
6.7 Clo Value
For the current experiment, immersions in the Weather condition resulted in a significantly lower Clo value compared to Calm (Figure 6.7 – Nov 10). The Clo value was 1.88 ± 0.14 Clo in Calm and 1.38 ± 0.19 Clo in Weather.
Our previous work that examined the effect of wind and waves on human thermal responses is presented in Figure 6.7 (20). The “Weather” condition for the Mar 2009 data consisted of a 20
-minute irregular JONSWAP wave spectrum with a maximum wave height of 0.67m and a period of 1.71s, and a mean wind speed of 4.6m·s-1. Immersions in this condition resulted in a significantly lower Clo value compared to Calm (Figure 6.7). The Clo value was 1.87 ± 0.13 Clo in Calm, and 1.36 ± 0.13 Clo in Weather.
There were no significant differences between Clo values for Calm immersions in our current work (Nov 2010) and our previous work (Mar 2009). There were no significant differences between Clo values for Weather immersions in the current (Nov 2010) and previous work (Mar 2009).
Figure 6.7: Clo values for the present experiment (Nov 2010) and previous work (Mar 2009). (Mean [SD]. ** = P < 0.001. n= 11 for Nov 2010; n = 12 for Mar 2009).
0.00 0.50 1.00 1.50 2.00 2.50 Calm Weather Immersion Condition Clo Va lue (Clo) Mar 2009 Nov 2010 ** **
7.0 DISCUSSION
The results collected from this present experiment support the hypothesis that immersions in wind and flowing water will significantly increase heat flow compared to calm water. However, the results do not support the hypothesis that immersions in wind and flow will result in a significantly greater decrease in deep body temperature compared to calm water in the conditions tested.
Our previous work examined the effect of wind and waves on the thermal responses of people when they were dry inside immersion suits (18, 20) and with 500mL of water underneath the suit (19). The findings of the current study are in agreement with our previous results: immersions in turbulent conditions will result in a significantly greater increase in heat flow compared to calm water. Remarkably, the increase in heat flow moving from calm water to the wind and flow in the present study is equivalent to the increase seen when moving to wind and waves in our previous work (20). In the present study, MSHF significantly increased by ~26% when moving from Calm to Weather (Figure 6.2). In our previous work, MSHF increased by ~26% when moving from Calm to Weather 2 (wind and waves) (20). The change in Clo value (measure of insulation) was identical between both studies when moving from Calm to Weather conditions. In the present study, the White’s Marine Abandonment Suit had a Clo value of 1.88 in Calm and 1.38 in Weather. In the March 2009 study, the same suit had a Clo value of 1.87 in Calm, and 1.36 in Weather 2. There were no significant differences in the calculated Clo values for the Weather condition in the present study, and the Weather 2 condition in the March 2009 study (Figure 6.7). This extremely good agreement in the changes in MSHF and Clo values between the two studies indicates that we were successful in replicating the increased thermal stress caused by wind and waves in a facility that had wind an a flow of water equivalent to the wave particle velocity of the waves tested in 2009.
In the present study, the increased MSHF due to the wind and current in the Weather condition did not result in a significant difference in the rate of TGI change when compared to Calm (Figure 6.4). This lack of significant difference is similar to that seen in our earlier work (20), and the work by other authors. The earlier work of Hayes et al. found that wave motion did not significantly increase the rate of body cooling, compared to calm conditions, when using un
-insulated immersion suits (10).
Even though V·O2 was higher in the Weather condition compared to Calm, the result was not statistically significant (Figure 6.6). This suggests that the human participants compensated for the significantly increased MSHF in the Weather condition (Figure 6.2) by a thermoregulatory response in addition to a slight increase in shivering. The significantly greater rate of change of TSK in Weather compared to Calm (Figure 6.3) suggests that participants compensated for the increased MSHF by a stronger vaso-constrictive response, reducing the thermal gradient between their deep body and the external environment.
significant difference in the rate of urine production between the two conditions (Figure 6.1), the mean rate for the two conditions of 349 g·hr-1 could prove to be detrimental to people immersed for prolonged periods of time. Tipton and Balmi found that 500mL of water applied over the torso of people in un-insulated immersion suits resulted in significantly increased skin heat flow (28). Assuming a urine density of 1mL·g-1, after only 90 minutes of immersion participants could produce an amount of urine in the suit that could prove to be detrimental to their survival if they were unable to resist the urge to urinate, and it was to spread over the torso.
The current body of work is in agreement with some previous studies, but contradicts others. Previous studies (4, 10) reported that wind and waves would have no effect on deep body temperature, compared to calm immersions, which is supported by this study. However, previous studies have show that immersions with simulated weather conditions can indeed cause a drop in deep body temperature in work coveralls (22), and Tipton has shown that predicted survival times can be reduced by as much as 30% in participants wearing un-insulated immersion suits in simulated weather conditions, compared to calm water (26).
The current study builds upon previous work funded by Transport Canada and the Program for Energy Research and Development (PERD). In our previous work, it was suggested that one of factors that may have resulted in no measured significant changes in deep body temperature was the environmental temperatures. Our previous studies (18-20) had water temperatures ranging from 8-11°C, and air temperatures between 15-18°C. Even though wind and waves significantly increased MSHF to the external environment, participants were able to compensate for it with their thermoregulatory responses. The goal of the current study was to test participants in colder water and air temperatures (5°C) in the hopes of exceeding their thermoregulatory responses, resulting in a drop in deep body temperature. The results from the current study show that even with the colder temperatures, participants were still able to thermo regulate in the immersion suits and prevent hypothermia from occurring.
7.1 Cold Exposure Survival Model Predictions
Data from our previous studies (19, 20) were inputted into the Cold Exposure Survival Model (CESM). The CESM is a software program designed to predict the survival time of people exposed to cold conditions (13, 24). The CESM predicts the amount of time it will take for a person’s deep body temperature to drop to the lethal level of 28°C (13). The CESM predicts survival time up to a maximum of 36 hours.
Survival time predictions were generated for two groups of our previous participants: the March 2009 group that performed 3 hour immersions while dry in their immersion suits (“Dry”), and the March 2010 group that performed 3 hour immersions with 500mL of water underneath their suits (“Wet”) (25). The predicted survival times are given in Figure 7.1.
Figure 7.1: CESM predicted survival times for two separate groups of participants. (“Dry” = no water underneath immersion suit, “Wet” = 500mL of water underneath immersion suit.
“Turbulent” = wind and waves) (25).
The predicted survival times for the participants in our previous studies are in agreement with the reported results. When our previous participants where immersed in calm and wind and wave conditions, while dry in the immersion suit, there were no significant decreases in deep body temperature (20). The CESM predicted survival times for the water temperatures this group of participants were immersed in (~11°C) are in excess of 36 hours for both calm and wind and wave conditions (25).
A separate group of participants in a subsequent study who where immersed in calm and wind and wave conditions, with 500mL of water underneath the immersion suit, also had no significant decreases in deep body temperature (19). The CESM predicted survival time for the specific water temperature this group of participants were immersed in (~8.5°C) was approximately 27 hours in calm conditions, and approximately 16 hours in wind and waves (25). Given the lack of measured significant changes in deep body temperature for the participants in that study, it is not unexpected that predicted survival times would be extremely long for the conditions tested.
For the current experiment with immersions in 5°C water and air, we measured no significant differences in the rate of TGI change across both immersion conditions; with the rate of change
calm, 5°C water, and dry inside their immersion suit. When moving to the Weather condition, the CESM predicted survival time drops to 26 hours.
The CESM results suggest that wind and waves can reduce predicted survival times, but in the water temperatures we have tested in, and the level of insulation provided by the White’s Suit, those times still remain high (> 15 hours). It is not until the water temperature nears 0°C and the insulation of the immersion suit is further reduced by the addition of 500mL of water that predicted survival times are under 10 hours (25).
7.2 Change in Clo Value
Using data collected from our previous work (19, 20), the change in Clo value moving from being dry in calm water to other conditions can be calculated (Figure 7.2).
Figure 7.2: % change in Clo from calm water values in various immersion conditions.
Adding 500mL of water underneath the White’s Marine Abandonment Suit resulted in a 24% drop in Clo value compared to when people were dry in the suit. Clo value dropped by 27% when moving from calm water to wind and waves, but still dry inside the immersion suit. The greatest decrease in Clo Value was observed when the participants were wet inside the immersion side in an environment with wind and waves, resulting in a 43% decrease. The reduction of Clo value in changing environmental conditions, compared to calm water, is important since it will result in significantly greater increases in heat flow from immersed people without any change in water or air temperature.
-0.45 -0.40 -0.35 -0.30 -0.25 -0.20 -0.15 -0.10 -0.05 0.00
Dry - Calm Wet - Calm
Dry - Wind and Waves
Wet - Wind and Waves Condition % Cha nge of Origina l Clo Va lue
7.3 V· O2 Required to Maintain Thermal Balance
In our past two experiments, and in the current one, all participants were able to successfully thermo regulate in all the test conditions, even with the increased thermal strain due to wind and waves. Our participants were able to achieve this thermal balance via reduction in skin blood flow (vaso-constriction) and increasing metabolic heat production to closely match the heat lost the environment (shivering).
Figure 7.3 plots the predicted V·O2 (V·O2 P) required by a 2.1m2 person to equal the heat flow lost to 0°C water across a range of skin temperatures (TSK) and Clo values to remain in thermal balance.
Figure 7.3: Predicted V·O2 to maintain thermal balance in 0°C water for a 2.1m 2
person.
Eyolfson and Tikuisis et al. reported a mean V·O2 of1.57L·min-1 associated with maximum shivering intensity in their study participants (6). At higher Clo (> 1.7) values, a V·O2 P of 0.70L·min-1 is required to match the heat flow to the environment, at a slightly lower than normal TSK (32°C); less than half the mean maximum V·O2 a person can achieve. This would suggest
0.10 0.25 0.40 0.55 0.70 0.85 1.00 1.15 1.30 1.45 1.60 1.80 1.95 10 18 26 34 0.00 0.50 1.00 1.50 2.00 VO2p (L·min-1)
Clo Values (Clo) Tsk (°C)
1.50-2.00 1.00-1.50 0.50-1.00 0.00-0.50
The current IMO Life Saving Appliances Code requires that insulated immersion suits prevent a 2°C drop in deep body temperature in 0-2°C calm, circulating water during a 6 hour immersion (16). If a completely dry immersion suit with an immersed Clo value of 0.80 is tested according to current IMO standards, Figure 7.3 indicates that a V·O2P of 1.31 L·min-1 (i.e. shivering at approximately 66% of their maximum ability) would be required by a 2.1m2 person, with a TSK of 28°C, to replace the heat lost to the environment and remain in thermal balance. Based on the results in Figure 7.2, we can expect a 27% drop in Clo value of the immersion suit when moving from calm water to an environment with wind and waves. This would change the immersed Clo value from 0.80 to 0.58. Referring back to Figure 7.3, this would result in a V·O2P of approximately 1.75 L·min-1 required to remain in thermal balance. Since this V·O2 is greater than the maximum shivering value of 1.57 L·min-1, the human would not be able to match the heat lost to the environment and would quickly enter heat debt. It is not until the TSK of the human dropped to 24°C that they would be able to theoretically match the heat flow to the environment, and even then only at their maximum ability to shiver.
In the above theoretical example, it was assumed that the immersion suit was completely dry. Before the beginning of the thermal tests, the IMO LSA code requires that immersion suits go through water ingress tests to calculate water leakage after a jump from a sufficient height to completely immerse the person, and a period of flotation in calm water for 1 hour, or swimming for 20min for a distance of at least 200m (16). After the jump test, the suit should not take on more than 500g of water, and after the swim test, the suit shall not take on more than 200g of water (16). Work conducted by the CORD Group Ltd. has suggested that these test methods will significantly underestimate the amount of water that could leak into a suit (15). If current LSA test standards do not provide a rigorous enough challenge of the ability of immersion suits to remain water tight, then it is possible that a significant amount of water may leak into the suits. The addition of as little as 500mL of water inside the immersion suit can result in a reduction in Clo value of 24%, even when remaining in calm water (Figure 7.2). If a dry immersion suit had a Clo value of 0.80 in calm, circulating water, the addition of 500mL of water underneath it in wind and waves would see that value reduced to 0.46. With a Clo value of 0.46, in 0°C water, and a TSK of 28°C, the V·O2 required to remain in thermal balance is 2.33L·min-1. In this scenario, the TSK of a person shivering at their maximum ability would have to drop to 18°C before thermal balance could be achieved (Figure 7.3).
In comparison to IMO standards, current CGSB standards for marine and helicopter immersion suits require that they provide an insulation value of at least 0.75 Clo when tested with a thermal manikin in 40cm waves (1). The new draft standard of the helicopter passenger transportation suit system standard (CAN/CGSB-65.17) will require that suits have at least 0.75 Clo in 20-25cm waves and 20-25 kph wind if using thermal manikins. If using humans, the environmental conditions remain the same with the exception that the water and air temperature is between 0-2°C. In 0°C water, a 2.1m2 person wearing a 0.75 Clo suit, would need to shiver at maximum ability (V·O2 ~ 1.57 L·min-1) to maintain a TSK of 30°C. In a recent study by the CORD Group
Ltd., participants performed 6 hour immersions in 0°C water with 15-30cm waves and 18-25 km·h-1 wind wearing a custom clothing ensemble that had a Clo value of 0.75 (14). Prior to the beginning of the tests, the participants had a TSK of 33.1°C. At the end of the 6- hour immersion, the participants (with a mean surface area of 1.99m2) had a reported TSK of 22.7°C, with a MSHF of 254 W·m-2. For a 1.99m2 person to replace 254 W·m-2 of heat lost to the external environment, they would have to shiver at a calculated V·O2 of ~1.42 L·min-1; a rate that is close to their maximum ability. In the conditions tested by the CORD Group, the majority of the participants were able to maintain a stable deep body temperature, possibly with great effort required on their part. Moving to environments with harsher conditions may result in an increase in heat lost to the environment, pushing people past their ability to thermo regulate, translating to a drop in deep body temperature.
It is concluded, that in conditions where the human body can thermo regulate, small, if any, changes may be measured in deep body temperature. The addition of wind, waves, water leakage, and colder water temperatures will increase skin heat flow to the external environment, placing more strain on the thermoregulatory system. If the thermoregulatory system can compensate for this increased strain, no change in deep body temperature may be measured, even in conditions that are perceived to be more challenging. Overestimation of performance of people in immersion suits will occur if generalized conclusions are made from tests without taking into consideration the conditions of the test, and the effort being made by the participants to maintain a stable deep body temperature. If participants are close to the limit of their ability to thermo regulate (i.e. maximum shivering), but still maintain a stable deep body temperature in a given set of conditions, harsher conditions may push them past their limits, resulting in a fall in deep body temperature. Therefore, it is important that when testing humans and immersion suits, to test them in conditions as realistic as possible, or be able to predict the effects that the conditions will have.
8.0 RECOMMENDATIONS
1. When assessing the performance of humans who have an active thermoregulatory system, it is important to measure both sides of the thermal balance equation, i.e. heat lost from the system, and heat put back into the system. An active thermoregulatory system may mean that a stable deep body temperature can be measured in two very different environments (e.g. calm, and wind and waves), since humans will try to regulate this variable. The difference between two conditions may not just be a significant increase in heat flow, but a significant increase in effort from the participants to regulate their deep body temperature through vaso-constriction and shivering. In circumstances where the body can thermo regulate, the definitive variable may not be body temperature. 2. It is recommended that the performance of humans and immersion suits be tested in
conditions as representative of the area of operation as possible. If this is not possible due to either financial, or mechanical, limitations, a correction factor or safety margin should be added into the final results. For example, if in the thermal tests as prescribed by the LSA code, a human is able to maintain a stable deep body temperature through a high level of shivering (i.e. V·O2 near 1.50 L·min-1), moving into conditions with wind and waves will result in increased thermal strain, exceeding the thermoregulatory system. If the tests could only be conducted in calm circulating water, Figure 7.2 provides possible correction factors for how much the Clo value of a suit can change when moving to the more challenging environments. By applying these correction factors, the amount of extra heat lost to the environment due to wind and waves can be calculated, allowing for an indication of how much effort a person would require to thermo regulate to maintain a stable deep body temperature (Figure 7.3). If this calculated increase in heat loss due to harsher conditions exceeds the thermoregulatory system, suit insulation can be increased to compensate for it.
3. If a facility lacks the ability to replicate waves found in the area of operation, an alternative may be to create a flume system similar to that described in this report. By moving water past the participants at the same rate of wave particle velocity, the heat loss effects can be replicated allowing for a more accurate assessment of performance in realistic conditions.
9.0 REFERENCES
1. Canadian General Standards Board. (2005).Immersion Suit Systems. CAN/CGSB-65.16-2005.
2. A. C. Burton. (1935). Human Calorimetry: The average temperature of the tissues of the body. J. of Nutr. 9:261-80.
3. T. S. B. of Canada. (2010). Aviation Investigation Report . Main Gearbox Malfunction/ Collision With Water. Cougar Helicopters Inc. Sikorsky S-92A, C-Gzch. St. John's, Newfoundland and Labrador, 35 NM E. 12 March 2009. . A09A0016.
4. M. B. Ducharme and C. J. Brooks. (1998). The effect of wave motion on dry suit insulation and the responses to cold water immersion. Aviat Space Environ Med. 69:957-64.
5. J. V. Durnin and J. Womersley. (1974). Body fat assessed from total body density and its estimation from skinfold thickness: measurements on 481 men and women aged from 16 to 72 years. Br J Nutr. 32:77-97.
6. D. A. Eyolfson, P. Tikuisis, X. Xu, G. Weseen and G. G. Giesbrecht. (2001). Measurement and prediction of peak shivering intensity in humans. Eur J Appl Physiol. 84:100-6.
7. E. A. Gehan and S. L. George. (1970). Estimation of human body surface area from height and weight. Cancer Chemother Rep. 54:225-35.
8. J. D. Hardy and E. F. DuBois. (1938). The technic of measuring radiation and convection. . J of Nutr. 15:461-75.
9. P. A. Hayes, S. P.J. and R. Crackness. (1985). Reactions to cold water immersion with and without waves. RAF Instiute of Aviation Medicine. 645.
10. J. S. Hayward and J. D. Eckerson. (1984). Physiological responses and survival time prediction for humans in ice-water. Aviat Space Environ Med. 55:206-11.
11. M. S. John's. (2008). Search and Rescue Operation Report: Sinking of Checkmate III: Case N2008-0015.
12. A. A. Keefe and P. Tikuisis. (2008). A guide to making stochastic and single point predictions using the Cold Exposure Survival Model. DRDC Toronto. TM 2008-61.
13. The CORD Group Ltd. (2011). Thermal Protection in Helicopter Passenger Transportation Suits for CAN/CGSB-65.17.
14. The CORD Group Ltd. (2009). Water Ingress Testing for Immersion Suits in Canada: Phase 2 (TC Report).
17. J. T. Power, A. J. Simoes Ré, S. N. MacKinnon, C. J. Brooks and M. J. Tipton. (2008). The evaluation of human thermal respones in wind and waves. National Research Council of Canada - Institute for Ocean Technology. TR-2008-10.
18. J. T. Power, A. J. Simoes Ré and M. J. Tipton. (2011). The effect of water leakage on human thermoregulatory responses in varying weather states. National Research Council of Canada - Institute for Ocean Technology. TR-2011-03.
19. J. T. Power, A. J. Simoes Ré and M. J. Tipton. (2009). The evaluation of human thermo-regulatory responses to varying weather states. National Research Council of Canada - Institute for Ocean Technology. TR-2009-18.
20. T. T. Romet, C. J. Brooks, S. M. Fairburn and P. Potter. (1991). Immersed clo insulation in marine work suits using human and thermal manikin data. Aviat Space Environ Med. 62:739-46.
21. A. M. Steinman, J. S. Hayward, M. J. Nemiroff and P. S. Kubilis. (1987). Immersion hypothermia: comparative protection of anti-exposure garments in calm versus rough seas. Aviat Space Environ Med. 58:550-8.
22. P. Tikuisis. (1999). Considerations for the measurement and analysis of heat debt for cold exposure. J. Human-Environ. Sys., 2:9-18.
23. P. Tikuisis. (1997). Prediction of survival time at sea based on observed body cooling rates. Aviat Space Environ Med. 68:441-8.
24. P. Tikuisis. (2010). Predictions of survival time for individuals imemrsed in water and wearing a wetted survival suit: phase 2. Report for NRC Institute for Ocean Technology Contract No. 743545.
25. M. J. Tipton. (1995). Immersion fatalities: hazardous responses and dangerous discrepancies. J R Nav Med Serv. 81:101-7.
26. M. J. Tipton. (1989). The initial responses to cold-water immersion in man. Clin Sci (Lond). 77:581-8.
27. M. J. Tipton and P. J. Balmi. (1996). The effect of water leakage on the results obtained from human and thermal manikin tests of immersion protective clothing. Eur J Appl Physiol Occup Physiol. 72:394-400.
APPENDIX A
Predictions of Survival Time for Individuals
Immersed in Water and Wearing a Survival Suit
Peter Tikuisis, Ph.D.4121 Powderhorn Crescent Mississauga, ON, Canada L5L 3B8
Report on survival time estimations for PJ 2264 prepared for Jonathan Power, NRC Institute of Ocean Technology.
Introduction
Search and Rescue is reliant on tools that guide decisions on rescue planning and operations, as for example having an estimation of a casualty’s survival status. One such tool is the Cold Exposure Survival Model (CESM), which is designed to predict the survival time (ST) of individuals exposed to cold, whether exposed to air or immersed in water (Tikuisis 1997; Keefe and Tikuisis 2008). This report presents the predictions of the survival status of individuals wearing a White’s Marine Abandonment Suit that was used in a series of cold water immersion experiments conducted by Power et al. (2008, 2009).
The first section of this report presents a comparison of measured and predicted values at the end of 3 h of the experimental immersion conditions reported by Power et al. (2009). The second section presents survival time predictions for hypothetical situations in which water leaks into the suits. This will demonstrate the incapacitation of survival suits when degraded by water leakage whether due to accident, poor fit, or poor maintenance. The final section will summarize the findings with recommendations for further inquiry.
Comparison of Measured and Predicted Thermal Status of Experimental Subjects
In brief, the experiment involved 3 hours of head-out immersion of 12 males (mean age 24 yrs, height 1.81 m, weight 83.2 kg, and body fat 16.8%) wearing a survival suit (White’s Marine Abandonment Suit with undergarment) in water at about 11C under both calm and turbulent conditions (Power et al. 2009). The in-situ insulation of the survival suit was measured using a manikin purposely designed for such an evaluation (CORD 2008). Under calm (windless flat water) and turbulent (5.5 m/s wind and 0.67 m waves) conditions, the survival suit’s in-situ insulation were 1.098 and 0.796 clo, respectively.
As a survival prediction model, CESM is designed to estimate the time taken for an individual’s deep body temperature to reach 28C, assumed as the point of imminent death due to
depending on the severity of the cold insult. That is, if heat loss is less than the individual’s maximum possible heat generation from shivering, then the individual should reach a steady state heat balance with no further decrease in body temperature until shivering fatigue (Tikuisis et al. 2002; Tikuisis 2003). Under this latter condition, which pertains to the experimental situation, the relatively short period of initial net heat loss upon immersion, typically
characterized by a transient rise in deep body temperature due to vasoconstriction of the skin, is bypassed in CESM. In practical terms, CESM’s prediction just after the start of immersion reflects the thermal response beyond the transient period and therefore will indicate lower body temperatures than actually measured. This is because the ‘modelled’ body is allowed to cool sufficiently so that the predicted rate of heat loss can be countered by the predicted shivering heat production, which is driven by decreases in both deep body and skin temperatures. The eventual prediction of survival time based on deep body cooling to 28C is not sensitive to the transient period given the relative shortness of the latter period to the former.
Assuming that the transient period is approximately 1 h for the immersion conditions of the study, Table 1 compares the CESM-predicted thermal response values after 2 h of immersion with the measured values of the subjects at the end of their 3 h of immersion. Table 1 also shows the predicted thermal status of the subjects at the end of 36 h of immersion, which is the limit of CESM’s predictive range (causes of death other than hypothermia are more likely to occur if individuals survive 36 h of immersion). An additional caveat of CESM is that it does not have an input field for wave height; instead, it only allows for either light or heavy seas. In the present circumstance, ‘light’ is assumed for the calm condition and ‘heavy’ is assumed for the turbulent condition (i.e., with wind and waves irrespective of their values provided that the individual experiences significant water movement, which is assumed for both Weather #1 and #2 conditions).
The predicted decreases in body temperatures are much greater than measured, which was not unexpected, as explained above. The predicted metabolic rate is higher than measured, driven by the predicted decreases in body temperatures. Notwithstanding the limitations of CESM, an
Of the subjects whose deep body temperatures initially rose upon immersion (6 and 9 for the calm and high turbulent conditions, respectively), they returned to their starting values after respective mean times of 73 and 62 min of immersion.
additional explanation for these overpredictions is taken up in the Discussion. That the measured heat loss exceeds the measured metabolic rate indicates that the subjects had not attained heat balance at the end of 3 h of imersion, which concurs with the further predicted decreases in body temperatures and increase in metabolic rate predicted after 36 h of simulated immersion.
Table 1. Measured and predicted changes in thermal status for the experimental test conditions. Water temperature was 11C, and respective wind speed and wave height were 3.5 m/s and 0.34 m for Weather #1, and 4.6 m/s and 0.67 m for Weather #2. Predicted values for the turbulent condition apply to both Weather #1 and #2.
Change in Deep Body Temperature (C) Condition
Meas SD Pred 2 h Pred 36 h
Calm 0.10 0.31 1.03 1.23
Weather #1 0.29 0.30
Weather #2 0.20 0.28 1.21 1.45
Change in Mean Skin Temperature (C) Meas SD Pred 2 h Pred 36 h
Calm 2.96 0.43 6.39 6.51
Weather #1 3.46 0.72
Weather #2 3.95 0.66 8.40 8.53
Mean Body Heat Flow and Metabolic Rate (W/m2) Meas BHF SD Meas MR SD Pred MR 2 h Pred MR 36 h Calm 63.0 3.0 55.8 7.6 68.5 82.5 Weather #1 76.8 6.3 57.9 19.0 Weather #2 79.5 6.2 62.6 11.5 93.9 96.8
Under no condition did CESM predict that the subjects’ deep body temperature would reach lethal hypothermia (drop of 9C) within 36 h of immersion. Indeed, the predicted changes in the