AUTOMATED NASAL FEATURE
DETECTION FOR THE LEXICAL
ACCESS FROM FEATURES PROJECT
by
Neira Hajro
Author
Certified by
Submitted to the Department of Electrical Engineering and Computer Science in Partial Fulfillment of the Requirements for the Degree of
Master of Engineering in Electrical Engineering and Computer Science
Massachusetts Institute of Technology
April 14, 2004
Copyright 2004 M.I.T. All rights reserved
Department of Elec rical Engineering and Computer Science April 14, 2004
'enneth N. Stevens Thesis Supervisor Accepted by
Arthur C. Smith Chairman, Department Committee on Graduate Theses
M4ASSACHUSETTS INSTI~ffTE
OF TECHNOLOGY
JUL 2 0 2004
LIBRARIES
AUTOMATED NASAL FEATURE
DETECTION FOR THE LEXICAL
ACCESS FROM FEATURES PROJECT
by Neira Hajro
Submitted to the Department of Electrical Engineering and Computer Science
April 14, 2004
In Partial Fulfillment of the Requirements for the Degree of Master of Engineering in Electrical
Engineering and Computer Science
ABSTRACT
The focus of this thesis was the design, implementation, and evaluation of a set of automated algorithms to detect nasal consonants from the speech waveform in a distinctive feature-based speech recognition system. The study used a VCV database of over 450 utterances recorded from three speakers, two male and one female. The first stage of processing for each speech waveform included automated 'pivot' estimation using the Consonant Landmark Detector - these 'pivots' were considered possible sonorant closures and releases in further analyses. Estimated pivots were analyzed acoustically for the nasal murmur and vowel-nasal boundary characteristics. For nasal murmur, the analyzed cues included observing the presence of a low frequency resonance in the short-time spectra, stability in the signal energy, and characteristic spectral tilt. The acoustic cues for the nasal boundary measured the change in the energy of the first harmonic and the net energy change of the 0-350Hz and 350-1000Hz frequency bands around the pivot time. The results of the acoustic analyses were translated into a simple set of general acoustic criteria that detected 98% of true nasal pivots. The high detection rate was partially offset by a relatively large number of false positives - 16% of all non-nasal pivots were also detected as showing characteristics of the nasal murmur and nasal boundary. The advantage of the presented algorithms is in their consistency and accuracy across users and contexts, and unlimited applicability to spontaneous speech.
Thesis Advisor: Kenneth N. Stevens
Tide: Clarence
J.
LeBel Professor of Electrical EngineeringTABLE OF CONTENTS L ist of F igures ... . . 7 L ist of T ables... . . 9 D edication ... . 12 Acknowledgements... 13 Chapter I: Introduction...14
Acoustic Studies of Speech ... 15
Sum m ary ... . 22
Chapter II: Landmark Estimation... 24
Database Description... 26
Consonant Landmark Detector (CLD)... 27
Designing the system in terms of the [s] landmark performance...38
Sum m ary ... . . 43
Chapter III: Acoustic Criteria as the Basis for Nasal Detection... 45
What are Acoustic Criteria? ... 46
Acoustic Criteria around the Landmark Point ... 47
Our approach to the Acoustic Criteria Analysis ... 50
General Processing of the signal...52
Sum m ary ... . . 53
Chapter IV: Nasal Boundary ... 54
Overview of the selected acoustic cues...55
Analysis of the AED acoustic cue ... 58
Analysis of H1 across the nasal boundary ... 67
Sum m ary ... . . 73
Chapter V: Nasal Murmur ... 75
Overview of the acoustic cues in Chen's algorithm...76
Reconstruction of Chen's algorithm for the nasal murmur detection...79
Performance of Chen's algorithm for the nasal murmur detection...82
Evaluation of Chen's acoustic cues and their effectiveness... 84
Effectiveness of the modified criteria ... 114
Performance of Chen's algorithm with the modified acoustic criteria .... 115
S u m m ary ... 1 16 Chapter V I: N asalized V ow el...117
Acoustic Cues for Nasalized Vowels...118
Analysis of the measured data...120
Semi-automated formant tracker functionality ... 121
S um m ary ... 12 5 Chapter VII: Formulating the Nasal Detection Module ... 126
Pivots as indicators of the change in signal energy ... 126
P ivot C ontexts...13 1 Performance of the Acoustic Criteria for the Nasal Boundary ... 134
Performance of the Acoustic Criteria for the Nasal Murmur...140
Combined Performance of the Nasal Boundary and Murmur Criteria.... 144
Minimizing the Computational Power by the algorithm...146
Contributions and Future Work...146
B ibliography... . ... 150
Appendix A: Results of the Sonorant Landmark Estimation ... 152
Appendix B: Results of the Pivot Analysis...164
LIST OF FIGURES
Number Page
1. Nasal detection processing in a feature-based system...25
2. Landmark tree implemented in Liu's CLD ... 29
3. Visual output of the CLD for utterance [ana]...32
4. Decision process in the sonorant landmark estimation...33
5. Liu's landmark tree adjusted for the sonorant landmark insertions...42
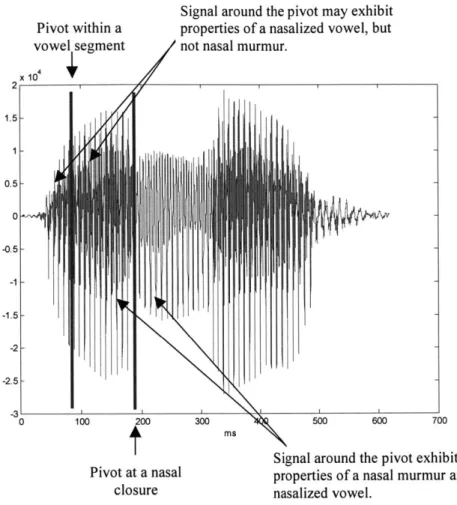
6. Contrasting the signal around a non-nasal and nasal pivot ... 47
7. Example of a significant cue ACI ... 49
8. ED value across 31 nasal [-s] landmarks...60
9. Individual net ED change for 31 nasal [-s] landmarks...61
10. ED value across 39 nasal [+s] landmarks ... 62
11. Individual net ED change for 39 nasal [+s] landmarks...63
12. Net ED change for 154 nasal and non-nasal [-s] landmarks...65
13. Net ED change for 96 nasal and non-nasal [+s] landmarks...66
14. Observations of the IAHIll cue for 70 nasal sonorant landmarks ... 69
15. IAHI
I
measured for 250 nasal and non-nasal sonorant landmarks...7016. IAHI
I
values for true and inserted sonorant landmarks...7317. Reconstruction of Chen's algorithm for the nasal murmur detection.. 80
18. JARMSI values for 251 nasal and non-nasal landmarks ... 88
19.
IARMSI
as a function of distance from the nasal landmark point ... 9020. fl values for 251 nasal and non-nasal landmarks...93
21. fl as a function of distance from the nasal landmark point ... 95
22. A1-A2 values for 251 nasal and non-nasal landmarks...97
23. A1-A2 as a function of distance from the nasal landmark point...100
24. A1-A3 values for 251 nasal and non-nasal landmarks ... 102
25. A1-A3 as a function of distance from the nasal landmark point ... 104
26. A2-A3 values for 251 nasal and non-nasal landmarks ... 106
27. A2-A3 as a function of distance from the nasal landmark point ... 108
28. SAD values for 251 nasal and non-nasal landmarks...110
29. SAD as a function of distance from the nasal landmark point...113
30. Graphic interface for the semi-automated formant tracker ... 122
31. HPROR values for pivots at nasal closures and releases ... 129
32. Analysis of the three pivot types based on the HPROR value...131
33. Frequency response of the low-pass FIR filter ... 168
34. Detailed view of the low-pass filter response in the 0-2000Hz range 169 35. Frequency response of the band-pass FIR filter ... 170
LIST OF TABLES
Number Page
1. Overview of the criteria used in the sonorant landmark estimation .... 31 2. CLD performance results for the VCV database...35
3. Detection rates for the CLD based on the landmark type ... 36
4. Performance of the sonorant landmark detector based on the adjacent vow el... 37
5. Pivot analysis for the VCV database ... 40
6. Interpretation of p-values in the ANOVA statistical analysis...51 7. ANOVA test results examining differences in the AED
characteristics for nasal and non-nasal [-s] landmarks...65
8. ANOVA test results examining differences in the AED
characteristics for nasal and non-nasal [+s] landmarks...67
9. ANOVA test results examining differences in the JAHi characteristics for nasal and each group of non-nasal sonorant landm arks... ... 71
10. Performance of the reconstructed algorithm proposed by Chen...83
11. ANOVA test results examining differences in the JARMS1 characteristics for nasal and each group of non-nasal sonorant landm arks... . . 88 12. Comparison between the
IARMSI
characteristics measured withautomated algorithms and those originally observed by Chen ... 89
13. ANOVA test results examining differences in the fl characteristics
for nasal and each group of non-nasal sonorant landmarks ... 93 14. Comparison between the fl characteristics measured with automated
algorithms and those originally observed by Chen ... 94
15. ANOVA test results examining differences in the A1-A2
characteristics for nasal and each group of non-nasal sonorant landm arks... . . 98
16. Comparison between the A1-A2 characteristics measured with automated algorithms and those originally observed by Chen ... 99
17. ANOVA test results examining differences in the A1-A3 characteristics for nasal and each group of non-nasal sonorant lan dm ark s...103
18. Comparison between the A1-A3 characteristics measured with automated algorithms and those originally observed by Chen ... 103
19. ANOVA test results examining differences in the A2-A3 characteristics for nasal and each group of non-nasal sonorant lan dm ark s...107 20. Comparison between the A2-A3 characteristics measured with
automated algorithms and those originally observed by Chen ... 107 21. ANOVA test results examining differences in the SAD
characteristics for nasal and each group of non-nasal sonorant lan dm ark s... 111 22. Comparison between the SAD characteristics measured with
automated algorithms and those originally observed by Chen ... 111
23. Effectiveness of Chen's cues in separating nasal from non-nasal
sonorant landm arks...114 24. Performance analysis of Chen's reconstructed algorithm with
m odified acoustic criteria...115
25. Hand-classification of estimated pivots in the VCV database based
on their location within the utterance...132
26. Pivot analysis based on their application in the nasal detection
m o d u le ... 134
27. Performance results of applying the AED criterion on the 1483
estimated pivots in the VCV database ... 135
28. Performance results of applying the JAHI
I criterion on the 1483
estim ated pivots ... 137
29. Performance results of applying the combined acoustic criteria for
30. Performance results of the aggregate acoustic criteria for the nasal
murmur on the 1483 estimated pivots...142
31. Results of applying the combined criteria for the nasal boundary and nasal murmur on the 1483 estimated pivots in the VCV database .... 144 32. Hand-classification of estimated sonorant landmarks in the VCV
database based on their location with the utterance ... 152 33. Results of the pivots analysis for 142 sonorant closures and releases
in the V C V database...164
Dedication:
To Dad, Mom, and Lejla
For their love and support
Posvedeno:
Tati, Mami i Lejli
Acknowledgments
First I would like to thank my thesis advisor, Kenneth Stevens, for giving me the opportunity to work in the Speech Communications laboratory. His guidance, support, and help have been crucial in the completion of this thesis and my experience as a graduate student at MIT.
I would like to thank Janet Slifka for keeping her office door open for questions,
concerns, and problems throughout my time in the lab. Her help with MATLAB was invaluable throughout my research work. My gratitude also goes to Tony Okobi and Steven Lulich for entertaining various questions and discussions regarding the results of my data analyses, and patience in sharing their extensive knowledge. My thanks also go to Vergilio Villacorta, Sherry Zhao, and the rest of the Speech Group for many fun afternoons spent in the lab.
I could not imagine a better academic advisor than Prof. Patrick H. Winston - I am
indebted for having him as my advisor, teacher, and most of all, a friend. Without Anne Hunter and Vera Sayzew I would not have found my place in the EECS department or at MIT. I am also grateful to my friends and many social breaks we entertained together - I
am especially thankful to Rados Radoicic, Ivana Kalea, and Vedran Peric for their support and friendship during the writing of this thesis.
I would like to express my gratitude to my host family in Virginia - without their help I would not be at MIT today.
I am indebted to Noshirwan Petigara for his encouragement, support, and advice
throughout my years at MIT.
Most of all, I would like to thank my parents. Their love, support, and acceptance gave me the ambition and strength to succeed. I am indebted to my sister Lejla for growing with me both professionally and personally, so that I have company every step of the way.
Chapter 1
1.1 Introduction
A multitude of speech recognition models have been developed over the past two decades. Many of these models use general pattern matching techniques, with little or no speech specific knowledge. In the pattern-matching approach, a model contains a training set and an operating set of words. The training set contains a selection of words from the lexicon and is adapted over time to more closely resemble the speaker's pronunciation. The operating set includes a set of words spoken by the speaker that need to be identified. During the word identification process, each word from the operating set is compared against the training, pre-recorded set, and the match with the highest accuracy (based on a number of different techniques that are specific to each model's implementation) is
selected as the identified word. Pattern matching models have proven successful when the conditions under which the training set is recorded match the operating environment exactly, resulting in limited-vocabulary, speaker-dependent, isolated-word recognition systems. The same pattern-matching algorithms, however, show little tolerance for differences between the operating and training environment conditions. For example, any noise present in the operating environment that differs from the noise in the training environment diminishes the accuracy with which a statistical model identifies the words spoken by the speaker. The accuracy levels can sometimes be retrieved with additional re-training and adaptation. In adverse conditions, however, such as noisy environments or telephone conversations, re-training does not necessarily help performance [6]. Statistical
speech perception models also proved more or less inadequate in dealing with speakers
for a different approach in modeling speech perception that will result in systems that are more independent of the environment and speaker. In addition, there has been interest in creating models that would attempt to imitate ways in which humans process speech. The contributions of such a model then, would not only be limited to the industry and production of more robust speech recognition systems, but would stand as a direct quantitative measure of accuracy for phonetic and linguistic theories.
The goal of the Lexical Access From Features (LAFF) project is to develop a speech perception model that would more closely resemble the process by which human listeners are able to extract word sequences from running speech. As a part of the LAFF project, the goal of this thesis is to quantify the acoustic characteristics of nasal consonants and nasalized vowels in American English and incorporate them in an automated speech recognition system. Nasal consonants were chosen because their production and perception has been studied extensively, yet their detection has been a problem for some recognition systems. Nasalized vowels have been included in this study because the production and perception studies for nasal consonants have indicated their presence as important acoustic information in nasal detection.
Once quantified, the acoustic characteristics of nasality would be included in automatic detection systems designed for use in a speaker-independent, continuous-speech environment.
1.2 Acoustic Studies of Speech
The LAFF project is based on the hypothesis that words are represented in memory as sequences of segments, each consisting of bundles of distinctive binary features. These feature value pairs make up a universal set that is used by people
worldwide - any one language uses a subset of features from this set. The feature pairs are such that a change in the value of one feature could result in the production or perception of an entirely different word. For example, while the vocal tract positioning is almost identical in the word pair bat/pat in English, the distinguishing factor between the two initial consonants, and thus words, is whether the vocal folds are vibrating during the consonant production.
Within the feature system, there are two types of distinctive features - articulator-free and articulator-bound [10]. Articulator-articulator-free features classify segments into broad classes that can be roughly described as vowels and general classes of consonants by referring to the characteristics of the type of constriction formed in the vocal tract [24]. Articulator-bound features specify which primary articulator is used to make the constriction in the vocal tract and possible secondary articulators that may be involved in the final sound output.
1.2.1 Articulator-free features
By describing the type of constriction formed in the vocal tract, articulator-free
features establish one of the broadest classifications between segments - the distinction between vowels and general classes of consonants. Vowels are produced with a relatively open vocal tract and uninterrupted airflow. The acoustic consequence of such a vocal tract configuration is high energy across all formants and continuous movement of the formants throughout the duration of the vowel. The production of a true consonant, in contrast, involves a sequence of movements that produces a narrowing in the vocal tract and that subsequently releases that narrowing, acoustically resulting in two discontinuities in the spectrum - one at the time of closure and another at release.
Because an articulator-free feature is one that has no dedicated articulator to implement it, the narrowing in the vocal tract can be implemented with the lips, tongue blade, or tongue body. Acoustically, we consider articulator-free features as introducing landmarks
- the most salient points in an utterance around which information about the underlying distinctive features can be extracted.
1.2.2 Articulator-bound features
Articulator-bound features specify which articulators are active in the vowel or consonant production, and how these articulators are shaped and positioned. There are seven articulators that determine the set of articulator-bound features; they are (1) the lips, (2) the tongue blade, (3) the tongue body, (4) the soft palate or velum, (5) the pharynx, (6) the glottis, and (7) adjustments of the tension of the vocal folds [24]. Each of these articulators can be maneuvered in one or more ways to determine the binary value of the corresponding feature. Because the ways in which the articulators can be manipulated are directly related to the type of constriction made, acoustically we consider articulator-bound features as being reflected in the signal pattern surrounding the landmarks [1]. The landmark times mark the movement and changes in the primary and secondary articulators and for this reason, these times in the signal are most salient in terms of the acoustic characteristics specific to the particular articulator.
1.2.3 Production of Nasal Sounds
A nasal segment is a true consonant in the sense that it is produced by forming a
complete closure at some point along the length of the oral region of the vocal tract. The fact that there is a full closure within the vocal tract results in a reduced spectrum
amplitude in the mid- and high-frequency regions, and two acoustic discontinuities - one at the time of the constriction formation (closure) and one at the constriction release (release). The constriction in the oral region is made with the lips, the tongue blade, or the tongue body, similar to other true consonants, such as stops. The principal difference between the nasals and other true consonants is that the velum is lowered and velopharyngeal port open immediately preceding the closure, during the closure, and immediately following the release of the nasal consonant. Because there is an alternative path for the airflow through the nose, there is no pressure increase behind the constriction and the vocal folds will continue to vibrate in a normal manner throughout the closure. This region in the spectrum, during which the vocal folds continue to vibrate despite the full closure and during which the airflow is redirected from the mouth to the nose, is called the nasal murmur. Another characteristic of the nasal segment is that the opening of the velopharyngeal port usually starts during the segment preceding the nasal consonant and the closing can extend into the segment following the nasal consonant. If the preceding or subsequent segment is a vowel, we term the acoustic modifications to the spectrum of the vowel, due to the open velpharyngeal port and additional airflow path through the nasal cavity, as the nasalization of the vowel.
The production of every nasal segment is therefore characterized by some combination of these three events: acoustic discontinuity, nasal murmur, and vowel nasalization. For this reason, estimation of the nasal feature in the speech signal is equivalent to testing for the presence of each of the three events.
In terms of the discussed articulator-free and articulator-bound features, the time of the acoustic discontinuities (one at the time of closure and another at the time of the release) is marked with a landmark, as they denote the time when a narrowing is made or released in the vocal tract. Because the velum is lowered during the production of a nasal segment and the airflow is redirected through the nasal cavity, thus causing no build-up of pressure, the landmark belonging to a nasal segment is that of a sonorant consonant [+consonantal], [+sonorant]. Acoustic properties measured around the landmark time will reflect the lowering of the soft palate which will be captured by the value of the [nasal (soft palate)] articulator-bound feature.
1.2.4 Previous Studies of Nasal Sounds
There has been a large amount of research on both the production and perception of nasal consonants and nasalized vowels. The following are summaries of some of the work done on nasal consonants and nasalized vowels.
" Hattori and Fujimura performed a study in the late 1950's on nasal consonants
and nasalized vowels [11]. They reported that the principal features of nasal consonants are a strong resonance located at about 300 Hz, damping of the higher formants, and the presence of an antiformant whose location is dependent on the place of articulation. Despite the difference in the antiformant frequency, however, the overall spectral shape of nasal consonants appeared very similar.
" Using an analog vocal tract synthesizer, House and Stevens found that the major
characteristics of vowel nasalization were a weakened and broader first formant,
and overall lower amplitude vowel level compared to non-nasalized vowels [12]. The weaker overall vowel level was a direct consequence of a weaker and broader first formant.
Hypothesizing that the points of maximal spectral change on either side of the syllabic peak are potential nasal transitions, Mermelstein used four simply extractible acoustic parameters to automatically detect nasals in segmented speech
[16]. The four parameters were the relative energy change in the frequency bands 0-1, 1-2, and 2-5 kHz, and the frequency centroid of the 0-500 Hz band. Using
multivariate statistics on some 524 transition segments from data of two speakers, Mermelstein achieved 91% correct nasal/non-nasal decision rate. He also noted that the accuracy in a dependent training system was superior to
speaker-independent training.
* In his Master's thesis, Glass reported that the most robust acoustic property of a nasal consonant is a steady, low frequency resonance, which dominates the spectrum [8]. This resonance is characterized by a temporal and spectral stability.
By calculating the amount of low frequency energy (below 350 Hz) relative to the
energy of the adjacent band (350-1000 Hz), Glass found an effective way of separating nasal consonants from most semivowels. In the same study, Glass stated that the most robust acoustic property of a nasalized vowel was the presence of an extra resonance in the first formant region; depending on the type of the vowel, this resonance might appear above or below the first formant.
" Chen proposed using the parameters A1-P1* for non-low and Ai-Po* difference for other vowel types (in decibels) to capture the spectrum modifications of nasalized vowels [2], [3]. A1 is the parameter denoting the peak spectrum
amplitude of the first formant prominence, Pi is the spectrum amplitude of a peak near 1 kHz, and Po is a spectrum prominence due to a nasal resonance in the range 150-400 Hz. The adjusted acoustic measure of nasalization, A1-Pi* and A1-Po*,
were independent of the vowel type.
* In her proposition for a nasal detection module algorithm, Chen combined the parameters for vowel nasalization with a set of parameters that indicate the presence of a nasal murmur [1], [4], [5]. The parameters for the nasal murmur include the location of the lowest resonance, steady-state spectral shape of the nasal murmur as determined by the RMS difference between consecutive frames, and the spectral tilt typical of nasal murmurs as measured by the difference in energies across five frequency bands. The vowel nasalization parameters are those described in [3]. Chen reports that more than 80% of the nasals can be detected correctly with this algorithm.
All of these studies have contributed greatly to the understanding of nasal
consonant recognition and perception, but often their results have not been included in speaker-independent, continuous speech recognition systems. Reasons for this include the
lack of a sufficient quantitative form for the data or the fact that many of the collected measurements involved human interpretation and in some cases correction [8].
Using the data from previous studies and building an automated nasal detection module within the LAFF system would provide further insights in the acoustic characteristics of nasal consonants. An automated parameter extraction and decision system would allow for a greater body of naturally spoken data to be examined and quantified. The results of such a system would be directly applicable to the speech recognition systems and would give further insights to phoneticians interested in conducting studies in human speech production and perception.
1.3 Summary
While there is clear evidence that the speech signal is rich in acoustic information regarding its content, there has been little application of speech-specific knowledge to existing speech recognition systems. Consequently, today's systems are mostly speaker-dependent or designed to operate on a very limited vocabulary, which greatly hinders their applicability.
A survey of past work indicates that while acoustic characteristics of speech
segments are well studied, they are not always directly applicable to automated speech recognition systems. Their inapplicability is often due to the lack of a sufficiently quantitative form for the presented parameters or because the conducted measurements often require human interpretation and correction.
The primary motivation for this thesis is to examine a number of characteristics and parameters of nasal consonants in American English, and to attempt to incorporate
them in an automatic nasal consonant detection module within the LAFF system. This detection system would operate in a speaker-independent, continuous-speech environment.
The research in this thesis is organized in three stages. The first stage includes automated extraction of parameter values based on previous studies on nasal consonants. As the first step in the automated extraction, Chapter 2 describes the landmark estimation process and performance on a database of utterances. Chapter 3 begins the second stage of processing by introducing the notion of acoustic criteria when processing landmarks for further acoustic characteristics. The following three chapters, Chapters 4, 5, and 6, propose a set of acoustic cues that can separate nasal from non-nasal landmarks, and quantify them in terms of acoustic criteria. In the last stage of nasal module design, Chapter 7 describes the resulting detection system and its performance on the described database. We conclude the thesis with the performance results and future work that would allow this module to operate in a continuous speech environment.
Chapter 2
2.1 Landmark Estimation
In Chapter 1 we discussed the characteristics of a feature-based speech recognition system, and its potential contributions to the industry and future speech studies. We concluded that a feature-based nasal detection module, as illustrated in Figure 2.1, requires three stages of acoustic processing:
1. Estimate the landmark times and types,
2. Use statistically significant acoustic measurements to analyze the signal around the landmark points,
3. Use the values obtained through acoustic measurements to determine whether the
secondary articulator involved in the production of the segment is soft palate.
Chapter 2 continues to formulate a feature-based nasal detection module by describing the landmark estimation process on a three-speaker vowel-consonant-vowel (VCV) database of utterances. As the first step in the nasal detection, the landmark estimation output governs the design of the next stage of acoustic processing by specifying which points in the signal should be tested for nasality. Chapter 3 next introduces the concept of acoustic criteria that can be applied to these points to classify them as nasal and non-nasal. In Chapters 4, 5 and 6 we formulate a set of acoustic criteria that can perform this classification as automated algorithms in MATLAB'. Defining acoustic criteria for nasality concludes the second processing stage in the nasal detection.
Lastly, Chapter 7 proposes rules by which these criteria are combined in a nasal detection module, and evaluates their effectiveness on the VCV database.
Utterances in the database
Landmark Estimation Landmark estimation stage
The utterances are examined for landmark types and times, and passed to the articulator-specific
Landmark times and processing.
types
Acoustic processing for nasality
Measurement of s parameters specifi Points around the I for acoustic characi articulator. For nas
Property2 value secondary articulat
Property2_value Propert I _value
tatistically significant
ic to the articulator
indmark are examined eristics specific to each al detection, the
or is the soft palate.
Evaluation of Property values Determining the articulator-bound features to determine the [nasal] feature based on the observed acoustic properties
Acoustic properties measured in the previous stage are combined to determine values of the feature bundle for the given segment. For nasal segments we are interested in the value of the distinctive feature [nasal].
Nasal landmarks Non-nasal landmarks
Figure 2.1 - An illustration of the processing required for the nasal detection in a feature-based system. The landmark estimation provides the locus for all articulator-bound feature processing. Once landmarks are estimated, further signal processing is focused on and around the landmarks when determining the primary and secondary articulators. For articulator-bound feature [nasal], the processing examines the acoustic evidence for nasal murmur and/or vowel nasalization by measuring 10 parameters and comparing them against a quantified expectation. Further discussion on the acoustic criteria can be found in Chapters 3 through 6.
Chapter 2 is organized in three sections. The first section describes the VCV database of utterances used in this study. The next section outlines the landmark estimation algorithm and analyzes its performance on the described database. The last section discusses implications of the landmark estimation performance for the design of the nasal detection module.
2.2 Database Description
This study focuses on using a restricted VCV database to study the acoustic characteristics of nasal segments. A restricted database is more likely to have a full set of acoustic cues for nasality as opposed to an impoverished set that might occur in other contexts or in casual speech. Some studies also suggest that stressed syllables are probably articulated with greater care and effort than casual speech, resulting in a more robust acoustic signal and more reliable acoustic features [ 19].
The analysis database is made with three native speakers of American English (two male and one female) who were between the age of forty and seventy when the recordings were made. The format of each utterance is a vowel at the initial and final position, and a true consonant in the center of the utterance. There are 6 vowels and 26 consonants in the database. Consonants belong to the classes of sonorant (nasal, glide, and liquid) and obstruent (stop, fricative, and affricate) consonants. The database totals
453 utterances, which were passed through an anti-aliasing filter with a cut-off frequency of 7.5 kHz before being digitized at 16 kHz. The 7.5 kHz cut-off frequency allows relevant high-frequency frication noise in female speech to be captured.
The next section outlines the Consonant Landmark Detector (CLD) developed by Liu at MIT's Speech Communication Group, which is used for landmark estimation in this database, and its performance results [13], [14].
2.3 Consonant Landmark Detector
The basis of the LAFF project is the separation of acoustic processing of the speech signal into that of establishing landmark times and types, and using these times as starting points when extracting further acoustic characteristics. The Consonant Landmark Detector (CLD) developed by Liu at MIT is an automated system that provides the landmark processing required for the evaluation of all articulator-bound and some articulator-free features [13]. The CLD module analyzes the digitized speech utterance to produce three types of landmarks as defined by Liu:
1. glottis (g) - time when the vocal folds transition from freely vibrating to not freely vibrating and vice versa,
2. sonorant (s) - time when a sonorant consonant closure is formed or released,
3. burst (b) - stop or affricate bursts and points where aspiration or frication ends due to a stop closure.
The three landmark types determine what further acoustic processing is appropriate for a given landmark. Factors that cause glottal vibration to cease, for example, are buildup of intraoral pressure due to a supraglottal constriction, vocal-fold spreading, or reduction of subglottal pressure. During the nasal segment production, however, the lowering of the soft palate opens an alternative path for the airflow and
there is no change in the intraoral pressure or vocal fold vibration. Because each nasal segment in this database is both preceded and followed by a vowel, utterances with nasal segments will have vocal folds vibrating continually throughout the nasal production. For these reasons, [g] landmarks in a VCV database do not appear to mark an acoustic change in the signal that could result from the soft palate movement. Similarly, the signal around
[b] landmarks is expected to show a silence interval followed by an abrupt increase in
energy at high frequencies. This property of [b] landmarks suggests that nasal detection should not focus around these landmark points. Unlike the previous two landmark types, however, a sonorant landmark is an acoustic manifestation of a sonorant closure or release in Liu's detection scheme. Consequently, a portion of the signal around this type of landmark is a prime candidate for examining the signal for soft palate activation and nasal production. Figure 2.2, adopted from Liu, illustrates the landmark tree implemented
by the CLD. The diagram also shows the dependence between the articulator-bound
feature processing and landmark type.
The subsequent sections in this chapter focus mainly on the calculation and performance of sonorant landmarks because of their relevance to the nasal detection. The
CLD used in landmark estimation and described below is unchanged from Liu's doctoral
[+consonantal] [-consonantal]
vowel, semivowel, [h], glottal stop
[+sonorant] [-sonorant] nasal, acoustically abrupt [1] [+continuant] [-continuant] fricative stop affricate
Figure 2.2 - The landmark tree adopted from Liu. From this diagram, it is evident that the articulator-bound feature processing is highly dependent on the information from the CLD in selecting the appropriate acoustic analysis. For nasal detection the landmarks of interest are [+consonantal], [+sonorant].
2.3.1 Overview of the sonorant landmark calculation
Calculation of sonorant landmarks can be separated in general processing common to all landmark types and specific tests for sonorant cues. General processing includes computation of the broadband spectrogram using the short-time processing techniques, with a 6 ms Hanning window taken every 1 ms and a 512-point DFT. The resulting spectrogram is divided into the following six frequency bands before being passed through fine and coarse processing:
Band 1: 0.0 - 0.4 kHz Band 2: 0.8 - 1.5 kHz Band 3: 1.2 - 2.0 kHz Band 4: 2.0 - 3.5 kHz Band 5: 3.5 - 5.0 kHz Band 6: 5.0 - 8.0 kHz.
Frequency bands are chosen such that Band 1 monitors the presence or absence of glottal vibration. Bands 2-5 are used to detect spectral changes of sonorant consonants and
onsets/offsets of aspiration or frication noise associated with stops, fricatives, or affricates. Band 6 spans the remaining frequency range and is used in combination with other bands to detect silence intervals in stop consonants. Following the spectrogram calculation, energy changes in the six bands are found using a two-pass strategy. Both passes employ the same processing steps except that the first pass uses coarse parameter values to find the general vicinity of a spectral change and the second pass uses fine parameter values to localize it in time [13]. Once the band energy is computed, a 6-band rate-of-rise (ROR) is found by taking an overlapping dB first difference of the energy in each band. Using a peak-picking algorithm originally described by Mermelstein
[16], Liu finds ROR ±peaks whose absolute value is greater than 9dB for coarse
processing, and 6dB and 9dB for fine processing. For details of the algorithm, the reader should refer to Liu's doctoral thesis. Detection of energy peaks as a function of time concludes the general processing stage common to all landmark types.
To find sonorant [s] landmarks, the CLD only considers voiced regions of the utterance. Because [g] landmarks are indicators of the time when glottal vibration turns on or off as determined by the energy change in Band 1, sonorant landmarks can only exist in the regions of the signal bounded by a +g landmark on the left and -g landmark on the right2. Within the voiced region, peaks in Bands 2-5 are grouped based on the sign and temporal proximity; that is all peaks or dips that happen somewhat coincidentally make up a group that is passed to the next processing stage. There are usually a number of such groups within each utterance. In each group, the largest peak or dip is termed a
pivot and considered a likely candidate for a sonorant landmark. The information
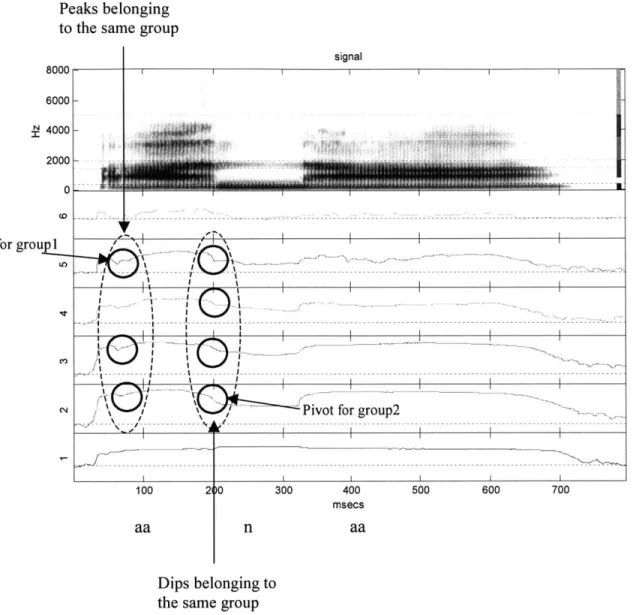
regarding the remaining peaks in the group is used when determining whether the pivot passes the landmark requirements. For ease of understanding, Figure 2.3 presents the visual output of the CLD for utterance [ana]. The broadband spectrogram tops the figure, followed by the plots of energy in each frequency band as a function of time. The band number is located to the left of each plot. The added notation in Figure 2.3 highlights two groups of energy fluctuations that are considered to occur somewhat coincidentally: the first group has 3 energy peaks and the second 4 dips in Bands 2-5. The largest peak in each group across the 4 frequency bands is a pivot, also noted on the diagram.
To become a sonorant landmark, each pivot needs to pass three criteria of sonorant regions labeled steady-state, abruptness, and staggered peaks criteria. Table 2.1 summarizes the theoretical basis and expectation for each test.
Name of test Theoretical basis
After the primary articulator has made a complete closure, the vocal folds continue to Steady-state vibrate and the vocal tract shape is relatively constant, resulting in a relatively
unchanged low frequency content during the constricted interval.
Abruptness test Acoustic manifestation of a sonorant release or closure is a rapid change in the F2 to F4 range - decrease in the energy for sonorant closure and increase for a release. Another measure of high-frequency abruptness for sonorant consonant states that Staggered-peak peaks in each group must occur somewhat coincidentally with each other and their
pivot.
Table 2.1 - Overview of the criteria used in the sonorant landmark estimation. Summary of the requirements that each pivot has to pass before it is promoted to a sonorant landmark. The table illustrates the theoretical basis for each of the tests in the CLD.
Pivots that pass all three criteria become sonorant landmarks. The three criteria also determine whether the landmark is located at the time of a sonorant closure or release, while the sonorant landmark time is the same as the time of the pivot. Pivots that pass the abruptness and staggered-peak criteria, but not the steady-state, are classified as the specially introduced fourth landmark type - vocalic [v] landmark.
Peaks belonging to the same group
signal 8000 6000-N 4000 200
0-Pivot for groupi 'x
~Pivot for group2
.. ...' .. .
_I I t
Pivot for group2
)0 300 400 msecs n 500 600 700 aa Dips belonging to the same group
Figure 2.3 - The visual output of the CLD gives the broadband spectrogram of the utterance and the energy in each frequency band plotted as a function of time. The frequency band number is noted on the left of each plot
-information regarding the band ranges can be found in the text. After the energy of each frequency band is analyzed in terms of somewhat rapid energy changes, the peaks and dips are grouped based on their temporal proximity and sign. The largest peak/dip in each group is named a pivot and considered a likely candidate for a sonorant landmark.
The origin of all [v] landmarks in utterances processed by the CLD is thus a pivot that passed two of three requirements for a sonorant landmark. The remaining pivots that do not meet the sonorant or vocalic landmark criteria are discarded. Figure 2.4
100 21
characteristics. Once all pivots have been examined, the landmark types and times are saved to be written to a text file. This point concludes the sonorant detection within the
CLD. pivot INF test iAbruptness NOPivot discarded YES
Staggered- Pivot discarded
eak tes
YES
teady-state Vocalic [v] landmark
tYES
Sonorant [s] landmark
Figure 2.4 - Illustration of the decision process used to determine whether a pivot is promoted to a sonorant landmark. Table 2.1 summarizes the theoretical basis for each test.
2.3.2 Sonorant landmark performance on the VCV database
Liu chooses a sonorant landmark to mark the time in the utterance when a sonorant closure or release is made [13]. The sonorant class of consonants in Liu's
detection scheme includes only nasals and acoustically abrupt [1] segments; glides and liquids are classified as semivowels and described as [-consonantal]. Assuming that [m], [n], [rj], and [1] are all acoustically abrupt in a VCV database, each of the above segments should have two landmarks: [-s] to designate the time of the sonorant closure and [+s] of sonorant release. Although sonorant landmarks in a VCV database are expected to appear in pairs, the CLD does not enforce this property. A sonorant closure or release can and often does exist without a corresponding sonorant pair in a VCV database due to CLD performance errors or in instances when closures and releases are not acoustically abrupt. For this reason, we adopt the sonorant landmark (closure or release) as the basic unit when evaluating the accuracy of the sonorant landmark detection in this database.
The described VCV database of 3 speakers and 6 vowels has 72 sonorant segments (definition for a sonorant consonant is adopted from Liu and includes nasals and acoustically abrupt [1] segments). With the utterance [irji] missing in the database for one speaker due to a corrupted file, this number is adjusted to 71 acoustically abrupt sonorants - 53 nasals and 18 acoustically abrupt [1] segments - each with an expected landmark at the sonorant closure, [-s], and release, [+s]. We thus expect 71 sonorant closures and releases for a total of 142 sonorant landmarks. Table 2.2 contrasts the actual against the expected performance.
Further analysis into the output of the CLD reveals two types of error:
1. Some sonorant closures and releases are undetected by the CLD - we will refer to these as deletions in the rest of the study,
2. Some sonorant landmarks are placed at non-sonorant segments, which we
-s +s Total Nasal 31 39 70 Actual Abrupt [1] 3 11 14 number Other 121 46 167 Nasal 53 53 106 Expected Abrupt [1] 18 18 36 Other 0 0 0
Table 2.2 - An overview of the CLD performance results for the described VCV database. This table indicates that some of the sonorant closures and releases were undetected by the CLD, while some sonorant landmarks were erroneously placed within non-sonorant segments.
In order to fully analyze each of the error types and rates, we require a means to further classify estimated sonorant landmarks based on the location within the utterance where they occurred. Hand-classifying each sonorant landmark as
1. true positive - placed at a closure or release for a nasal or [1],
2. or false positive - placed within a vowel, semivowel, at a vowel-semivowel/semivowel-vowel (VS/SV) boundary, or vowel-obstruent/obstruent-vowel (VO/OV) boundary,
produces the desired detection rates. The sub-classification of true and false positives also gives insight in the structure of detections and insertions. Table 2.3 shows the number of true and false positive sonorant landmarks distributed across the six groups. The list of utterances, landmark times and types, and their classification into one of the six groups can be found in Appendix A. If we define the detection rate to be
DetectionRate = Detectionsx100%, (2.1)
Expected _ Sonorant _ Landmarks
the detection rate of the sonorant landmarks for this VCV database is 59.2%.
Total Is] Expected Is]
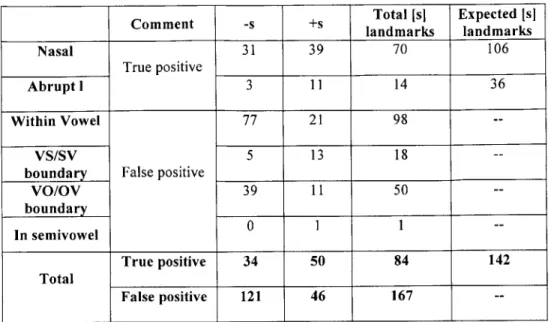
Comment -s +s landmarks landmarks
Nasal 31 39 70 106
True positive
Abrupt 1 3 11 14 36
Within Vowel 77 21 98
--VS/SV 5 13 18
-boundary False positive
VO/OV 39 11 50 -boundary In semivowel 0 1 1 True positive 34 50 84 142 Total False positive 121 46 167
--Table 2.3 - This table gives insight into the structure of the false positives and detection rates. Each sonorant landmark produced by the CLD can be hand-classified as a true or false positive. True positives (detections) are landmarks at closures and releases for nasals and [I]s. While each sonorant segment in this database is expected to have exactly two sonorant landmarks - one for the closure and one for the release
-the actual results show that sonorant landmarks had anywhere between zero and two landmarks. False positives can be exhaustively classified in four categories, depending on whether they were inserted in a vowel or semivowel segment, at a vowel-semivowel/semivowel-vowel boundary, or vowel-obstruent/obstruent-vowel boundary.
Qualitatively such a low detection rate means that for each detected sonorant landmark, almost one other is missed. Detection rate is higher for nasals than for acoustically abrupt
[1] segments, which is in agreement with Liu's observation for the original CLD
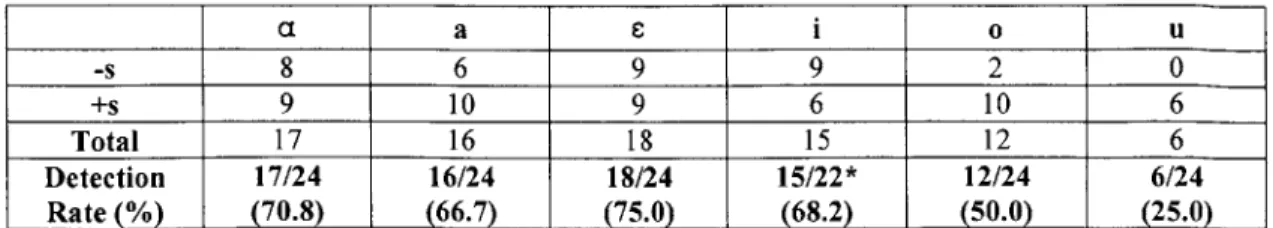
databases [13]. Furthermore, based on a limited number of tokens, it appears that sonorant closures are better detected when they are adjacent to certain vowel types. To illustrate this, Table 2.4 shows the number of detected sonorant landmarks based on the adjacent vowel. Although more speakers/tokens are needed in order to make a conclusive claim, it appears that the sonorant landmark detector does not perform well if the sonorant closures are adjacent to a nonlow back vowel.
a a C i o U -s 8 6 9 9 2 0 +s 9 10 9 6 10 6 Total 17 16 18 15 12 6 Detection 17/24 16/24 18/24 15/22* 12/24 6/24 Rate (%) (70.8) (66.7) (75.0) (68.2) (50.0) (25.0)
*The number of expected sonorant landmarks for vowel [i] is different because of the missing utterance
[iji] for one speaker.
Table 2.4 - Distribution of detected sonorant landmarks based on the adjacent vowel. For example, a detected [-s] landmark at a sonorant closure before the vowel [a] would contribute one token to the [-s] entry under the vowel [a] in the table. This sub-classification illustrates the disparity between the detection rates of sonorant landmarks adjacent to non-low, back vowels compared to the rest.
A plausible explanation for the poor performance is that the low frequencies of the first and second formants, which are characteristic of nonlow, back vowels, cause them to have relatively weak energy at higher formants. The low energy at frequencies above the second formant in the vowel segment in turn produces a rather smooth transition from the vowel to the sonorant closure that does not satisfy the required energy abruptness criterion. Failure to meet this criterion precludes the pivot from further landmark consideration. In support of this hypothesis is the trend of the detection rate
-the lowest detection rate is for -the vowel [u], which has -the lowest frequencies for F1 and F2. If this hypothesis is true, the sonorant landmark detector in the CLD could use the information regarding the adjacent vowel type to calibrate its criteria. This calibration could be implemented as a second pass in the landmark estimation: once the vowel types and times are determined, the sonorant landmark estimation within the CLD could lower the energy threshold requirement for pivots adjacent to the nonlow, back vowels and reexamine them.
Examination of insertions, and in particular the disproportionate number of
sonorant landmarks inserted in vowel segments, reveals that about 50% of vowel
insertions are either at the beginning of the utterance, for the onset of voicing, or at the end of the utterance as the voicing ceases and the speaker's voice becomes aspirated. For continuous and spontaneous speech with longer utterances, we expect the vowel insertions as a percentage of total insertions to decrease significantly. Insertions at obstruent segments, in semivowels, and those placed near the center of a vowel do not appear to be specific to the VCV database used in this study.
2.4 Designing the system in terms of the [s] landmark performance
The analysis so far described the detection rate and error types of the sonorant landmark detection and CLD in isolation from the nasal detection module. This section characterizes the implications they have on the design of the nasal detection module. Design concerns are organized in two sections based on the error type.
2.4.1 Design considerations of the nasal detection module due to deletions
Because a feature-based speech recognition system relies on estimated landmarks
for further articulator-bound feature processing, low sonorant landmark detection rate of the CLD presents a substantial problem for the nasal detection. With a deleted landmark, feature-based nasal detection has no information that an acoustically abrupt change occurred and will not examine the signal for further acoustic characteristics. A methodical approach to this problem suggests two possible solutions:
1. Modifications to the CLD algorithms are able to raise the detection rate to a sufficiently high level such that the nasal detection module need not address the case of deleted landmarks. One such enhancement, as we have already
speculated, could include lowering the energy abruptness threshold or restricting the threshold to certain bands for a pivot based on the type of the
adjacent vowel.
2. The design of the nasal detection module accounts for deletions by evaluating possible nasal contexts in the signal other than the landmark points. The additional processing may include testing [v] in addition to [s] landmarks because of their origin as sonorant landmark candidates that failed the steady-state criterion.
In this study we choose to address the problem of low sonorant detection rate from within the nasal module. The reasoning behind this approach is that several articulator-bound modules within the LAFF project are either already developed or in progress based on the existing CLD developed by Liu. Customizing the CLD for sonorant landmarks would thus require that the nasal detection module include its own version of the CLD when added to the LAFF system. Following in the same fashion, if more articulator-bound feature modules were to include their own customized CLD, the separation between the articulator-free and articulator-bound feature processing that is the basis of the LAFF project would no longer exist. Sonorant landmark estimation in addition depends on [g] landmarks to establish voiced and unvoiced regions in the utterance. Modifications could thus require changes in the processing of both [g] and [s] landmarks to enhance its performance.
Working with the existing CLD algorithm, we change the focus of our analysis from sonorant landmarks to pivots and examine whether pivots can be used to compensate for the low detection rate of sonorant landmarks. As described earlier, pivots
have to pass a set of three criteria to become sonorant landmarks. Based on which criteria they satisfy, pivots are either promoted to sonorant [s] or vocalic [v] landmarks, or discarded. This decision process raises the following questions as suggested by Chen [1]: How many deletions originate as a pivot that was erroneously promoted to a vocalic landmark or discarded based on the three criteria, and how can we use this information to compensate for the low sonorant detection rate?
The first step in answering these questions is to hand-label each sonorant closure and release in the database, and compare these times against the pivots produced by the
CLD. Table 2.5 outlines the number of sonorant closures and releases that were examined by the CLD as pivots and their final classification.
Missing
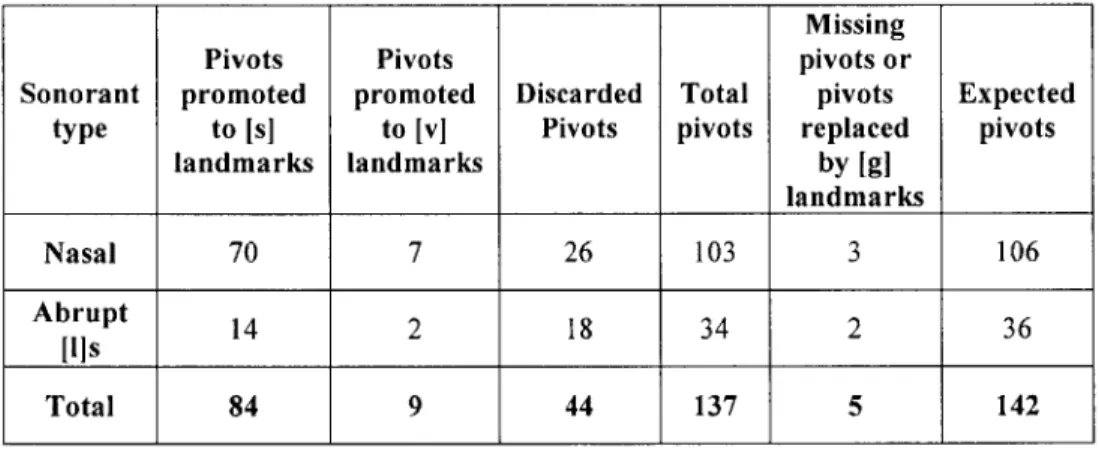
Pivots Pivots pivots or
Sonorant promoted promoted Discarded Total pivots Expected type to [s] to [vI Pivots pivots replaced pivots
landmarks landmarks by [g] landmarks Nasal 70 7 26 103 3 106 Abrupt 14 2 18 34 2 36 ills Total 84 9 44 137 5 142
Table 2.5 - The pivot analysis suggests that pivot detection rate for sonorant closures or releases is significantly higher than that of sonorant landmarks. If pivots are used as possible nasal context in an utterance instead of sonorant landmarks alone, 137 of existing 142 sonorant closures and releases would be examined for possible nasal characteristics.
Table 2.5 shows that 97.2% of nasal closures and releases, and 94.4% of abrupt [l]s, are examined as pivots during the CLD processing. For nasals, approximately 7% of examined pivots are falsely promoted to vocalic [v] landmarks and 25.2% are discarded. Even larger percentage of pivots is erroneously rejected for abrupt [l]s; about 6% of
abrupt []s are classified as [v] landmarks, while about 53% of pivots are falsely discarded. For the remaining <4% of nasals and laterals that did not have a pivot, the majority were a consequence of a CLD processing rule which requires that no pivots exist in the proximity of [g] landmarks. In these utterances the placement of a [g] landmark close to the sonorant closure or release caused that portion of the signal not to be included in the pivot analysis, ultimately resulting in a deleted sonorant landmark. In one instance a missing pivot was caused by an acoustically non-abrupt transition between the vowel [u] and a nasal. Pivot analysis data can be found in Appendix B.
Selecting a pivot instead of a sonorant landmark as a possible nasal context in the nasal detection module guarantees that >96% of all sonorant closures and releases will be examined for nasality. The drawback to this approach is that in the VCV database of 453
utterances and 71 sonorant segments, the CLD examines 1,483 pivots, thus significantly increasing the amount of processing needed for the nasal detection. In order to avoid this increase in the computational requirement, we require that the acoustic criteria for nasalization be ranked based on their effectiveness in separating nasal from non-nasal pivots. By employing the most effective criteria first, we minimize the required computational power by rejecting most non-nasal pivots early without calculating parameters used for the remaining criteria. More on the implementation of the ranked processing scheme can be found in Chapter 7.
2.4.2 Design considerations of the nasal detection module due to insertions
Figure 2.2, adopted from Liu, suggests that following the landmark estimation sonorant landmarks need only be separated into those belonging to nasals and
acoustically abrupt [I]s. The high insertion rate of sonorant landmarks within non-sonorant segments requires that nasal detection also accounts for and rejects false positives. Including the classification of the false positives from previous sections, Figure
2.5 alters the original landmark tree implemented by Liu to account for the observed
performance characteristics of the sonorant landmark detection.
[+sonorant]
[+consonantal] [-consonantal]
vowel, semivowel, [h], glottal stop
[-sonorant]
asals Abrupt [1] False positives
Landmarks at vowel- Landmarks in vowel Landmarks at
vowel-semivowel/semivowel-
obstruent/obstruent-vowel (VS/SV) boundary vowel (VO/OV) boundary
Figure 2.5 - The landmark tree proposed by Liu is modified to account for the sonorant landmark insertions seen in the CLD performance. Insertions of sonorant landmarks within non-sonorant segments require that nasals are detected from acoustically abrupt [l]s and false positives, which include sonorant landmarks placed in vowel, semivowel, and obstruent segments. The variety of non-nasal groups suggests that a larger number of parameters need to be used to successfully separate nasal from non-nasal sonorant landmarks.
The inserted landmarks effectively expand the number of classes under the sonorant landmark group to nasals, abrupt [I]s, vowels, semivowels, and obstruents. With such a wide variety of segments and boundaries, the design of the nasal detection module requires a number of measurements to successfully separate nasals from the remaining
![Figure 4.1 - ED values measured at different distances before and after 31 nasal [-s] landmarks](https://thumb-eu.123doks.com/thumbv2/123doknet/14130004.468976/60.918.236.738.230.541/figure-ed-values-measured-different-distances-nasal-landmarks.webp)
![Figure 4.2 - Illustration of the individual net ED change for 31 nasal [-s] landmarks](https://thumb-eu.123doks.com/thumbv2/123doknet/14130004.468976/61.918.182.700.113.375/figure-illustration-individual-net-ed-change-nasal-landmarks.webp)
![Figure 4.3 - ED value measured at different distances before and after a nasal [-s] landmark for 39 nasal [- [-s] landmarks](https://thumb-eu.123doks.com/thumbv2/123doknet/14130004.468976/62.918.181.687.109.422/figure-value-measured-different-distances-nasal-landmark-landmarks.webp)
![Figure 4.4 - Illustration of the individual net change in the ED value across 39 nasal [+s] landmarks, separated to [m], [n], and [U] boundaries.](https://thumb-eu.123doks.com/thumbv2/123doknet/14130004.468976/63.918.179.703.114.405/figure-illustration-individual-change-value-landmarks-separated-boundaries.webp)
![Figure 4.5 - Net change in the ED value for 154 nasal and non-nasal [-s] landmarks](https://thumb-eu.123doks.com/thumbv2/123doknet/14130004.468976/65.918.210.588.117.539/figure-net-change-ed-value-nasal-nasal-landmarks.webp)
