HAL Id: hal-02374024
https://hal.archives-ouvertes.fr/hal-02374024
Submitted on 1 Apr 2021HAL is a multi-disciplinary open access L’archive ouverte pluridisciplinaire HAL, est
Organic carbon decomposition rates with depth and
contribution of inorganic carbon to CO 2 emissions
under a Mediterranean agroforestry system
R. Cardinael, T. Chevallier, B. Guenet, Cyril Girardin, T. Cozzi, Valérie
Pouteau, Claire Chenu
To cite this version:
R. Cardinael, T. Chevallier, B. Guenet, Cyril Girardin, T. Cozzi, et al.. Organic carbon decompo-sition rates with depth and contribution of inorganic carbon to CO 2 emissions under a Mediter-ranean agroforestry system. European Journal of Soil Science, Wiley, 2020, 71 (5), pp.909-923. �10.1111/ejss.12908�. �hal-02374024�
Organic carbon decomposition rates with depth and contribution of inorganic carbon to CO2 emissions under a Mediterranean agroforestry system
R. CARDINAELa,b,c,d*, T. CHEVALLIERa, B. GUENETe, C. GIRARDINf,T. COZZIb, V.
POUTEAUf, C. CHENUb
aEco&Sols, IRD, CIRAD, INRA, Montpellier SupAgro, Univ Montpellier, Montpellier,
France
bAgroParisTech, UMR Ecosys, Avenue Lucien Brétignières, 78850 Thiverval-Grignon,
France
cCIRAD, UPR AIDA, F-34398 Montpellier, France (present address)
dAIDA, Univ Montpellier, CIRAD, Montpellier, France
eLaboratoire des Sciences du Climat et de l’Environnement, LSCE/IPSL, CEA-CNRS-
UVSQ, Université Paris-Saclay, Gif-sur-Yvette, France
fINRA, UMR Ecosys, Avenue Lucien Brétignières, 78850 Thiverval-Grignon, France
Summary
Agroforestry systems have been much studied for their potential to store soil organic carbon
(SOC). However, few data are available on their specific impact on potential SOC
mineralization, especially at depth in subsoils. Moreover, many soils of the world, especially in
arid and semi-arid environments, also contain large stocks of soil inorganic carbon (SIC) as
carbonates. Consequently, the organic carbon dynamics has been poorly investigated in these
soils due to the complexity of measurements and of the processes involved. To assess
mineralization rates of SOC with depth, we incubated soil samples coming from an
18-year-old agroforestry system (both tree row and alley) and an adjacent agricultural plot established
on a calcareous soil in France. Soil samples were taken at four different depths: 0-10, 10-30,
70-100 and 160-180 cm. Total CO2 emissions, the isotopic composition (δ13C, ‰) of the CO2
and microbial biomass were measured. The SIC concentrations ranged from 48 to 63 g C kg-1
soil and the SOC concentrations ranged from 4 to 17 g C kg-1 soil. The contribution of
SIC-derived CO2 represented about 20% in the topsoil and 60% in the subsoil of the total soil CO2
emissions. The microbial biomass and the SOC-derived CO2 emissions were larger in the
topsoil, but the decomposition rates (day-1) remained stable with depth, suggesting that only the
size of the labile carbon pool was modified with depth. Subsoil organic carbon seems to be as
prone to decomposition as surface organic carbon. No difference in CO2 emissions was found
suggest that the measurement of soil respiration in calcareous soils could be overestimated if
the isotopic signature of the CO2 is not taken into account. It also advocates more in-depth
studies on carbonate dissolution-precipitation processes and their impact on CO2 emissions.
Keywords: Mediterranean, carbonates, soil respiration, 13C natural abundance, microbial
biomass, metabolic quotient, deep soil
Highlights
1) We measured SOC mineralisation and inorganic carbon contribution to CO2 emissions
in agroforestry
2) Subsoil organic carbon was as prone to decomposition as surface organic carbon
3) Inorganic carbon contribution to CO2 emissions ranged from 20% to 60% depending
on soil depth
4) Measurement of soil respiration in calcareous soils could be overestimated
Introduction
Agroforestry systems associate trees and crops or pastures within the same field (Nair, 1993).
These systems usually provide enhanced ecosystem services compared to treeless farming
systems (Torralba et al., 2016), especially in terms of soil organic carbon (SOC) storage
agroforestry systems (Albrecht & Kandji, 2003; Lorenz & Lal, 2014; Kim et al., 2016), but also
more recently in temperate and Mediterranean agroforestry systems (Cardinael et al., 2015a,
2017, 2019; Pardon et al., 2017). Deep rooting of agroforestry trees (Mulia & Dupraz, 2006;
Cardinael et al., 2015b) increase organic carbon inputs and could modify SOC dynamics in
deep soil layers (Cardinael et al., 2018b). However, the measured SOC stocks in deep soil layers
are not always significantly larger in agroforestry systems compared to treeless agricultural
systems (Cardinael et al., 2015a; Upson et al., 2016).
The processes controlling SOC dynamics are still insufficiently understood, especially at depth
(Salomé et al., 2010; Rumpel & Kögel-Knabner, 2011). Nevertheless, most studies have
showed that SOC turnover was slower at depth (Mathieu et al., 2015; Tian et al., 2016;
Balesdent et al., 2018). The proposed explanations are diverse: (i) deep SOC is depleted in
energy-rich plant material (Fontaine et al., 2007); (ii) interactions between organic matter and
minerals become the main factor of C stabilization with depth (Kleber et al., 2015; Mathieu et
al., 2015); (iii) the SOC content decreases with depth with a spatial separation of SOC,
microorganisms and extracellular enzyme activity which impedes microbial SOC
mineralization (Rumpel & Kögel-Knabner, 2011); (iv) lower oxygen supply might limit
decomposition (Keiluweit et al., 2016, 2017); (v) microbial biomass dramatically decreases
with depth (Taylor et al., 2002; Fang & Moncrieff, 2005; Eilers et al., 2012); and (vi) the
microbial populations in topsoil and subsoil have different metabolisms (Spohn et al., 2016).
Even though mineralisation rates of SOC tend to decrease with soil depth, the decomposition
use efficiency may be similar in topsoil and subsoil (Spohn et al., 2016) and deep SOC can
significantly contribute to SOC mineralization potential (Bounouara et al., 2017;
Wordell-Dietrich et al., 2017). More studies are, thus, needed to estimate the processes of SOC
mineralisation potentials in deep soil, especially under agroforestry system management where
tree roots can provide C inputs (root mortality and root exudates) in deep soil horizons (Germon
et al., 2016). Moreover, these estimations of SOC mineralisation potentials are essential for
modelling purposes (Braakhekke et al., 2011, 2013; Guenet et al., 2013; Cardinael et al.,
2018b).
Globally, arid and semiarid regions cover more than 30% of the Earth’s land surface (Lal &
Kimble, 2000; Romanyà & Rovira, 2011). Soils in these regions are usually calcareous and
contain large amounts of inorganic carbon in the form of carbonates (CaCO3), with a total
inorganic carbon pool ranging from 750 to 950 PgC (Eswaran et al., 2000). Estimations of SOC
mineralisation potentials are often based on laboratory soil incubations at optimal soil moisture
and temperature conditions (Collins et al., 2000). The estimation of SOC mineralization rates
in calcareous soils is complex because the presence of large amounts of soil inorganic carbon
(SIC) may challenge the analysis of the carbon (C) fluxes from SOC mineralisation at the
soil-air interface (Tamir et al., 2011, 2012; de Soto et al., 2017). As a consequence, little research
on SOC dynamics has been carried out on these soils, and most studies (in particular C-cycle
models) consider carbonates and SIC as a static C pool in soils, whereas the C flux from the
2009, 2010; Sanchez-Cañete et al., 2011), and are an important part of the global C cycle
dynamics (Lal & Kimble, 2000).
The dynamics of SIC are related to the existence of carbonate dissolution and precipitation
cycles in soil. These cycles are interrelated to biotic activities producing CO2 which can be
precipitated as carbonate (Gocke et al., 2011) and/or producing hydrogen ions or organic acids
during biological pH-active reactions such as nitrification from decomposing organic matter,
which may improve carbonate dissolution and stimulate CO2 emissions from soils (Tamir et
al., 2013; Chevallier et al., 2016; de Soto et al., 2017). The three main factors controlling
dissolution and precipitation of carbonates as listed by Gocke et al., (2011) are: (1) CO2 partial
pressure in pore space, (2) pH of soil solution, and (3) mass flow of dissolved carbon species
(H2CO3, HCO3-). Biological activities impact these three factors and thus may mobilize SIC to
emit CO2 or promote CaCO3 precipitation by modifying the equilibrium between the different
dissolved, gaseous and solid SIC species. In addition, SIC also impacts SOC mineralisation
indirectly by its role on soil aggregate formation and stabilization, and then on SOC protection
from mineralization (Clough & Skjemstad, 2000; Shang & Tiessen, 2003; Fernández-Ugalde
et al., 2011, 2014; Virto et al., 2011). Using the difference in δ13C signatures between SOC and
SIC, empirical research based on natural isotopic 13C tracing has been used to evaluate the
contribution of SIC to the CO2 emitted from soils (Stevenson & Verburg, 2006; Schindlbacher
et al., 2015; Soper et al., 2017). In the published literature, the contribution of SIC to total CO2
emissions ranges from 10% to 40% (Inglima et al., 2009) and up to 70% at high temperatures
In this study, we compared the SOC dynamics in the soil profile of an agroforestry plot
established 18 years ago on a calcareous soil compared to an adjacent agricultural plot on the
same soil. We hypothesized that (1) SOC mineralisation potentials would decrease with
increasing soil depth, in both the agricultural control plot and the agroforestry plot; (2) SOC
mineralisation potentials would differ in the agroforestry plot compared to the agricultural plot
due to different SOC inputs in amount and in quality; and (3) SIC would significantly contribute
to total CO2 emissions and differ between the soil samples depth.
The aims of this study were twofold: (i) assess SOC potential mineralisation as a function of
soil depth in an agroforestry plot compared to an agricultural control plot (ii) estimate the
contribution of SIC to CO2 emissions at different depths.
Materials and methods
Site description
Soils were collected at an experimental site 15 km North of Montpellier, France (Longitude
04°01′ E, Latitude 43°43′ N, elevation 54 m a.s.l.). The climate is sub-humid Mediterranean with an average temperature of 15.4°C and an average annual rainfall of 873 mm (years 1995–
2013). The soil is a silty and carbonated deep alluvial Fluvisol (IUSS Working Group WRB,
2007). Gravels > 2mm represented less than 1% of soil mass in the first 2 meters of soil
(Cardinael et al., 2015a). The site comprises a silvoarable system, associating walnut (Juglans
regia × nigra cv. NG23) trees and durum wheat (Triticum turgidum L. subsp. durum (Desf.)
were planted in 1995, in parallel tree rows (13 × 4 m spacing) and have a current density of 110
trees ha-1. A spontaneous and herbaceous vegetation grows in the tree rows. The soil is plowed
annually to 20 cm depth and the durum wheat is fertilized with 120 kg N ha−1 yr−1.
As explained in Cardinael et al., (2015a), this experimental site was not designed as traditional
agronomical experiments with blocks and replicates, but with two large adjacent plots within a
same field. Soil texture was previously analyzed for 24 profiles down to 2 m soil depth,
following a random sampling design within the two plots. Soil texture was very similar across
the sampling points (Cardinael et al., 2015a). In addition, both plots had the same previous land
use and management before the planting of the trees, and are at the same elevation.
Soil collection, carbon and isotopic analyses
In May 2013, 193 soil cores (pseudo-replicates) were collected down to 2 m depth in the control
plot (n= 93), in the agroforestry alley (n=60) and in the tree row (n=40) using a motor-driven
micro caterpillar driller (8.5-cm diameter) (Cardinael et al., 2015a). Soil cores were then cut
into 10 layers, 0-10, 10-30, 30-50, 50-70, 70-100, 100-120, 120-140, 140-160, 160-180 and
180-200 cm.
A previous study at this site analyzed SOC fractions at four depths, 0-10, 10-30, 70-100 and
160-180 cm (Cardinael et al., 2015a); subsequently we decided to incubate soil from these same
four depths in the present study as results of SOC fractionation could help interpreting the
results of CO2 emissions. The incubation, therefore, comprised four soil replicates per location
(control, tree row, alley) and per depth (0-10, 10-30, 70-100 and 160-180 cm) (n=48). Soil
carbon concentration was analyzed on sub-samples sieved at 2 mm with a CHN elemental
analyzer (Carlo Erba NA 2000, Milan, Italy) after carbonates were removed by acid fumigation
with HCl (37%) vapours for 8 h, following Harris et al., (2001). The isotopic composition
(𝛿𝛿13𝐶𝐶 − 𝑆𝑆𝑆𝑆𝐶𝐶, ‰) of SOC was also determined on these carbonate-free samples using an Isotope Ratio Mass Spectrometer (GC-IRMS; Isochrom Optima, Micromass, North Carolina,
USA) coupled with the CHN elemental analyzer.
The concentration and the isotopic composition of carbonates were also determined on each
sub-sample. For this, soil samples were put in the oven at 550°C for 6 h to oxidize the organic
matter (Dean, 1974). The organic matter free samples (10 mg) reacted with orthophosphoric
acid (H3PO4, 105%) during 16 h at 25°C (Coplen et al., 1983) in a reaction vessel that had
previously been purified of any gases with a vacuum pump and liquid nitrogen, and the CO2
emitted by this reaction was analyzed to determine SIC content and its isotopic composition
(𝛿𝛿13𝐶𝐶 − 𝑆𝑆𝑆𝑆𝐶𝐶, ‰). After the reaction, the CO2 was expanded into an evacuation system, and
then condensed into an U-trap with liquid nitrogen cooling (McCrea, 1950; Jones & Kaiteris,
1983; Mucciarone & Williams, 1990). The system was pumped to remove any residue of
non-condensable gas. The amount of CO2 emitted by the reaction with H3PO4 was measured with a
manometer, and then transferred to a sample tube to measure its 𝛿𝛿13𝐶𝐶 − 𝑆𝑆𝑆𝑆𝐶𝐶 by IRMS as above.
Laboratory incubations and soil respiration
Forty grams of 5 mm sieved soil was placed in 500-mL glass jars with Teflon® rubber stoppers
2.5. Immediately after adding the water, the glass jars were flushed with CO2 free air (19% O2,
81% N2). Soils were then incubated at 20°C in the dark. The CO2 concentration and the δ13C of
the CO2 were measured after 1, 3, 7, 14, 21, 28, 35 and 44 days. The CO2 concentration was
determined with a micro GC (Agilent 3000A, Santa Clara, USA). The isotopic composition
(δ13C, ‰) of the CO
2–C was determined using a GC (Hewlett-Packard 5890, San José, USA)
coupled to an IRMS as above. Jars were aerated when necessary and flushed again to ensure
that CO2 concentrations did not exceed 10,000 ppm.
Isotopic calculations
The CO2 concentration measured in each glass jar was assumed to be a mix of CO2 originating
from the mineralization of organic compounds and from the dissolution of carbonates:
𝐶𝐶𝑆𝑆2 = 𝑆𝑆𝑆𝑆𝐶𝐶 − 𝐶𝐶𝑆𝑆2+ 𝑆𝑆𝑆𝑆𝐶𝐶 − 𝐶𝐶𝑆𝑆2 (1)
where CO2 concentrations are expressed in ppm
Carbon isotope ratio is presented in δ notation, defined as follows: 𝛿𝛿(‰) = 𝑅𝑅𝑠𝑠𝑠𝑠𝑠𝑠𝑠𝑠𝑠𝑠𝑠𝑠𝑅𝑅 − 𝑅𝑅𝑃𝑃𝑃𝑃𝑃𝑃
𝑃𝑃𝑃𝑃𝑃𝑃 × 1000 (2)
where Rsample is the 13C/12C isotope ratio of the sample and RPDB is the 13C/12C ratio of the
international pee dee belemnite (PDB) standard (Coplen, 1995). The analytical precision of the
δ13C measurements was 0.1‰. We assumed that the carbonates in the soil solution were in
isotopic equilibrium with the solid carbonates (Bertrand et al., 2007). We also neglected the
isotopic fractionation between SIC and the SIC-derived CO2 and between SOC and the
various steps (carbonate dissolution, chemical equilibrium with HCO3- and dissolved CO2, CO2
transfer towards the atmosphere), previous studies expect that this kind of phenomenon would
have a limited impact in short term incubation (Rovira & Vallejo, 2008; Chevallier et al., 2016).
In the same way, isotopic fractionation during the mineralization of SOC, which has been
reported of limited amplitude or not significant, was also neglected in the calculations, as in
many isotopic studies on SOC mineralization (Bertrand et al., 2007; Boström et al., 2007).
The contribution of SIC-derived CO2 (fSIC) was estimated using a two-end member mixing
model (Balesdent et al., 1987; Ramnarine et al., 2012):
𝛿𝛿13𝐶𝐶 − 𝐶𝐶𝑆𝑆
2 = 𝑓𝑓𝑆𝑆𝑆𝑆𝑆𝑆 × 𝛿𝛿13𝐶𝐶 − 𝑆𝑆𝑆𝑆𝐶𝐶 + (1 − 𝑓𝑓𝑆𝑆𝑆𝑆𝑆𝑆) × 𝛿𝛿13𝐶𝐶 − 𝑆𝑆𝑆𝑆𝐶𝐶 (3)
The equation can be rewritten as:
𝑓𝑓𝑆𝑆𝑆𝑆𝑆𝑆 = 𝛿𝛿
13𝐶𝐶 − 𝐶𝐶𝑆𝑆
2− 𝛿𝛿13𝐶𝐶 − 𝑆𝑆𝑆𝑆𝐶𝐶
𝛿𝛿13𝐶𝐶 − 𝑆𝑆𝑆𝑆𝐶𝐶 − 𝛿𝛿13𝐶𝐶 − 𝑆𝑆𝑆𝑆𝐶𝐶 (4)
with 𝛿𝛿13𝐶𝐶 − 𝐶𝐶𝑆𝑆2 as the δ13C of the total CO2 emitted from soil sample, 𝛿𝛿13𝐶𝐶 − 𝑆𝑆𝑆𝑆𝐶𝐶, the δ13C
of the SOC and 𝛿𝛿13𝐶𝐶 − 𝑆𝑆𝑆𝑆𝐶𝐶, the δ13C of the SIC of each soil samples.
If we assume that SIC emissions and SOC emissions are independent, the amount of CO2 (µg
C-CO2 g-1 soil) derived from SOC respiration can be then calculated as follows:
𝑆𝑆𝑆𝑆𝐶𝐶 − 𝐶𝐶𝑆𝑆2 = (1 − 𝑓𝑓𝑆𝑆𝑆𝑆𝑆𝑆) × 𝐶𝐶𝑆𝑆2 (5)
The amount of CO2 (µg C-CO2 g-1 soil) derived from SIC is expressed as follows:
𝑆𝑆𝑆𝑆𝐶𝐶 − 𝐶𝐶𝑆𝑆2 = 𝑓𝑓𝑆𝑆𝑆𝑆𝑆𝑆 × 𝐶𝐶𝑆𝑆2 (6)
Kinetic parameters are often derived from incubation experiments using models of different
complexity to gain information about the carbon turnover. For a single-pool model, the total
SOC is assumed to decompose with a certain turnover rate, whereas for the double-pool model
the SOC is separated into two different compartments, i.e. into a labile pool with a short
turnover time and into a non-labile or refractory pool with a longer turnover time (Qayyum et
al., 2012). Given the short duration of the incubation in the present study (44 days), it was not
possible to satisfactorily fit a two-pool model on the data, even using Bayesian calibration
approaches. We, therefore, used a single-pool model, mainly corresponding to the
decomposition of the labile pool during the duration of the experiment.
Here, we used a constrained fitting on % of total SOC mineralized data using a pool size (C1)
expressed in % of total SOC mineralized. At the end of the incubation (day 44), C1 equals the
total % of mineralized SOC (Weihermüller et al., 2018).
We used the following kinetic model to describe the data:
𝐶𝐶𝑡𝑡 = 𝐶𝐶1× 𝑒𝑒−𝑘𝑘1×𝑡𝑡 (8)
where Ct is the % SOC mineralized, C1 is the total size of the labile carbon pool (%), k1 is the
corresponding decomposition rate (day-1), and t is the duration of the incubation (day).
The mean residence time (MRT) was calculated from the decomposition rates by:
𝑀𝑀𝑅𝑅𝑀𝑀 = 𝑘𝑘1
1 (9)
In short-term incubations, the estimation of the decomposition rates can be uncertain, even for
analyze the real uncertainty and the identifiability of the parameter estimation (Scharnagl et al.,
2010; Li et al., 2013; Schädel et al., 2013). We used a probabilistic inversion approach, using
the BayesianTools R package (Hartig et al., 2018) and the runMCMC function to apply Markov
chain Monte Carlo (MCMC) methods to our data. The prior probability distribution function
(PDF) of the estimated parameters was specified as the uniform distributions over a set of
specific intervals. The probabilistic inversion was performed using a Markov chain Monte
Carlo algorithm (function runMCMC) to construct posterior probability density functions of
parameters. The algorithm was run 20000 times until convergence. Convergence was tested
using the Gelman–Rubin convergence diagnostic (function gelmanDiagnostics).
Microbial biomass and metabolic quotient
At the end of the incubations (day 44), microbial biomass carbon (MBC) was determined for
each sample using 5 g of soil, and following the fumigation-extraction method described by
Vance et al., (1987). The solution extracted with K2SO4 (5g/L) was analyzed with a TOC
analyzer (TOC 505A, Shimadzu, Autosampler ASI-5000A, Tokyo, Japan). Microbial biomass
carbon content was calculated as EC/KEC, where EC is the difference between extracted organic
C of fumigated and non-fumigated soils and KEC = 0.45 (Wu et al., 1990; Jenkinson et al.,
2004).
The metabolic quotient or specific respiration of the biomass (qCO2) is the ratio of soil basal
respiration to microbial biomass. The quotient qCO2 is expressed in mg C-CO2 µg Cmic-1 h-1 10 -4. It indicates the ecophysiological status of soil microorganisms (Anderson & Domsch, 1985,
1993). For the calculation of the qCO2, the hourly SOC-derived CO2 (soil heterotrophic
respiration) (𝑆𝑆𝑆𝑆𝐶𝐶 − 𝐶𝐶𝑆𝑆2 in mg C-CO2 g-1 soil h-1) was taken after soils had reached a relatively
constant CO2 production rate, between day 35 and day 44, just before the measurement of
microbial biomass.
Statistical analyses
To test for general sampling location (tree row, alley, control) and depth effects on the different
variables (Table S1), we performed a general linear mixed model (GLMM) analysis, with depth
and sampling location as fixed factors and soil cores (pseudoreplicates) nested in the sampling
location as a random factor to control for pseudoreplication and potential sampling location
effects. Since samples from each soil core (four depths) were not independent from each other,
we accounted for this correlation incorporating a symmetrical compound covariance matrix.
For this analysis, we used all the collected samples per sampling location (N=3), soil cores
(N=4) and depth (N=4), resulting in a total of 48 samples. Residuals were assessed for normality
both visually using frequency distributions and Q-Q plots and statistically using Shapiro-Wilk
tests, and data were log-transformed when necessary. The significance of the fixed factor was
tested with a type-II analysis of variance and chi-square Wald tests (χ2). Simple pair-wise
comparisons between treatments were then performed on the GLMMs with Student’s t-test.
All the statistical analyses were performed using R software version 3.1.1 (R Development
from the lme4 package (Bates, 2010). Simple pair-wise comparisons were done using the
lsmeans function from the lsmeans package (Lenth, 2016)
Results
Concentrations and δ13C of soil organic and inorganic carbon
The ANOVA revealed that SOC concentrations were significantly dependent on sampling
location, depth and on their interaction (Table S1). Soil organic carbon concentrations
decreased with depth and were less than 10 mg C g-1 soil (i.e. < 1%) for all locations and depths,
except in the tree row at 0-10 cm (Table 1). They were significantly larger in the tree row than
in the alley (p-value < 0.001) and in the control plot (p-value < 0.001) at 0-10 cm depth. The
same was found at 10-30 cm (p-value = 0.02 and 0.01, respectively). No significant difference
between locations was found below 30 cm depth. The C/N ratio was significantly dependent on
sampling location and on soil depth (Table S1).
Soil inorganic concentrations were very high and on average eight to ten times larger than SOC
concentration (Table 1) and were significantly dependent on sampling location and on soil
depth (Table S1).
Clay and silt content were similar at 0-10 cm and 10-30 cm and then increased with soil depth
(Table 1).
The 𝛿𝛿13𝐶𝐶 − 𝑆𝑆𝑆𝑆𝐶𝐶 was significantly dependent on soil depth and on the interaction between sampling location and soil depth (Table S1). At 0-10 cm, 𝛿𝛿13𝐶𝐶 − 𝑆𝑆𝑆𝑆𝐶𝐶 was significantly less in the tree row (-27.57‰) than in the alley (-26.58‰) and in the control plot (-26.60‰) (p-values
< 0.001) (Table 2). For all sampling locations, the largest 𝛿𝛿13𝐶𝐶 − 𝑆𝑆𝑆𝑆𝐶𝐶 was found at 70-100 cm (Table 2).
The 𝛿𝛿13𝐶𝐶 − 𝑆𝑆𝑆𝑆𝐶𝐶 was significantly dependent on sampling location (p-value = 0.02) and soil depth (p-value = 0.04) (Table S1), but values remained very similar and were about -2 ‰ (Table
2). The δ13C signature of SIC and SOC differed by more than -20 ‰.
Cumulated total, SOC- and SIC-derived CO2 emissions from soils
The δ13C signature of CO2 emitted from soils differed from that of the SOC. The CO2 emissions
were 13C-enriched by around 5‰ to 15‰ compared to the SOC and were therefore shifted
towards the δ13C signatures of SIC, especially at depth (Fig. 1). For a given soil sample, δ13C
signatures of evolved CO2 did not vary much during the incubation period (± 2‰) (data not
shown).
At the end of the incubation, the cumulated CO2,𝑆𝑆𝑆𝑆𝐶𝐶 − 𝐶𝐶𝑆𝑆2 and 𝑆𝑆𝑆𝑆𝐶𝐶 − 𝐶𝐶𝑆𝑆2emissions were
all significantly dependent on sampling location, on soil depth and on their interaction (Table
S1). However, total CO2, 𝑆𝑆𝑆𝑆𝐶𝐶 − 𝐶𝐶𝑆𝑆2 and 𝑆𝑆𝑆𝑆𝐶𝐶 − 𝐶𝐶𝑆𝑆2 emissions were only significantly higher
in tree row than in the alley or in the control plot at 0-10 cm (p-values < 0.001) (Table 3). Below
this topsoil layer, there was no significant difference between sampling locations.
In the alley and in the control plot, no significant difference was found between cumulated
𝑆𝑆𝑆𝑆𝐶𝐶 − 𝐶𝐶𝑆𝑆2emissions at 0-10 cm and at 10-30 cm (p-value = 0.54 and 0.14, respectively)
at 0-10 cm than at 10-30 cm (p-value < 0.001). For the three sampling locations, cumulated
𝑆𝑆𝑆𝑆𝐶𝐶 − 𝐶𝐶𝑆𝑆2emissions were significantly higher in the two topsoil layers than in the two subsoil
layers.
Contribution of SIC and SOC to the emitted CO2 from soils
Calculated contributions of 𝑆𝑆𝑆𝑆𝐶𝐶 − 𝐶𝐶𝑆𝑆2 to total CO2 emissions according to Eq. 4 and 6 were
comprised between 15 and 30% in topsoil layers and between 50 and 70% in subsoil layers
(Fig. 2). In topsoil layers, most of the total emitted CO2 originated from SOC, while in deep
soil layers it mainly originated from SIC (Fig. 2). In general, the relative contribution of
𝑆𝑆𝑆𝑆𝐶𝐶 − 𝐶𝐶𝑆𝑆2 to total CO2 emissions was slightly higher at the beginning of the incubation and
decreased after one day of incubation to reach an equilibrium within one week (Fig. 2). We
found an exponential relationship between the contribution of SIC to the total soil C and the
contribution of 𝑆𝑆𝑆𝑆𝐶𝐶 − 𝐶𝐶𝑆𝑆2 to the total CO2 emissions with a coefficient of determination of
0.69 (Fig. 3A). Cumulative 𝑆𝑆𝑆𝑆𝐶𝐶 − 𝐶𝐶𝑆𝑆2 emissions were also correlated to cumulative 𝑆𝑆𝑆𝑆𝐶𝐶 − 𝐶𝐶𝑆𝑆2 emissions and a saturation model was significantly fitted (Fig. 3B).
Percentage of SOC mineralized and SOC decomposition rates
The percentage of initial SOC mineralized at the end of the incubation decreased with depth.
At 0-10 cm, 2.94 ± 0.07 %, 1.66 ± 0.28 % and 1.92 ± 0.24 % of initial SOC were mineralized
after 44 days of incubation, in the tree rows, alleys and in the control (Table 3, Fig. 4). At
160-180 cm, only 0.20% of SOC was mineralized whatever the location. No clear difference was
proportion of total SOC was mineralized, and at 70-100 cm in the alley where this proportion
was lower compared to other locations (Fig. 4).
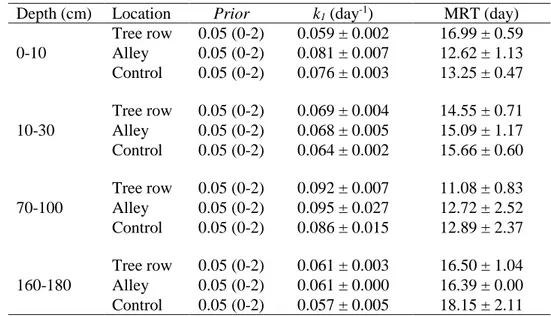
The SOC decomposition rate k1 and the mean residence time (MRT) were significantly
dependent on soil depth (p-values = 0.003 and < 0.001, respectively) even if trends were not
clear, but they were not significantly dependent on sampling location (Table S1). For a given
depth, the SOC decomposition rate k1 did not significantly change with sampling location. At
0-10 cm, k1 was 0.059 day-1 in the tree row, 0.081 day-1 in the alley and 0.076 day-1 in the
control, but no difference was found (Table 4).
Microbial biomass and qCO2
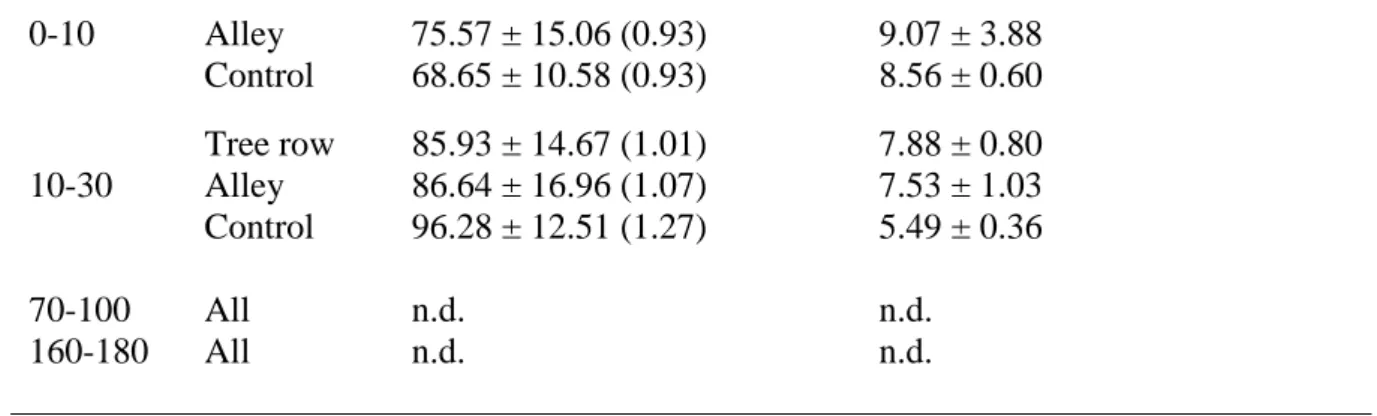
At 70-100 cm and 160-180 cm, the MBC was below the detection threshold of the analyzer
(Table 5). The ANOVA showed at MBC was significantly dependent on sampling location, on
soil depth and on their interaction (Table S1). At 0-10 cm, the MBC was more than four times
greater in the tree row than in the alley and in the control, and MBC contribution to SOC was
also two times higher (Table 5). At 10-30 cm, there was no significant difference between the
different locations. In the tree row, the MBC was significantly higher at 0-10 cm than at 10-30
cm (p-value < 0.001). The qCO2 was neither significantly dependent on sampling location nor
on soil depth (Table S1).
Discussion
Soil inorganic carbon contributed to the total CO2 emissions from soil at each soil depth, each
sampling location and during the whole period of soil incubation. The enrichment by 5 to 15‰
of 13C of the total CO2 emissions compared to the SOC can not only derive from the isotopic
fractionation during the SOC mineralization (Schweizer et al., 1999). This increase in δ13C of
the CO2 emissions cannot be explained without the contribution of an external C pool with high
δ13C and, hence, indicated a contribution of SIC to total CO
2 emissions (Stevenson & Verburg,
2006). This contribution was about 15 to 30% in the topsoil and quite close to the values
encountered in literature for soil incubations in similar conditions to ours (Bertrand et al., 2007;
Inglima et al., 2009; Chevallier et al., 2016). Even though SOC was the main contributor to the
substantial evolved CO2 in the topsoil (Fig. 2; Table 3), our results suggest that ignoring the
contribution of SIC to soil respiration could lead to overestimations, especially in the subsoil
where the contribution of 𝑆𝑆𝑆𝑆𝐶𝐶 − 𝐶𝐶𝑆𝑆2 to total CO2 emissions was greater than 60% (Ramnarine
et al., 2012). However, the scale of this overestimation of soil respiration probably depends on
the contribution of SIC to total soil C as shown in Fig. 3A. In our case, the SOC content was
very low, and the amount of carbonates very high especially at depth.
The absolute amount of 𝑆𝑆𝑆𝑆𝐶𝐶 − 𝐶𝐶𝑆𝑆2decreased with depth while the amount of SIC was similar in top and subsoil. Similarly, 𝑆𝑆𝑆𝑆𝐶𝐶 − 𝐶𝐶𝑆𝑆2 emissions were larger at 0-10 cm in the tree rows than in the alley or in the control (Table 3), while there was no significant difference in SIC contents
(Table 1). This seems to indicate that CO2 emissions from SIC were linked to the SOC content
and its mineralization. At 0-10 cm in the tree row, SOC concentration and microbial biomass
this layer (Cardinael et al., 2015a). These very labile OM soil fractions produce organic acids
during decomposition (Adeleke et al., 2017), which could trigger carbonate dissolution. The
high microbial biomass at 0-10 cm in the tree row leads to increased microbial respiration. This
high production of CO2 might destabilize the CaCO3/HCO3-/H2CO3/CO2 equilibrium and
induce exchanges of C between SIC and SOC derived CO2 (Tamir et al., 2013; Chevallier et
al., 2017). The contribution of 𝑆𝑆𝑆𝑆𝐶𝐶 − 𝐶𝐶𝑆𝑆2, or its apparent contribution, to total CO2 emissions
seemed to be partially controlled by the contribution of SIC content to total soil C, and by the
amount of 𝑆𝑆𝑆𝑆𝐶𝐶 − 𝐶𝐶𝑆𝑆2 (Fig. 3). As already pointed out by Chevallier et al., (2016, 2017), the assumption that 𝑆𝑆𝑆𝑆𝐶𝐶 − 𝐶𝐶𝑆𝑆2and 𝑆𝑆𝑆𝑆𝐶𝐶 − 𝐶𝐶𝑆𝑆2are independent is thus probably incorrect. The use of δ13C analysis to determine the contribution of SIC and SOC to total CO
2 emissions from soil
has been used widely but is still questionable in calcareous soils. Exchanges of C in the soil
solution between C derived from SOC mineralisation and C derived from SIC dissolution might
occur, especially in laboratory incubations with optimal soil moisture. Indeed, the CO2 emitted
by SOC can replace and displace SIC as carbonate (Lopez-Sangil et al., 2013), which could
generate SIC-labeled CO2 without a real contribution or losses of SIC to CO2 (Rovira & Vallejo,
2008). Consequently, the CO2 emissions would be labelled SIC but the 𝑆𝑆𝑆𝑆𝐶𝐶 − 𝐶𝐶𝑆𝑆2 would be
directly influenced by SOC. Due to the complexity and diversity of involved phenomena, such
as C exchanges between SOC and SIC pools, but also possible isotopic fractionation between
SOC or SIC and their respective CO2 emissions (Skidmore et al. 2004), our data cannot
disentangle the real implication of the SIC to measured CO2 emissions, and the real contribution
of carbonates to CO2 emissions might be overestimated.Nevertheless, our datahighlighted the
mineralization on SIC dissolution and precipitation, and consequently on the measured δ13
C-CO2.
Subsoil OC is as prone to decomposition as surface OC
As expected, 𝑆𝑆𝑆𝑆𝐶𝐶 − 𝐶𝐶𝑆𝑆2 emissions were larger in the topsoil than in the subsoil. However, the SOC decomposition rates were similar in the topsoil and in the subsoil, suggesting that deep
SOC is as prone to decomposition as surface SOC under optimal incubation conditions (Stone
& Plante, 2015). This, therefore, suggests that the size of the decomposing carbon pool was
smaller in the subsoil, but its potential decomposition rate was not reduced (Salomé et al.,
2010). Several incubation studies of different soil layers in the Mediterranean region also found
that deep soil C was not more stable than topsoil C (Llorente & Turrion, 2010; Rovira et al.,
2010; Bounouara et al., 2017). Given the short duration of the incubation (44 days), the carbon
pool contributing to CO2 emissions is likely to be a labile carbon pool, such as dissolved organic
carbon or particulate organic carbon. The clay content of the two subsoil layers was almost two
times higher than for the two topsoil layers (Table 1). The clay content is usually an important
parameter to estimate the carbon stabilization potential of soils (Kleber et al., 2015).
Unfortunately, the microbial biomass was too small to be quantified in the subsoil, but it was
definitely very small as also shown by other authors (Fierer et al., 2003). As suggested by Wang
et al., (2003), it, therefore, seems that under favourable temperature and moisture conditions
and in short-term incubations, soil respiration is limited by the supply of biologically available
substrate rather than by the clay content or the microbial biomass (Wang et al., 2003). In a
to microbial activity and litter decomposition than in upper layers in which drought and water
availability were strong limiting factors. At our site, the same process might occur, potentially
explaining why most of the additional SOC in the agroforestry plot was located in the topsoil
despite important carbon inputs to deep soil layers (Cardinael et al., 2015a, 2018b).
No clear difference in SOC decomposition rate between the agroforestry and the control plots
The only significant difference between agroforestry and the control plot was observed at 0-10
cm where the SOC decomposition rate was lower in the tree row than in the alley or in the
control (Table 4). Cardinael et al. (2015a) found that the important increase in SOC stocks in
this soil layer was mainly due to particulate organic matter (POM) (50-200 and 200-2000 µm).
In the present study, we also found that the 𝛿𝛿13𝐶𝐶 − 𝑆𝑆𝑆𝑆𝐶𝐶 was significantly lower in this soil layer and that the C/N ratio was higher. We therefore suggest that the lower quality and the
lignin content of the POMs (chemical recalcitrance) could explain the short-term slower
potential decomposition rate at 0-10 cm in the tree rows (Schweizer et al., 1999; Thevenot et
al., 2010). Another explanation (temperature and moisture being constant in this incubation)
could be the lowest nutrient availability, tree rows receiving no mineral fertilizers, which might
limit SOC decomposition (Averill & Waring, 2018). Cardinael et al., (2018b) found at the same
site that, compared to the alleys, tree rows receive huge amounts of carbon, including tree root
carbon, tree litterfall but also carbon from the understorey vegetation, potentially explaining a
different chemical composition of the labile carbon pool. A parallel study on the same site on
SOC mineralization from intact (3-5 mm) and crushed aggregates (< 200 µm) was performed
soil aggregates is not the main mechanism explaining carbon stabilization at this site
(unpublished data). More in-depth studies on SOC stabilization processes in agroforestry
systems are required.
Conclusion
Our study revealed an important contribution of 𝑆𝑆𝑆𝑆𝐶𝐶 − 𝐶𝐶𝑆𝑆2 in a calcareous soil potentially leading to an overestimation of soil respiration measured in arid and semi-arid regions,
especially in deep soil layers. However, studies on fine-scale processes controlling the
exchange of CO2 emitted by SOC decomposition and CO2 involved in dissolution-precipitation
reactions are desperately missing to go beyond this result. Our study also confirmed previous
findings showing that deep SOC can be as easily decomposed as surface SOC under optimal
temperature and moisture conditions. No clear difference in SOC mineralization potentials was
found between the agroforestry and the control plots. We conclude that deep SOC dynamics
and stabilization processes should be more investigated in agroforestry and in carbonated soils
given their potential impact on global warming.
Acknowledgments
This study was financed by the French Environment and Energy Management Agency
(ADEME), following a call for proposals as part of the REACCTIF program (Research on
Climate Change Mitigation in Agriculture and Forestry). This work was part of the funded
Rémi Cardinael was supported both by ADEME and by La Fondation de France. The authors
are grateful to Philippe Letourmy (CIRAD) for his help with the statistical analysis.
Data availability
The data that support the findings of this study are available from the corresponding author
upon reasonable request.
References
Adeleke, R., Nwangburuka, C., & Oboirien, B. 2017. Origins, roles and fate of organic acids in
soils: A review. South African Journal of Botany 108, 393–406.
Albrecht, A., & Kandji, S.T. 2003. Carbon sequestration in tropical agroforestry systems.
Agriculture, Ecosystems and Environment 99, 15–27.
Anderson, T.H., & Domsch, K.H. 1985. Determination of ecophysiological maintenance
carbon requirements of soil microorganisms in a dormant state. Biology and Fertility of
Soils 1, 81–89.
Anderson, T.H., & Domsch, K.H. 1993. The metabolic quotient for CO2 (qCO2) as a specific
activity parameter to assess the effects of environmental conditions, such as pH, on the
microbial biomass of forest soils. Soil Biology and Biochemistry 25, 393–395.
Averill, C., & Waring, B. 2018. Nitrogen limitation of decomposition and decay: How can it
occur? Global Change Biology 24, 1417–1427.
C. 2018. Atmosphere-soil carbon transfer as a function of soil depth. Nature 559, 599–
602.
Balesdent, J., Mariotti, A., & Guillet, B. 1987. Natural 13C abundance as a tracer for studies of
soil organic matter dynamics. Soil Biology and Biochemistry 19, 25–30.
Bates, D.M. 2010. lme4: Mixed-effects modeling with R. , 145.
Bertrand, I., Delfosse, O., & Mary, B. 2007. Carbon and nitrogen mineralization in acidic, limed
and calcareous agricultural soils: Apparent and actual effects. Soil Biology and
Biochemistry 39, 276–288.
Boström, B., Comstedt, D., & Ekblad, A. 2007. Isotope fractionation and 13C enrichment in soil
profiles during the decomposition of soil organic matter. Oecologia 153, 89–98.
Bounouara, Z., Chevallier, T., Balesdent, J., Toucet, J., Sbih, M., Bernoux, M., Belaissaoui, N.,
Bouneb, O., & Bensaid, R. 2017. Variation in soil carbon stocks with depth along a
toposequence in a sub-humid climate in North Africa (Skikda, Algeria). Journal of Arid
Environments 141, 25–33.
Braakhekke, M.C., Beer, C., Hoosbeek, M.R., Reichstein, M., Kruijt, B., Schrumpf, M., &
Kabat, P. 2011. Somprof: A vertically explicit soil organic matter model. Ecological
Modelling 222, 1712–1730.
Braakhekke, M.C., Wutzler, T., Beer, C., Kattge, J., Schrumpf, M., Ahrens, B., Schöning, I.,
Hoosbeek, M.R., Kruijt, B., Kabat, P., & Reichstein, M. 2013. Modeling the vertical soil
organic matter profile using Bayesian parameter estimation. Biogeosciences 10, 399–420.
& Chenu, C. 2015a. Impact of alley cropping agroforestry on stocks, forms and spatial
distribution of soil organic carbon - A case study in a Mediterranean context. Geoderma
259–260, 288–299.
Cardinael, R., Mao, Z., Prieto, I., Stokes, A., Dupraz, C., Kim, J.H., & Jourdan, C. 2015b.
Competition with winter crops induces deeper rooting of walnut trees in a Mediterranean
alley cropping agroforestry system. Plant and Soil 391, 219–235.
Cardinael, R., Chevallier, T., Cambou, A., Béral, C., Barthès, B.G., Dupraz, C., Durand, C.,
Kouakoua, E., & Chenu, C. 2017. Increased soil organic carbon stocks under agroforestry:
A survey of six different sites in France. Agriculture, Ecosystems and Environment 236,
243–255.
Cardinael, R., Umulisa, V., Toudert, A., Olivier, A., Bockel, L., & Bernoux, M. 2018a.
Revisiting IPCC Tier 1 coefficients for soil organic and biomass carbon storage in
agroforestry systems. Environmental Research Letters 13, 1–20.
Cardinael, R., Guenet, B., Chevallier, T., Dupraz, C., Cozzi, T., & Chenu, C. 2018b. High
organic inputs explain shallow and deep SOC storage in a long-term agroforestry system
- Combining experimental and modeling approaches. Biogeosciences 15, 297–317.
Cardinael, R., Hoeffner, K., Chenu, C., Chevallier, T., Béral, C., Dewisme, A., & Cluzeau, D.
2019. Spatial variation of earthworm communities and soil organic carbon in temperate
agroforestry. Biology and Fertility of Soils 55, 171–183.
Chevallier, T., Blanchart, E., Albrecht, A., & Feller, C. 2004. The physical protection of soil
and market gardening (Martinique, West Indies). Agriculture, Ecosystems and
Environment 103, 375–387.
Chevallier, T., Cournac, L., Bernoux, M., Cardinael, R., Cozzi, T., Girardin, C., & Chenu, C.
2017. Soil inorganic carbon and climate change in drylands? An emerging issue? In
Global Symposium on Soil Organic Carbon (GSOC17). FAO, Rome, Italie.
Chevallier, T., Cournac, L., Hamdi, S., Gallali, T., & Bernoux, M. 2016. Temperature
dependence of CO2 emissions rates and isotopic signature from a calcareous soil. Journal
of Arid Environments 135, 132–139.
Clough, A., & Skjemstad, J.O. 2000. Physical and chemical protection of soil organic carbon
in three agricultural soils with different contents of calcium carbonate. Australian Journal
of Soil Research 38, 1005–1016.
Collins, H.P., Elliott, E.T., Paustian, K., Bundy, L.G., Dick, W.A., Huggins, D.R., Smucker,
A.J.M., & Paul, E.A. 2000. Soil carbon pools and fluxes in long-term Corn Belt
agroecosystems. Soil Biology and Biochemistry 32, 157–168.
Coplen, T.B. 1995. New IUPAC guidelines for the reporting of stable hydrogen, carbon, and
oxygen isotope-ratio data. Journal of Research of the National Institute of Standards and
Technology 100, 285.
Coplen, T.B., Kendall, C., & Hopple, J. 1983. Comparison of stable isotope reference samples.
Nature 21, 28–30.
Dean, W.E. 1974. Determination of carbonate and organic matter in calcareous sediments and
Sedimentary Research 44, 242–248.
Eilers, K.G., Debenport, S., Anderson, S., & Fierer, N. 2012. Digging deeper to find unique
microbial communities: The strong effect of depth on the structure of bacterial and
archaeal communities in soil. Soil Biology and Biochemistry 50, 58–65.
Eswaran, H., Reich, P.F., Kimble, J.M., Beinroth, F.H., Padmanabhan, E., & Moncharoen, P.
2000. Global carbon sinks. p. 15–26. In Lal, R., Kimble, J.M., Eswaran, H., Stewart, B.A.
(eds.), Global Climate Change and Pedogenic Carbonates. CRC Press, Boca Raton, FL.
Fang, C., & Moncrieff, J.B. 2005. The variation of soil microbial respiration with depth in
relation to soil carbon composition. Plant and Soil 268, 243–253.
Fernández-Ugalde, O., Virto, I., Barré, P., Apesteguía, M., Enrique, A., Imaz, M.J., &
Bescansa, P. 2014. Mechanisms of macroaggregate stabilisation by carbonates:
Implications for organic matter protection in semi-arid calcareous soils. Soil Research 52,
180–192.
Fernández-Ugalde, O., Virto, I., Barré, P., Gartzia-Bengoetxea, N., Enrique, A., Imaz, M.J., &
Bescansa, P. 2011. Effect of carbonates on the hierarchical model of aggregation in
calcareous semi-arid Mediterranean soils. Geoderma 164, 203–214.
Fierer, N., Allen, A.S., Schimel, J.P., & Holden, P.A. 2003. Controls on microbial CO2
production: A comparison of surface and subsurface soil horizons. Global Change Biology
9, 1322–1332.
Fontaine, S., Barot, S., Barré, P., Bdioui, N., Mary, B., & Rumpel, C. 2007. Stability of organic
Germon, A., Cardinael, R., Prieto, I., Mao, Z., Kim, J., Stokes, A., Dupraz, C., Laclau, J.-P., &
Jourdan, C. 2016. Unexpected phenology and lifespan of shallow and deep fine roots of
walnut trees grown in a silvoarable Mediterranean agroforestry system. Plant and Soil
401, 409–426.
Gocke, M., Pustovoytov, K., & Kuzyakov, Y. 2011. Carbonate recrystallization in root-free soil
and rhizosphere of Triticum aestivum and Lolium perenne estimated by 14C labeling.
Biogeochemistry 103, 209–222.
Guenet, B., Eglin, T., Vasilyeva, N., Peylin, P., Ciais, P., & Chenu, C. 2013. The relative
importance of decomposition and transport mechanisms in accounting for soil organic
carbon profiles. Biogeosciences 10, 2379–2392.
Harris, D., Horwath, W.R., & van Kessel, C. 2001. Acid fumigation of soils to remove
carbonates priori to total organic carbon or carbon-13 isotopic analysis. Soil Science
Society of America Journal 65, 1853–1856.
Hartig, F., Minunno, F., & Paul, S. 2018. BayesianTools: General-Purpose MCMC and SMC
Samplers and Tools for Bayesian Statistics. R package version 0.1.4.
https://CRAN.R-project.org/package=BayesianTools, 71p.
Inglima, I., Alberti, G., Bertolini, T., Vaccari, F.P., Gioli, B., Miglietta, F., Cotrufo, M.F., &
Peressotti, A. 2009. Precipitation pulses enhance respiration of Mediterranean ecosystems:
The balance between organic and inorganic components of increased soil CO2 efflux.
Global Change Biology 15, 1289–1301.
2007. World Soil Resources Reports No. 103. FAO, Rome.
Jenkinson, D.S., Brookes, P.C., & Powlson, D.S. 2004. Measuring soil microbial biomass. Soil
Biology and Biochemistry 36, 5–7.
Jones, G.A., & Kaiteris, P. 1983. A vacuum-gasometric technique for rapid and precise analysis
of calcium carbonate in sediments and soils. Journal of Sedimentary Petrology 2, 655–
660.
Keiluweit, M., Nico, P.S., Kleber, M., & Fendorf, S. 2016. Are oxygen limitations under
recognized regulators of organic carbon turnover in upland soils? Biogeochemistry 127,
157–171.
Keiluweit, M., Wanzek, T., Kleber, M., Nico, P., & Fendorf, S. 2017. Anaerobic microsites
have an unaccounted role in soil carbon stabilization. Nature Communications 8, 1–8.
Kim, D.G., Kirschbaum, M.U.F., & Beedy, T.L. 2016. Carbon sequestration and net emissions
of CH4 and N2O under agroforestry: Synthesizing available data and suggestions for future
studies. Agriculture, Ecosystems and Environment 226, 65–78.
Kleber, M., Eusterhues, K., Keiluweit, M., Mikutta, C., Mikutta, R., & Nico, P.S. 2015.
Mineral-Organic Associations: Formation, Properties, and Relevance in Soil
Environments. Elsevier Ltd.
Lal, R., & Kimble, J.M. 2000. Pedogenic carbonates and the global carbon cycle. p. 1–14. In
Lal, R., Kimble, J.M., Eswaran, H., Stewart, B.A. (eds.), Global Climate Change and
Pedogenic Carbonates. CRC Press, USA.
Software 69.
Li, D., Schädel, C., Haddix, M.L., Paul, E.A., Conant, R., Li, J., Zhou, J., & Luo, Y. 2013.
Differential responses of soil organic carbon fractions to warming: Results from an
analysis with data assimilation. Soil Biology and Biochemistry 67, 24–30.
Llorente, M., & Turrion, M.B. 2010. Microbiological parameters as indicators of soil organic
carbon dynamics in relation to different land use management. European Journal of Forest
Research 129, 73–81.
Lopez-Sangil, L., Rovira, P., & Casals, P. 2013. Decay and vertical reallocation of organic C,
and its incorporation into carbonates, in agricultural soil horizons at two different depths
and rewetting frequencies. Soil Biology and Biochemistry 61, 33–44.
Lorenz, K., & Lal, R. 2014. Soil organic carbon sequestration in agroforestry systems. A
review. Agronomy for Sustainable Development 34, 443–454.
Mathieu, J.A., Hatté, C., Balesdent, J., & Parent, É. 2015. Deep soil carbon dynamics are driven
more by soil type than by climate: A worldwide meta-analysis of radiocarbon profiles.
Global Change Biology 21, 4278–4292.
McCrea, J.M. 1950. On the isotopic chemistry of carbonates and a paleotemperature scale. The
Journal of Chemical Physics 18, 849–857.
Mucciarone, D.A., & Williams, D.F. 1990. Stable isotope analyses of carbonates complicated
by nitrogen contamination: a Delaware basin example. Journal of Sedimentary Petrology
60, 608–614.
southern France: What consequences for modelling of tree root dynamics? Plant and Soil
281, 71–85.
Nair, P.K.R. 1993. An introduction to agroforestry. Kluwer Academic Publishers, Dordrecht,
The Netherlands.
Pardon, P., Reubens, B., Reheul, D., Mertens, J., De Frenne, P., Coussement, T., Janssens, P.,
& Verheyen, K. 2017. Trees increase soil organic carbon and nutrient availability in
temperate agroforestry systems. Agriculture, Ecosystems and Environment 247, 98–111.
Qayyum, M.F., Steffens, D., Reisenauer, H.P., & Schubert, S. 2012. Kinetics of Carbon
Mineralization of Biochars Compared with Wheat Straw in Three Soils. Journal of
Environment Quality 41, 1210–1220.
R Development Core Team. 2013. R: A language and environment for statistical computing.
Ramnarine, R., Wagner-Riddle, C., Dunfield, K.E., & Voroney, R.P. 2012. Contributions of
carbonates to soil CO2 emissions. Canadian Journal of Soil Science 92, 599–607.
Romanyà, J., & Rovira, P. 2011. An appraisal of soil organic C content in Mediterranean
agricultural soils. Soil Use and Management 27, 321–332.
Rovira, P., Jorba, M., & Romanyà, J. 2010. Active and passive organic matter fractions in
Mediterranean forest soils. Biology and Fertility of Soils 46, 355–369.
Rovira, P., & Vallejo, V.R. 1997. Organic carbon and nitrogen mineralization under
Mediterranean climatic conditions: The effects of incubation depth. Soil Biology and
Biochemistry 29, 1509–1520.
organic matter decomposition in a Mediterranean climate: A field incubation experiment.
Geoderma 144, 517–534.
Rumpel, C., & Kögel-Knabner, I. 2011. Deep soil organic matter - a key but poorly understood
component of terrestrial C cycle. Plant and Soil 338, 143–158.
Salomé, C., Nunan, N., Pouteau, V., Lerch, T.Z., & Chenu, C. 2010. Carbon dynamics in topsoil
and in subsoil may be controlled by different regulatory mechanisms. Global Change
Biology 16, 416–426.
Sanchez‐Cañete, E.P., Serrano-Ortiz, P., Kowalski, A.S., Oyonarte, C., & Domingo, F. 2011. Subterranean CO2 ventilation and its role in the net ecosystem carbon balance of a karstic
shrubland. Geophysical Research Letters 38.
Schädel, C., Luo, Y., David Evans, R., Fei, S., & Schaeffer, S.M. 2013. Separating soil CO2
efflux into C-pool-specific decay rates via inverse analysis of soil incubation data.
Oecologia 171, 721–732.
Scharnagl, B., Vrugt, J.A., Vereecken, H., & Herbst, M. 2010. Information content of
incubation experiments for inverse estimation of pools in the Rothamsted carbon model:
A Bayesian perspective. Biogeosciences 7, 763–776.
Schindlbacher, A., Borken, W., Djukic, I., Brandstätter, C., Spötl, C., & Wanek, W. 2015.
Contribution of carbonate weathering to the CO2 efflux from temperate forest soils.
Biogeochemistry 124, 273–290.
Schweizer, M., Fear, J., & Cadisch, G. 1999. Isotopic (13C) fractionation during plant residue
in Mass Spectrometry 13, 1284–1290.
Serrano-Ortiz, P., Domingo, F., Cazorla, A., Were, A., Cuezva, S., Villagarcía, L.,
Alados-Arboledas, L., & Kowalski, A.S. 2009. Interannual CO2 exchange of a sparse
Mediterranean shrubland on a carbonaceous substrate. Journal of Geophysical Research:
Biogeosciences 114, 1–11.
Serrano-Ortiz, P., Roland, M., Sanchez-Moral, S., Janssens, I.A., Domingo, F., Goddéris, Y.,
& Kowalski, A.S. 2010. Hidden, abiotic CO2 flows and gaseous reservoirs in the terrestrial
carbon cycle: Review and perspectives. Agricultural and Forest Meteorology 150, 321–
329.
Shang, C., & Tiessen, H. 2003. Soil organic C sequestration and stabilization in karstic soils of
Yucatan. Biogeochemistry 62, 177–196.
Soper, F.M., McCalley, C.K., Sparks, K., & Sparks, J.P. 2017. Soil carbon dioxide emissions
from the Mojave desert: Isotopic evidence for a carbonate source. Geophysical Research
Letters 44, 245–251.
de Soto, I.S., Virto, I., Barré, P., Fernández-Ugalde, O., Antón, R., Martínez, I., Chaduteau, C.,
Enrique, A., & Bescansa, P. 2017. A model for field-based evidences of the impact of
irrigation on carbonates in the tilled layer of semi-arid Mediterranean soils. Geoderma
297, 48–60.
Spohn, M., Klaus, K., Wanek, W., & Richter, A. 2016. Microbial carbon use efficiency and
biomass turnover times depending on soil depth - Implications for carbon cycling. Soil
Stevenson, B.A., & Verburg, P.S.J. 2006. Effluxed CO2-13C from sterilized and unsterilized
treatments of a calcareous soil. Soil Biology and Biochemistry 38, 1727–1733.
Stone, M.M., & Plante, A.F. 2015. Relating the biological stability of soil organic matter to
energy availability in deep tropical soil profiles. Soil Biology and Biochemistry 89, 162–
171.
Tamir, G., Shenker, M., Heller, H., Bloom, P.R., Fine, P., & Bar-Tal, A. 2011. Can Soil
Carbonate Dissolution Lead to Overestimation of Soil Respiration? Soil Science Society
of America Journal 75, 1414–1422.
Tamir, G., Shenker, M., Heller, H., Bloom, P.R., Fine, P., & Bar-Tal, A. 2012. Dissolution and
Re-crystallization Processes of Active Calcium Carbonate in Soil Developed on Tufa. Soil
Science Society of America Journal 76, 1606–1613.
Tamir, G., Shenker, M., Heller, H., Bloom, P.R., Fine, P., & Bar-Tal, A. 2013. Organic N
mineralization and transformations in soils treated with animal waste in relation to
carbonate dissolution and precipitation. Geoderma 209–210, 50–56.
Taylor, J.P., Wilson, B., Mills, M.S., & Burns, R.G. 2002. Comparison of microbial numbers
and enzymatic activities in surface soils and subsoils using various techniques. Soil
Biology and Biochemistry 34, 387–401.
Thevenot, M., Dignac, M.F., & Rumpel, C. 2010. Fate of lignins in soils: A review. Soil Biology
and Biochemistry 42, 1200–1211.
Tian, Q., Yang, X., Wang, X., Liao, C., Li, Q., Wang, M., Wu, Y., & Liu, F. 2016. Microbial
nitrogen addition in topsoil and subsoil. Biogeochemistry 128, 125–139.
Torralba, M., Fagerholm, N., Burgess, P.J., Moreno, G., & Plieninger, T. 2016. Do European
agroforestry systems enhance biodiversity and ecosystem services? A meta-analysis.
Agriculture, Ecosystems and Environment 230, 150–161.
Upson, M.A., Burgess, P.J., & Morison, J.I.L. 2016. Soil carbon changes after establishing
woodland and agroforestry trees in a grazed pasture. Geoderma 283, 10–20.
Vance, E.D., Brookes, P.C., & Jenkinson, D.S. 1987. An extraction method for measuring soil
microbial biomass C. Soil Biology and Biochemistry 19, 703–707.
Virto, I., Gartzia-Bengoetxea, N., & Fernández-Ugalde, O. 2011. Role of Organic Matter and
Carbonates in Soil Aggregation Estimated Using Laser Diffractometry. Pedosphere 21,
566–572.
Wang, W.J., Dalal, R.C., Moody, P.W., & Smith, C.J. 2003. Relationships of soil respiration to
microbial biomass, substrate availability and clay content. Soil Biology and Biochemistry
35, 273–284.
Weihermüller, L., Neuser, A., Herbst, M., & Vereecken, H. 2018. Problems associated to
kinetic fitting of incubation data. Soil Biology and Biochemistry 120, 260–271.
Wordell-Dietrich, P., Don, A., & Helfrich, M. 2017. Controlling factors for the stability of
subsoil carbon in a Dystric Cambisol. Geoderma 304, 40–48.
Wu, J., Joergensen, R.G., Pommerening, B., Chaussod, R., & Brookes, P.C. 1990. Measurement
of soil microbial biomass C by fumigation-extraction-an automated procedure. Soil
TABLES
Table 1 Soil characteristics. SOC: soil organic carbon; SIC: soil inorganic carbon. The carbon to nitrogen (C/N) ratio represents the C/N ratio of soil organic matter. N=4 for each soil depth and sampling location. Associated errors are standard errors.
Depth (cm) SOC concentration (mg C g-1 soil) SIC concentration (mg C g-1 soil)
C/N Soil texture (g kg-1 soil)
clay/silt/sand
Control Alley Tree row Control Alley Tree row Control Alley Tree row
0-10 7.4 ± 0.4 8.1 ± 0.5 16.9 ± 2.3 61.6 ± 0.9 54.9 ± 2.3 58.4 ± 2.8 9.5 ± 0.1 9.2 ± 0.1 9.9 ± 0.3 188/419/393
10-30 7.6 ± 0.1 8.1 ± 0.5 8.5 ± 0.6 62.3 ± 1.5 62.9 ± 3.7 58.8 ± 2.0 9.6 ± 0.2 9.4 ± 0.4 9.0 ± 0.2 180/409/411
70-100 5.3 ± 0.3 5.3 ± 0.1 5.1 ± 0.3 56.0 ± 2.7 48.0 ± 1.2 50.1 ± 1.9 8.2 ± 0.1 7.6 ± 0.3 7.4 ± 0.2 295/545/160
Table 2 δ13C (‰) values of soil organic carbon (SOC) and soil inorganic carbon (SIC). N=4
for each soil depth and sampling location. Associated errors are standard errors.
Depth (cm)
𝛿𝛿13𝐶𝐶 − 𝑆𝑆𝑆𝑆𝐶𝐶 (‰) 𝛿𝛿13𝐶𝐶 − 𝑆𝑆𝑆𝑆𝐶𝐶 (‰)
Control Alley Tree row Control Alley Tree row
0-10 -26.60 ± 0.09 -26.58 ± 0.13 -27.57 ± 0.05 -1.78 ± 0.19 -2.00 ± 0.20 -2.09 ± 0.25 10-30 -26.61 ± 0.02 -26.57 ± 0.08 -26.47 ± 0.04 -1.71 ± 0.10 -1.76 ± 0.10 -2.35 ± 0.18 70-100 -25.10 ± 0.09 -25.25 ± 0.12 -24.92 ± 0.03 -2.05 ± 0.20 -2.34 ± 0.08 -2.16 ± 0.08 160-180 -25.76 ± 0.13 -25.83 ± 0.06 -25.70 ± 0.12 -1.83 ± 0.08 -1.76 ± 0.17 -1.94 ± 0.11
Table 3 SOC-derived CO2 (𝑆𝑆𝑆𝑆𝐶𝐶 − 𝐶𝐶𝑆𝑆2), SIC-derived CO2 (𝑆𝑆𝑆𝑆𝐶𝐶 − 𝐶𝐶𝑆𝑆2), and total cumulated
CO2 (CO2) emissions after 44 days of incubations. N=4 for each soil depth and sampling
location. Values in brackets represent the total percentage of SOC lost through soil respiration
at the end of the incubation. Associated errors are standard errors. Significantly (p-value < 0.05)
different values between sampling locations per soil depth are followed by different lowercase
letters. Significantly (p-value < 0.05) different values between soil depths per sampling location
are followed by different uppercase letters.
Depth
(cm) 𝑆𝑆𝑆𝑆𝐶𝐶 − 𝐶𝐶𝑆𝑆2 (µg C g
-1 soil) 𝑆𝑆𝑆𝑆𝐶𝐶 − 𝐶𝐶𝑆𝑆
2 (µg C g-1 soil) CO2 (µg C g-1 soil)
Control Alley Tree row Control Alley Tree
row
Control Alley Tree row
0-10 144 ± 23 (1.92) 137 ± 33 (1.66) 497 ± 73 (2.94) 48 ± 4 45 ± 3 71 ± 2 192 ± 26 183 ± 35 569 ± 75 10-30 95 ± 5 (1.25) 119 ± 25 (1.44) 121 ± 12 (1.41) 39 ± 2 44 ± 3 42 ± 1 133 ± 7 163 ± 28 163 ± 12 70-100 17 ± 3 (0.32) 12 ± 1 (0.23) 17 ± 2 (0.33) 21 ± 1 19 ± 1 21 ± 2 38 ± 4 31 ± 1 38 ± 5 160-180 8 ± 0 (0.17) 9 ± 0 (0.21) 8 ± 1 (0.20) 14 ± 1 15 ± 1 13 ± 1 22 ± 1 24 ± 1 21 ± 2
Table 4 SOC decomposition rates (k1) and mean residence time (MRT) of the labile carbon pool. The prior value was set for the estimation of k1. Associated errors represent standard errors
(N = 4).
Depth (cm) Location Prior k1 (day-1) MRT (day)
0-10 Tree row 0.05 (0-2) 0.059 ± 0.002 16.99 ± 0.59 Alley 0.05 (0-2) 0.081 ± 0.007 12.62 ± 1.13 Control 0.05 (0-2) 0.076 ± 0.003 13.25 ± 0.47 10-30 Tree row 0.05 (0-2) 0.069 ± 0.004 14.55 ± 0.71 Alley 0.05 (0-2) 0.068 ± 0.005 15.09 ± 1.17 Control 0.05 (0-2) 0.064 ± 0.002 15.66 ± 0.60 70-100 Tree row 0.05 (0-2) 0.092 ± 0.007 11.08 ± 0.83 Alley 0.05 (0-2) 0.095 ± 0.027 12.72 ± 2.52 Control 0.05 (0-2) 0.086 ± 0.015 12.89 ± 2.37 160-180 Tree row 0.05 (0-2) 0.061 ± 0.003 16.50 ± 1.04 Alley 0.05 (0-2) 0.061 ± 0.000 16.39 ± 0.00 Control 0.05 (0-2) 0.057 ± 0.005 18.15 ± 2.11
Table 5 Soil microbial biomass carbon (MBC) and metabolic quotient. N=4 for each soil depth and sampling location. Associated errors are standard errors. Values in brackets represent the
contribution of microbial biomass C to SOC (%). n.d. not determined as Microbial biomass-C
was too low to be detectable. Depth
(cm)
Location Microbial biomass-C
(µg Cmic g-1 soil)
qCO2
(mg C-CO2 µg Cmic-1 h-1 *10-4)
0-10 Alley 75.57 ± 15.06 (0.93) 9.07 ± 3.88 Control 68.65 ± 10.58 (0.93) 8.56 ± 0.60 Tree row 85.93 ± 14.67 (1.01) 7.88 ± 0.80 10-30 Alley 86.64 ± 16.96 (1.07) 7.53 ± 1.03 Control 96.28 ± 12.51 (1.27) 5.49 ± 0.36 70-100 All n.d. n.d. 160-180 All n.d. n.d. FIGURES
Figure 1 δ13C (‰) profile of soil organic carbon (SOC), of soil inorganic carbon (SIC) and of
the CO2 emitted from the control, alley and the tree row soil samples between days 35 and 44
Figure 2 Contribution of soil organic carbon (SOC) and soil inorganic carbon (SIC) derived CO2 to cumulated CO2 emissions (µg C-CO2 g-1 soil)
during the incubation. C= control plot, A= cropped alley, R: tree row. Error bars are standard errors (N=4). The percentages represent the proportion
Figure 3 A) Contribution of soil inorganic carbon (SIC) derived CO2 (𝑆𝑆𝑆𝑆𝐶𝐶 − 𝐶𝐶𝑆𝑆2) as a function
of SIC content. B) Cumulative 𝑆𝑆𝑆𝑆𝐶𝐶 − 𝐶𝐶𝑆𝑆2 as a function of cumulative SOC-derived CO2 (𝑆𝑆𝑆𝑆𝐶𝐶 − 𝐶𝐶𝑆𝑆2).