HAL Id: hal-03175001
https://hal.archives-ouvertes.fr/hal-03175001
Submitted on 30 Mar 2021HAL is a multi-disciplinary open access archive for the deposit and dissemination of sci-entific research documents, whether they are pub-lished or not. The documents may come from teaching and research institutions in France or abroad, or from public or private research centers.
L’archive ouverte pluridisciplinaire HAL, est destinée au dépôt et à la diffusion de documents scientifiques de niveau recherche, publiés ou non, émanant des établissements d’enseignement et de recherche français ou étrangers, des laboratoires publics ou privés.
Distributed under a Creative Commons Attribution| 4.0 International License
management of alien invasive rodent populations in a
tropical montane forest
Quiterie Duron, T. Cornulier, Eric Vidal, E. Bourguet, Lise Ruffino
To cite this version:
Quiterie Duron, T. Cornulier, Eric Vidal, E. Bourguet, Lise Ruffino. Combining live and lethal trapping to inform the management of alien invasive rodent populations in a tropical montane forest. NeoBiota, Pensoft Publishers, 2020, 63, pp.101-125. �10.3897/neobiota.63.53811�. �hal-03175001�
Combining live and lethal trapping to inform
the management of alien invasive rodent
populations in a tropical montane forest
Quiterie Duron1, Thomas Cornulier2, Eric Vidal1,4, Edouard Bourguet1, Lise Ruffino3
1 Institut Méditerranéen de Biodiversité et d’Écologie marine et continentale (IMBE), Aix-Marseille
Univer-sité, Avignon UniverUniver-sité, CNRS, IRD, IMBE, Centre IRD Nouméa, BP A5, 98848 Nouméa Cedex, Nouvelle-Calédonie, France 2 Cruickshank Building, St Machar Drive, Aberdeen AB24 3UU, UK 3 Joint Nature Conservation Committee, Inverdee House, Baxter Street, Aberdeen AB11 9QA, UK 4 UMR ENTROPIE (IRD–Université de La Réunion–CNRS–Université de la Nouvelle-Calédonie), Institut de Recherche pour le Développement, BP A5, 98848 Nouméa CEDEX, New Caledonia, France
Corresponding author: Lise Ruffino (lisruffino@gmail.com)
Academic editor: S Bertolino | Received 30 April 2020 | Accepted 20 October 2020 | Published 8 December 2020
Citation: Duron Q, Cornulier T, Vidal E, Bourguet E, Ruffino L (2020) Combining live and lethal trapping to inform the management of alien invasive rodent populations in a tropical montane forest. NeoBiota 63: 101–125. https://doi. org/10.3897/neobiota.63.53811
Abstract
On large inhabited islands where complete eradication of alien invasive rodents through the use of poison delivery is often not practical or acceptable, mechanical trapping may represent the only viable option to reduce their impact in areas of high biodiversity value. However, the feasibility of sustained rodent control by trapping remains uncertain under realistic operational constraints. This study aimed to assess the effectiveness of non-toxic rat control strategies through a combination of lethal and live-trapping experiments, and scenario modelling, using the example of a remote montane rainforest of New Cal-edonia. Rat densities, estimated with spatially-explicit capture-recapture models, fluctuated seasonally (9.5–33.6 ind.ha-1). Capture probability (.01–.25) and home range sizes (HR
95, .23–.75 ha) varied greatly according to trapping session, age class, sex and species. Controlling rats through the use of lethal trapping allowed maintaining rat densities at ca. 8 ind.ha-1 over a seven-month period in a 5.5-ha montane forest. Simulation models based on field parameter estimates over a 200-ha pilot management area indicated that without any financial and social constraints, trapping grids with the finest mesh sizes achieved cumulative capture probabilities > .90 after 15 trapping days, but were difficult to implement and sustain with the
Copyright Quiterie Duron et al. This is an open access article distributed under the terms of the Creative Commons Attribution License (CC BY 4.0), which permits unrestricted use, distribution, and reproduction in any medium, provided the original author and source are credited.
local workforce. We evaluated the costs and effectiveness of alternative trapping strategies taking into ac-count the prevailing set of local constraints, and identified those that were likely to be successful. Scenario modelling, informed by trapping experiments, is a flexible tool for informing the design of sustainable control programs of island-invasive rodent populations, under idiosyncratic local circumstances.
Keywords
Invasive species, island conservation, predator control, Rattus, trap
Introduction
Human activities, such as agriculture and international trade, modify habitats and disturb the composition, richness and diversity of animal and plant communities (Garrott et al. 1993; Vitousek et al. 1997). Alien invasive mammals cause detrimental ecological effects on native taxa through predation, competition and spread of diseases (Garrott et al. 1993; Towns et al. 2006; Wäber et al. 2013; Medina et al. 2014; Lieury et al. 2015), and further alter ecosystem structure and functions through trophic cascades (Chollet and Martin 2013; Thoresen et al. 2017). In areas where complete removal of invasive mammals is not feasible or appropriate due to technical, social or ethical issues, the permanent control of their populations is a widely used approach to restore degraded ecosystems (Goodrich and Buskirk 1995; Doherty and Ritchie 2017; Lambin et al. 2020) and has proven successful in enhancing the recovery of a wide range of endangered taxa (Fletcher et al. 2010; Smith et al. 2010; Jones et al. 2016). Control programs by trapping, shooting or poison delivery are, however, a lengthy endeavour, with ongoing expenditures due to compensatory demographic effects leading to reinvasion (Gundersen et al. 2001). Density-dependent dispersal and changes in competitive interactions in the removal area, especially, enable target populations to recover through immigration from uncontrolled surrounding areas (Efford et al. 2000; Gundersen et al. 2001; Beasley et al. 2013; Lieury et al. 2015). A fundamental applied question is therefore how to identify control strategies that de-liver maximal benefits to biodiversity, while reducing reinvasion risks and operational costs (Doherty and Ritchie 2017).
Among the world’s most pervasive invasive species, rodents (Rattus spp. and Mus
musculus) greatly contribute to ecosystem degradation and biodiversity loss on
oce-anic islands (Atkinson 1985; Towns et al. 2006; Harper and Bunbury 2015). Rodent control programs are a common practice to achieve biodiversity conservation targets worldwide (Bomford and O’Brien 1995; Armstrong et al. 2014); yet these programs still represent a significant challenge for conservation scientists and practitioners (Duron et al. 2017). Improvement of control methods, local community engagement and adaptive management have been identified as key to improve the cost-effectiveness and sustainability of such projects (Duron et al. 2017). In addition, rat management techniques should benefit from collating baseline data on the population structure and dynamics of the target rodent populations, as well as a better understanding of the processes influencing their demographic responses to culling.
When rodent control needs to be conducted in the long term, poison delivered as bait is the most cost-effective measure, especially when treated areas are large and dominated by rugged terrain (Russell et al. 2008). However, repeated use of rodenti-cides can be deleterious to non-target native species and the environment (Hoare and Hare 2006; Pitt et al. 2015; Duron et al. 2017) and lead to rat resistance to toxins (e.g. King et al. 2011) or objections from individuals or organizations concerned about tox-icity issues. Therefore, selective lethal trapping may be considered as a more ecological-ly-friendly option, and in areas where the use of rodenticides is unlawful or not accept-ed by local communities, the only viable management approach (Ogden and Gilbert 2008). While control by trapping has proven successful to suppress rodent numbers to low densities in a short-term commitment (Stokes et al. 2009; King et al. 2011; Pender et al. 2013), we believe that there is a scope for optimise rodent trapping strategies in order to enhance project sustainability and achieve long-term ecological outcomes.
In the South Pacific archipelago of New Caledonia, Black and Pacific rats (Rattus
rattus and R. exulans) are among the main predators of endemic and micro-endemic
species in the dense evergreen rainforests (Thibault et al. 2017; Duron et al. 2019). As eradication of the 15 971 km² main island, which is inhabited and composed by com-plex ecosystems, is not currently practical, rat population control in targeted areas over prolonged periods represents a candidate option to restore native ecosystems. Most of the pristine remnants of New Caledonian rainforests lie in remote, mountainous areas, which renders the logistics of achieving effective management over significant spatial scales highly challenging. Although poisoning should have been the most cost-effective option in this context (Russell et al. 2008), in New-Caledonia, local native Kanak communities as well as local communities descending from European settlers, and local environment NGOs, have expressed strong disapproval regarding the use of poisoning for invasive species control due to the risk of toxicity to bushmeat, fish or drinking water (Cassan JJ, Northern Province Environmental Service, pers. comm.; see also Groseil 2010). Given these legitimate concerns, local communities and NGOs have expressed their interest in an ecologically-based rat management program that involves mechanical trapping without rodenticide application. Rat populations dwelling in the mountainous rainforests of New Caledonia have not been studied in depth (Rouys and Theuerkauf 2003; Thibault et al. 2017). Therefore, their biology and population dynamics need to be better understood if cost-effective, sustainable management strat-egies are to be developed in these pristine remnants of rainforest biodiversity hotspot.
Our study aimed at evaluating the effectiveness of mechanical trapping for main-taining rat numbers at low levels using a study site in a remote montane rainforest of New Caledonia as a case study. We combined a capture-mark-recapture (CMR) study with a small-scale (5.5 ha) intensive lethal trapping experiment to i) estimate rat densities and home ranges across species, sex, age and seasons; ii) assess the effects of a knock-down removal trapping experiment on the rat population structure; and iii) identify trapping grid layouts that maximise rat capture probability, given work-force availability constraints, using simulation models parameterized with rat popula-tion parameters derived from CMR data. This work will help conservapopula-tion managers make evidence-based decisions for the management of invasive species.
Methods
Study site
This study was conducted in a dense evergreen rainforest located between 550 and 950 meters a.s.l. in the wilderness reserve of Mont Panié (20°37'30"S, 164°46'56"E, 5400 ha) in New Caledonia, South Pacific (Fig. 1). This area has been protected since 1950 on the basis of the cultural importance of Mont Panié and the high micro-endemism rates observed for most taxa (plants, insects, reptiles) (Tron et al. 2013). The climate is moist subtropical, with a hot season between December and mid-April and a cool season between mid-May and September. Mean annual precipitations in the Mont Panié region are around 3 000–4 000 mm, while mean temperatures range from about 18 °C to 25 °C throughout the year, and minimum temperatures can ap-proach 0 °C (Tron et al. 2013). Two invasive rat species, Rattus rattus and R. exulans, are present in the study area. R. exulans was introduced in New Caledonia by the first Austronesian colonisers ca. 3 000 years ago, while R. rattus was introduced later by European settlers ca. 150 years ago (Beauvais et al. 2006). Both rat species are om-nivorous, eating mainly plants, invertebrates and, to a lesser extent, Squamata, with
R. rattus being more frugivorous and R. exulans more omnivorous (Duron et al. 2019).
Field sampling
Rat capture-mark-recapture (CMR)
Rats were live-trapped between September 2014 and September 2015 in the vicinity of the small removal area described below, in order to i) study rat population dynam-ics within the CMR area, and ii) monitor possible movements between both CMR and removal areas in response to ongoing lethal trapping in the adjacent removal area. Ninety-six standard wire cage rodent live-traps (with spring door) were set 20 m apart on a 12 × 8 trapping grid (3.08 ha, Fig. 1). Six CMR sessions (of five to eight consecu-tive days each) were conducted during the periods of 28 September-02 October 2014 (session 1), 26 November-02 December 2014 (session 2), 18–23 March 2015 (session 3), 21–26 May 2015 (session 4), 4–10 July 2015 (session 5) and 02–09 September 2015 (session 6). Traps were baited with fresh coconut chunks and checked every morning. Bedding material and leaf roof were provided to reduce mortality due to occasional rainy and cold conditions. Newly captured individuals were individually marked with small subcutaneous PIT-tags (type Tiny chip iso 1.4 × 8 mm size; Biolog-id, Paris, France). Each new individual was identified to species, sexed, weighed to the nearest 2.5 g, and checked for sexual maturity (females: perforate vagina and teat development status, males: presence of a scrotal sac). Since most black rat individuals weighing > 120 g and most Pacific rat individuals weighing > 55 g were sexually mature (respectively 94% and 98%, based on autopsies; n = 166), body mass was used as a proxy for rat sexual maturity.
Small-scale rat removal trapping
Rat removal trapping was performed between May and November 2015 in a 5.5-ha forest area immediately adjacent to the CMR trapping grid (Fig. 1) in order to 1) as-sess the effectiveness of lethal trapping in maintaining rat populations at low densities, and 2) study the reinvasion process over time. Rats were caught with the “Snap E Rat Trap” (Kness Mfg. Co., Albia, IA, USA) set 20 m apart on a 460 × 180 m trapping grid (5.5 ha). As the grid was crossed by a river, a total of 209 snap traps were set up (Fig. 1). Four lethal trapping sessions took place in 2015: 28 May-05 June (9 nights), 11–15 July(5 nights), 08–12 September (5 nights) and 28 October-01 November (5 nights). Traps were baited with coconut chunks and checked at sunrise. Animals caught were identified to species, sexed, weighed, and classified as adults or juveniles (as for the CMR experiment). We also recorded individuals that had previously been PIT-tagged, indicating movements between the CMR and removal grids.
Data analysis
Rat population densities and home ranges inferred from spatially-explicit capture recapture
Rat densities, home ranges and movements were estimated with spatially-explicit cap-ture-recapture (SECR) analysis (Efford 2004; Borchers and Efford 2008). SECR was shown to outperform other methods for estimating density, and is preferable when capture probabilities are low (Blanc et al. 2013; Ivan et al. 2013). The number of range centers in an arbitrary area is Poisson-distributed, and range centers are independent and identically distributed uniform random variables. The probability of capturing an Figure 1. Location of the study area in the Pacific, northern New Caledonia. The study was conducted
in Mont Panié montane rainforest on two adjacent 20 × 20 m trapping grids: a capture-mark-recapture (CMR) grid (96 live-traps) and a removal trapping grid (209 snap-traps).
animal at a particular trap location is assumed to be a half-Gaussian function of the Euclidian distance between the range center and the trap location, and is defined by two parameters: g0 or the probability of capture at the center of the home range, and
σ or the distance to inflection point of the half-normal function describing the decay
of capture probability with distance from an individual’s notional home range center. Models were fitted by maximising the full likelihood over all individuals observed, and by implementing a 60 m buffer (3 × root pooled square variance; Efford 2004) around the trapping area. Accidental deaths (n = 42) during CMR trapping and PIT-tagged individuals killed in the removal area (n = 17) in May and July were accounted for in capture histories, with recapture probability fixed at 0 following death. As no general likelihood adjustments are currently available for single-catch devices, we implement-ed a multi-catch device likelihood, which appears only slightly biasimplement-ed for single-catch data (Efford et al. 2009). We explored differences in g0 and σ between rat species, age and sex categories, and between trapping sessions. We also tested for changes in σ in response to the rat removal experiment in the immediate vicinity of the CMR grid, which began in May 2015, following the fourth CMR session.
Our dataset did not allow to test for the effect of individual sessions, rat species and age classes on σ due to limited numbers of rat recaptures within each group cat-egory. We therefore grouped some sessions and individual categories together based on similarities in the shape of the raw data distribution, as well as environmental seasonality. As a result, sessions 1, 2, 6 (austral summer; n = 44 recaptures) and sessions 3, 4, 5 (austral winter; n = 160 recaptures) were merged, and each rat was assigned to one of the four following groups: R. exulans (n = 38), R. rattus juveniles (n = 68), R. rattus adult males (n = 52), R. rattus adult females (n = 46). Due to the limited number of data points, we did not test for interactions between covariates in SECR models.
Our final model combination allowed for testing the effects of a learned response to trapping, species, age, sex, session as well as group of sessions and group of individu-als on g0; and group of sessions, group of individuals and rat removal efforts on σ. The best model was selected by comparing AICc of all defined models (Hurvich and Tsai 1989). Significant effects were identified by investigating model outputs (parameter estimates and their 95% confidence intervals). From the best SECR model, we de-rived rat density estimates for each group of sessions and group of individuals. Then, based on estimated σ and using the quantities of a circular Gaussian distribution, we calculated the 95% and 50% probability density areas of detection as surrogates for rat home range (HR95) and home range core area (HR50), as follows (see e.g. Ringler et al. 2014 for a Hazard function):
HR95= π × (2.45 × σ)² HR50= π × (1.18 × σ)²
All the analyses described above were performed with the R package ‘secr’ 4.3.1 (Borchers and Efford 2008; Efford 2020) in R version 4.0.3.
Effects of the rat removal experiment on rat population densities and structure Rat abundance (Abrat) in the removal area was estimated with the “Zippin removal” method, which assumes closed population within sessions and no heterogeneity in capture probability between individuals (Zippin 1958). Population densities before (Dbefore) and after (Dafter) removal were estimated for each session, species, sex and age:
Dbefore = Abrat / ETA Dafter = (Abrat – Nremoved)/ ETA,
with ETA (effective trapping area: 9 ha) estimated as the size of the removal area (5.5 ha) plus a boundary strip (132.4 m) of the radius of the average SECR-derived rat home ranges from this study (0.42 ha), and Nremoved the total number of rats killed during the trapping session. These analyses were performed with the R package ‘FSA’ (Ogle 2016) in R version 2.15.3.
Insights on reinvasion processes
We expected to observe a change in rat population structure in the removal area in response to the removal of a large number of resident individuals (Brown and Tuan 2005; King et al. 2011). To detect these potential changes, we compared the sex ratio, adult:juvenile ratio, average adult body mass and proportion of breeding individuals i) among the four removal trapping sessions, and ii) between the removal and CMR areas in sessions when both occurred subsequently (i.e. May, July and September 2015).
To detect temporal changes in spatial patterns of captures on the removal trapping grid, for each trapping occasion of each removal session we first calculated the average distance between trapping stations that had captured a rat and the nearest edge of the removal trapping grid (Distrats), and then compared Distrats to the average distance of the 209 traps to the nearest edge of the removal trapping grid (Disttraps = 29.28 m). We further expected that the home range centers of rats dwelling in the CMR area would shift towards the adjacent removal area in response to a sink effect. To test this hy-pothesis, from the best SECR model, we applied the fxi function in ‘secr’ (probability density function of home range center) to estimate, for each session, the home range center (HRC) coordinates of all rats recaptured at least once in the CMR grid (n = 27). We then calculated, for each individual, the barycenter of its HRC coordinates before and after removal had started. Differences in barycenter locations before/after removal were tested by performing a paired Samples Wilcoxon Test.
Simulation of capture probabilities and control effort
The aim of this modelling exercise was to identify the rat management strategies that would yield the highest probability of rat capture within a single trapping session while being economically viable and socially acceptable in the remote area of the Mont Panié
wilderness reserve. We simulated the capture probability of one individual rat for a range of contrasted grids layouts over 200 hectares (10 different layouts; Table 1). This grid size already had local stakeholder approval as a pilot management unit and was defined as a compromise between operational constraints and likely benefits to local biodiversity. Grid mesh size varied according to distance between transects (15, 25, 50, 75 or 100 m) and distance between traps (15, 25, 50 or 75 m). For each of the ten different grid layouts, we simulated 10 000 rat home range center locations assuming complete spatial randomness and calculated the cumulative probability of capture of one individual rat over n trapping days.
In the absence of competition, the probability of capture of one rat with home range center at location i by trap j at time t is defined as follows (Efford 2004):
2 2 2 0
(
)
ij d ijtP capt
g e
σ − =
where d is the distance between i and j, σ is the scale parameter of the detection func-tion and g0 is the probability of rat capture at trap location j. Parameters g0 and σ were
esti-mated from our best SECR model based on the specific wire cage type of rat live-trap used in this study (see Results section). Parameters g0 and σ are not known for snap traps; howev-er since rats can display neophobic behaviour (Clapphowev-erton 2006), g0 is likely to be lower for cage traps than for snap traps. With this simulation exercise, we used cage trap parameters as a pessimistic series of scenarios. It is worth noting that the proposed approach could be applied to other trapping methods and devices, and other study sites and settings, once key parameters such as capture probability and home range sizes are calibrated.
The probability that one rat would be captured by any one of the b traps of a given grid layout over a n-day trapping session (or cumulative probability) is then:
P(capt)ij = 1 − Πb
b=1 (1 − P(capt)ijt)n
To assess how trapping efficiency varied across grid layouts as the trapping ses-sion progresses, we calculated the cumulative rat capture probability against time and project expenditure for each of the ten different grid layouts for one single trapping session. We estimated the average number of hours required to do a complete coverage of each grid over the entire trapping session, accounting for the decline in the number of rats captured as the trapping session progressed. The average time required to check and bait each trap was taken as 37 seconds, estimating that an empty trap that only needs rebaiting would take 30 s, and a trap where a rat had been captured would take 60 s. Based on our own field experience, we considered that it would take 10 minutes to walk 100 m through the rainforest while looking for traps. We constructed our simulation models based on the reasonable assumptions that a maximal number of 10 people would be willing to be away from their own villages for no more than 15 days, and each person would be willing to work 4 hours daily(fieldwork is rough and physically demanding) for a wage of 10 euros per hour. Our model accounted for a non-linear increase in project expenditure as the trapping session progresses, due to
some additional helicopter provisioning required every 15 days in this remote part of New Caledonia (provisioning costs for 10 people and 15 days were set to be 6 000 euros). Trapping equipment and grid cutting were not accounted for in the simula-tions as they would need to be costed separately, for example as initial investments (i.e. before the first trapping session commences) and running costs (i.e. maintenance) over multiple sessions.
Given economic and social constraints (i.e. 10 trappers available for 4 hours/day), some of the 200-ha layouts (i.e. with the finest mesh sizes) could not be completed within one day. In our calculations, we therefore allowed the grids to be trapped as ad-jacent separate management units (e.g. layout 1 was treated as 8 smaller units of 25 ha), each unit being trapped at a time. This strategy inevitably required extending the over-all trapping session by n times (n = number of management units). We assumed rat movements from non-controlled to controlled units to be minimal within this small temporal window (8 days maximum; see Table 1). Our calculations also accounted for initial baiting time and costs (people work to deploy and bait the traps but no rats are captured). Table 1 presents grid characteristics, and the number of people, hours and splits required to completely cover each grid as part of one trapping occasion.
Code and data for the CMR analysis and simulations are available at https:// github.com/TCornulier/DuronRodentControl.
Results
Rat population densities and home ranges inferred from spatially-explicit cap-ture recapcap-ture
The best SECR model had 29.81% relative support and included the effects of group of individuals and session on g0, and group of individuals on σ (Table 2). The Table 1. Characteristics of the ten different removal trapping layouts tested in our simulation exercise.
These calculations account for local social constraints in the Mont Panié area (i.e. 10 people available for 15 days and willing to work 4 hours a day).
Layout Dist. Transects Dist. Traps Nb. Traps Nb. Hours Nb. People Nb. Splits
1 15 15 8889 316.9 79 8 2 25 25 3200 169.6 42 5 3 25 50 1600 86.4 22 3 4 25 75 1067 58.7 15 2 5 25 100 800 44.9 11 2 6 50 50 800 78.2 20 2 7 50 75 533 53.3 13 2 8 50 100 400 40.8 10 2 9 75 75 356 51.4 13 2 10 75 100 267 39.4 10 1
Abbreviations: Dist. Transects: distance in meters between trapping grid transects; Dist. Traps: distance in meters between traps; Nb. Traps: number of traps used in each trapping layout; Nb. Hours: number of hours required to complete each grid as part of one trapping occasion; Nb. People: number of people required to complete each grid as part of one trapping occasion; Nb. Splits: number of splits required to complete each grid given number of people available.
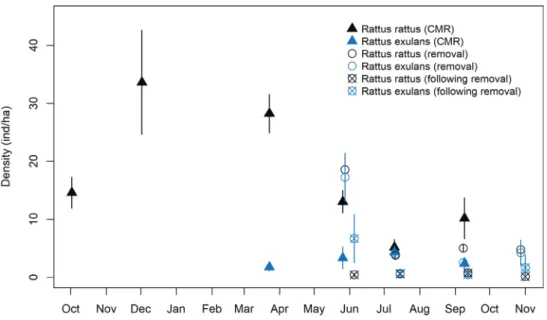
probability of capture g0 was significantly lower for adult male R. rattus and higher for juvenile R. rattus than for R. exulans, whereas there was no significant differ-ence in g0 between adult female R. rattus and R. exulans (Table 3). Moreover, g0 was significantly lower for CMR sessions 2 (December 2014) and 6 (September 2015) than for session 1 (September 2014; Table 3). Parameter σ was significantly lower for juvenile R. rattus than R. exulans, and higher for adult male R. rattus than R. exulans (Table 3, 4). Rat densities varied greatly across CMR sessions, from 9.48 ± 1.84 ind. ha-1 in July 2015 to 33.61 ± 9.00 ind.ha
-1 in November–December 2014 (Fig. 2). R. rattus adult densities were higher for females than for males during the three first
capture sessions and similar during the three last ones (see Suppl. material 1) R. rattus juvenile densities markedly increased from CMR session 1 (September 2014: 0.27 ± 0.27 ind.ha-1) to sessions 2 and 3 (December 2014: 8.74 ± 2.74 ind.ha-1; March 2015: 9.94 ± 1.68 ind.ha-1) and dropped again to low levels (< 4 ind.ha-1) from session 4 to 6 (May to September 2015) (see also Suppl. material 1). No R. exulans was captured during the first two CMR trapping sessions. R. exulans were first live-trapped during session 3 (March 2015) and their densities remained stable over the three following sessions (Fig. 2; see also Suppl. material 1). Home range sizes (HR95 and HR50) were on average three times as large for R. rattus adult males as for R. rattus adult females (Table 4).
Effects of removal trapping on rat population density and structure
While nine trapping days were required to approach a near zero capture rate dur-ing removal session 1 (10 rats were captured at day 9 out of 209 traps), this rate was achieved after only two or three trapping days during the subsequent removal sessions. Rat density at the start of our removal experiment (Dbefore: May 2015) was estimated at 32.1 ind.ha-1 (Fig. 2; see also Suppl. material 2). When comparing to the densities Table 2. Selection of the 10 best spatially explicit capture recapture (SECR) models. Model selection for
effects of individual groups (indgr), session, group of session (sessgr), age, sex and learned response (b) on the probability of capture at the center of the home range (g0) and on the scale parameter (σ). Note that although the effect of rat removal appeared in the second best model, this variable did not have any significant effect on sigma (β = -0.21, SE = 0.16, LCI = -0.52, UCI = 0.10).
g0 σ N parameters Log likelihood AICc % Weight
indgr + session indgr 13 -2046.78 4120.64 29.81% indgr + session indgr + removal 14 -2045.91 4121.06 24.20% age + session indgr 11 -2049.55 4121.87 16.09% indgr + session indgr + sessgr 14 -2046.77 4122.77 10.28% age + sex + session indgr 12 -2049.18 4123.27 8.01% age + session indgr + sessgr 12 -2049.55 4124.01 5.51% b + indgr + session indgr + sessgr 15 -2046.50 4124.43 4.48% b + species + age + session indgr + sessgr 14 -2049.44 4128.12 0.7%
age + session sex 9 -2060.66 4139.84 0
before each removal session (Dbefore: 32.11–7.78 inds.ha-1), lethal trapping achieved a 80–93% reduction in rat density after each of the four subsequent sessions (Dafter: 0.56–2.56 ind.ha-1) and allowed maintaining low numbers throughout a trapping pe-riod of seven months (Fig. 2, see Suppl. material 2). Densities of the two rat species remained constant from July to November 2015 (Fig. 2). A higher R.exulans:R.rattus ratio was observed in the removal area as compared to the CMR area in May and September 2015 (Table 5).
Table 3. Beta parameter estimates for the best SECR model (g0 ~ indgr + session, σ ~ indgr), with standard errors (SE) and 95% lower and upper confidence intervals (LCI and UCI). Rr: Rattus rattus and Re: R.
exulans. β SE 95% LCI 95% UCI g0 -1.98 0.34 -2.65 -1.31 g0.indgr (Rr-juveniles) 0.69 0.33 0.05 1.33 g0.indgr (Rr-adult-males) -0.78 0.30 -1.37 -0.18 g0.indgr (Rr-adult-females) -0.28 0.34 -0.94 0.38 g0.session 2 -1.57 0.36 -2.27 -0.86 g0.session 3 -0.16 0.25 -0.65 0.32 g0.session 4 0.22 0.26 -0.28 0.72 g0.session 5 0.00 0.33 -0.63 0.64 g0.session 6 -1.33 0.41 -2.13 -0.53 σ 2.70 0.10 2.50 2.90 σ.indgr (Rr-juveniles) -0.29 0.12 -0.52 -0.06 σ.indgr (Rr-adult-males) 0.29 0.12 0.05 0.54 σ.indgr (Rr-adult-females) -0.17 0.13 -0.42 0.07 Figure 2. Density of rats (± SE) in the study area from October 2014 to November 2015. Densities
were estimated from the best SECR model (g0 ~ indgr + session, σ ~ indgr) in the CMR area and from the
Insights on reinvasion processes
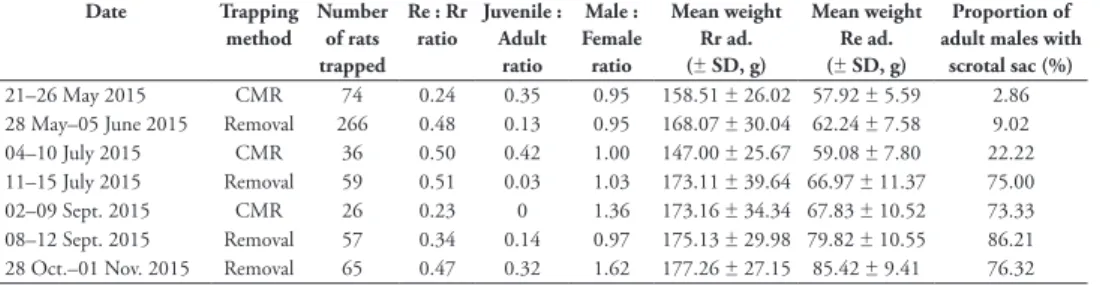
During the last four trapping sessions (May to November 2015), contrasted patterns of rat juvenile proportions were observed between the CMR and removal areas (Table 5): in the CMR area, juveniles were recorded in highest numbers in May and July and then dropped to zero in September, while in the removal area, juveniles were recorded in lowest numbers in May, July and September before reaching highest numbers in November. Sex-ratios were balanced during May and July, but biased towards males both in September in the CMR area and in November in the removal area (Table 5). Heavier adult R. rattus and R. exulans were generally found in the removal area than in the CMR area (Table 5). The proportion of males with well-developed scrotal sacs increased earlier in the removal area (75% in July; Table 5).
In the removal area, average distances of trapped rats to the edge of the trapping grid (Distrats) fluctuated greatly during the four removal sessions. In July, six weeks after removal trapping had been initiated, most rats were captured near the edge of the removal trapping grid (Distrats ± SD = 11.98 ± 10.34 m), whereas in May, September and November, rat captures were distributed more evenly within the removal grid (Distrats = 19.98 ± 7.55 m; 31.81 ± 8.04 m; 22.79 ± 2.24 m, respectively; see also Suppl. material 3). A total of 27 individuals were captured in the CMR area at least once before and once after the beginning of the removal experiment. The barycenters of Table 4. Estimation of σ (m), 95% kernel home range (HR95, ha) and home range core area (HR50, ha). These estimations were performed for the four groups of individuals: R. exulans, R. rattus juveniles,
R. rattus adult males, R. rattus adult females. σ was estimated from the following SECR model: g0 ~ indgr + session, σ ~ indgr. HR95 = π x (2.45 × σ)² and HR50 = π x (1.18 × σ)².
Group of individuals σ HR95 HR50
mean range mean Range mean range
R. exulans 14.87 12.22–18.10 0.42 0.28–0.62 0.09 0.06–0.14 R. rattus juveniles 12.46 10.72–14.48 0.29 0.22–0.40 0.07 0.05–0.09 R. rattus adult males 19.97 17.31–23.04 0.75 0.57–1.00 0.17 0.13–0.23 R. rattus adult females 11.05 9.75–12.51 0.23 0.18–0.30 0.05 0.04–0.68 Table 5. Rat population characteristics in both the rat removal and CMR trapping grids. These
charac-teristics are given for the last four sessions of capture. Rr ad : Rattus rattus adults; Re ad : R. exulans adults.
Date Trapping
method Number of rats trapped
Re : Rr ratio Juvenile : Adult
ratio Male : Female ratio Mean weight Rr ad. (± SD, g) Mean weight Re ad. (± SD, g) Proportion of adult males with
scrotal sac (%)
21–26 May 2015 CMR 74 0.24 0.35 0.95 158.51 ± 26.02 57.92 ± 5.59 2.86 28 May–05 June 2015 Removal 266 0.48 0.13 0.95 168.07 ± 30.04 62.24 ± 7.58 9.02 04–10 July 2015 CMR 36 0.50 0.42 1.00 147.00 ± 25.67 59.08 ± 7.80 22.22 11–15 July 2015 Removal 59 0.51 0.03 1.03 173.11 ± 39.64 66.97 ± 11.37 75.00 02–09 Sept. 2015 CMR 26 0.23 0 1.36 173.16 ± 34.34 67.83 ± 10.52 73.33 08–12 Sept. 2015 Removal 57 0.34 0.14 0.97 175.13 ± 29.98 79.82 ± 10.55 86.21 28 Oct.–01 Nov. 2015 Removal 65 0.47 0.32 1.62 177.26 ± 27.15 85.42 ± 9.41 76.32
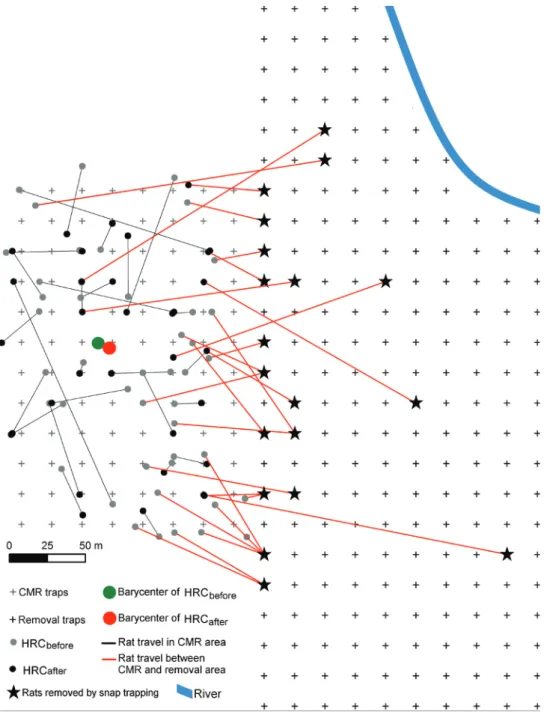
Figure 3. Estimated barycenters of home range centers (HRC) of rats recaptured in the CMR grid. Only
HRC of rats recaptured at least once in the CMR grid (n = 27), before (HRCbefore) and after (HRCafter) rat removal had been initiated are presented here. Grey and black dots represent individual rat HRC bar-ycenters before and after removal, respectively, while green and red filled circles represent the average HRC barycenters across individuals before and after removal, respectively. Twenty-seven other individuals first captured in the CMR area were recaptured in snap-traps in the removal area (red lines and black stars).
their home range center coordinates did not significantly shift towards the adjacent re-moval area in response to rat rere-moval (X-axis barycenter coordinates, Z = 198, p = .84; Y-axis barycenter coordinates, Z = 257, p = .11) (Fig. 3). Furthermore, although rat control efforts appeared in the second best SECR model, this variable did not have any significant effect on σ (β = -0.21, SE = 0.16, 95%CI = [-0.52–0.10]) (Table 2).
A total of 27 rats equipped with PIT-tags in the CMR area were recaptured in the removal area over the course of the study (Fig. 3; see Suppl. material 4): 6 R. exulans (3 females: 1 adult and 2 juveniles, and 3 adult males) and 21 R. rattus (12 females: 8 adults and 4 juveniles, and 9 adult males). On average, adult male R. exulans and juvenile female R. rattus were the individual categories that travelled the longest dis-tances, with respectively 138.30 ± 79.28 m and 145.01 ± 69.12 m travelled. Nineteen individuals travelled between 50 and 100 m and only six travelled > 100 m before be-ing recaptured in the removal area. The longest distance was travelled by a R. exulans adult male (203.78 m in one day, from the CMR to the removal area).
Simulated scenarios of control effort
To simulate scenarios of removal efficiency relative to trapping session duration and pro-ject expenditure, we used the average value of parameters g0 (0.09) and σ (14.6 m) specifi-cally estimated for our wire cage type of rodent live-trap, based on the best SECR model. With this simulation exercise and set of parameter values, we intend to demonstrate the usefulness of the proposed approach to compare the cost-effectiveness of plausible rodent management scenarios; however the approach could be easily adapted to other study systems, once key parameters are estimated for the relevant species and trapping devices.
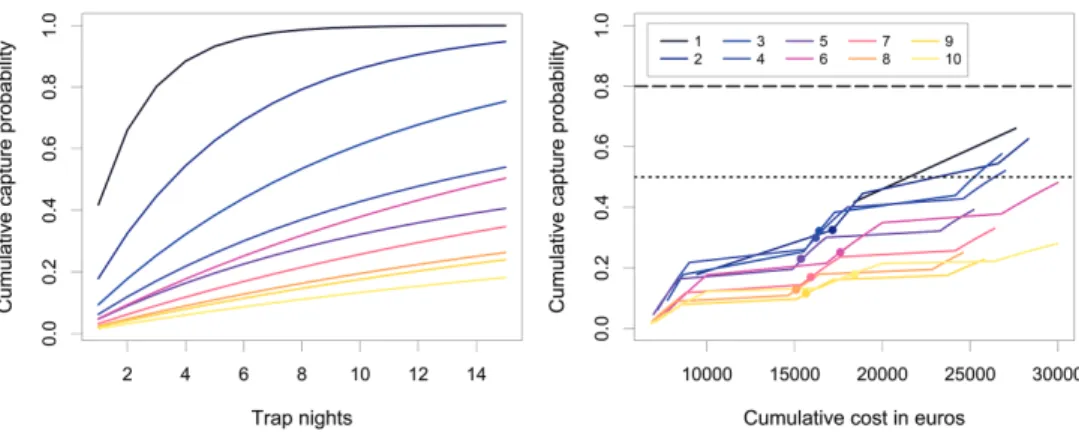
If we were to ignore local social and economic constraints and assume that each trapping grid could be completely covered within one day, two grid layouts would allow achieving a cumulative rat capture probability ≥ .80 after 15 trapping days (Fig. 4A): layout 1 (15 × 15 m; 1.00) and layout 2 (25 × 25 m; .95), while three other grid layouts would achieve a cumulative capture probability ≥ .50: layout 3 (25 × 50 m; .75), layout 4 (25 × 75 m; .54) and layout 6 (50 × 50 m; .50). In our models, splitting the 200-ha grid into smaller adjacent management units allowed accomodating for these constraints, but in the meantime this strategy faced the risk of being too costly if trapping was carried out for a long period. Interestingly, however, when plotting the cumulative capture probability against cumulative project expenditure (in euros) over a theoretical scenario of 10 persons trapping over 30 days, it became apparent that the highest gain:cost ratio was achieved by layout 1 (.66: 24 900), layout 3 (.57: 22 700) and layout 2 (.63: 25 980) (Fig. 4B). Under this scenario, none of the ten different lay-outs reached a cumulative capture probability of .80. Given the local social constraints of 10 persons available for 15 days and 4 daily working hours per person, layouts 3 and 4 appeared to be the most cost-efficient, with a cumulative capture probability > .30 for a total cost < 17 200 euros (Fig. 4B). It is to be noted, however, that as layout 1 would require a total of 8 days to complete the initial baiting, this strategy could not be implemented if trappers were only available for 15 days.
Discussion
This study demonstrates that mechanical trapping can help maintain rat densities at low levels on a 5.5-ha area despite challenging environmental, logistical and social conditions. Combining live and lethal trapping experiments over 15 months in New Caledonian rainforest habitats has provided us with essential baseline rat biological parameters to inform effective management planning in tropical montane forests. Our cost-effectiveness analysis of trapping efforts also contributes to increase the evidence base that is currently lacking for improving the efficiency of rodent control projects and provides useful practical guidelines to practitioners involved in community-based pest management (Duron et al. 2017).
Rat population densities and home ranges in a tropical montane forest of New Caledonia
Rat population biology and dynamics on tropical rainforest islands remain less well understood than in other systems. Our CMR study showed great seasonal variation in rat densities, with a marked peak of ca. 34 ind.ha-1 during the austral summer that Figure 4. Cumulative rat capture probability over 15 trap-nights and their associated cumulative costs. A cumulative rat capture probability over 15 trap-nights for each of the 10 different grid layouts assessed
in this study. Layout 1: 15 × 15 m; layout 2: 25 × 25 m; layout 3: 25 × 50 m; layout 4: 25 × 75 m; layout 5: 25 × 100 m; layout 6: 50 × 50 m; layout 7: 50 × 75 m; layout 8: 50 × 100 m; layout 9: 75 × 75 m; layout: 10 = 75 × 100 m (see full details of grid layouts in Table 1). Note that the asymptote for some of the sparser grids is < 1 (not shown) B cumulative rat capture probability against cumulative cost of the operations over a hypothetical maximum of 30 work-days per session. Dotted lines represent arbitrary capture probability thresholds (.50 and .80) to help read and interpret the figure. Dots mark the maxi-mum effort available within the local constraints that apply in the wilderness reserve of Mont Panié, which is 10 persons working 4 hours a day for up to 15 consecutive days. Note that layout 1 (15 × 15 m) cannot be achieved in 15 days since a complete coverage of the grid with 10 people requires 8 splits and a total of 16 days (1 day for baiting plus 1 day to complete one trapping occasion, for each split).
dropped three times lower in winter. In another study conducted in a New Caledonian lowland rainforest, rat densities were estimated at ca. 25 ind.ha-1 in winter (Brescia 2011). Overall, rat densities in New Caledonia appear relatively high compared to av-erage densities recorded in an Hawaiian mesic forest – R. rattus: 7.1 ind.ha-1; R. exulans: .3 ind.ha-1 (Shiels 2010); or in a low altitude New Zealand temperate forest – R. rattus: 6.2 ind.ha-1 (Hooker and Innes 1995). By contrast, very high black rat densities (up to 65 ind.ha-1 in summer) have been observed in the dry tropical forests of Europa Island in the Indian Ocean (Russell et al. 2011). In our study, black rat densities fluctuated seasonally, as observed elsewhere in the tropics, probably also in response to seasonal changes in food availability (Harris and Macdonald 2007; Russell et al. 2011). By contrast, densities of Pacific rats remained lower throughout our study, ranging from 0 to 4.3 ind.ha-1, although a peak of ca. 17 ind.ha-1 was detected in the first removal trapping session (May-June 2015). This pattern could be explained by negative inter-specific interactions (e.g. Russell et al. 2004), in particular the competition release of Pacific rats from the removal of black rats over the course of the nine-day removal ses-sion, as indicated by the steady increase in Pacific rat capture rates as Black rat capture rate decreases. Some level of competition for traps may have occurred between species but given that trap saturation was relatively moderate in our CMR grid (average suc-cessful traps per session = 57.6%), it is unlikely that competition risk solely explains the observed differences in density between species.
In our study conducted in the Mont Panié wildnerness reserve, black rat home ranges varied between .2 and .7 ha according to age and sex. This is much smaller than what was found in a Hawaiian mesic forest (3.8 ha; Shiels 2010), but more similar to the dry forest habitats of Juan de Nova and Europa Islands in the Indian Ocean (from .3 to .8 ha) (Ringler et al. 2014). Rat home range size is expected to vary widely in space and time in relation to in situ rat densities and the intensity of competitive interactions, the underlying food resource availability, and the timing of rat breeding season (Russell et al. 2011; Harper and Bunbury 2015; Harper et al. 2015). In our study, home ranges did not vary significantly across seasons, despite large temporal variations in rat densi-ties. However, it is possible that we could not detect any seasonal variation in home range sizes due to insufficient recapture data by session. Care should be taken, however, when comparing home range size estimated from spatially-explicit capture-recapture and telemetry location data due to methodological differences and/or sampling error (Nathan 2016). Although SECR-derived σ has been shown to underestimate telemetry-based home range radius, it still remains a useful estimate of space use as it concurrently incorporates movement and rat-trapping device interaction behaviours.
Effects of a seven-month rat removal experiment on rat population densities in the Mont Panié wilderness reserve
Controlling rats for 5–9 consecutive nights every five to seven weeks over a 5.5-ha area (on a 20 × 20 m trapping grid) allowed reaching an initial 16-fold density de-crease (from 32.1 to 2.6 rats.ha-1), followed by a five to fourteen-fold decrease (down to
0.6–1.6 rats.ha-1) after the following sessions, with densities going back to pre-removal levels (ca. 8 rats.ha-1) in-between sessions. This indicates that trapping every five to seven weeks is not sufficient to reach near zero rat densities in the Mont Panié area. In a mesic forest in Hawaii, rat removal efforts deployed over a 26-ha area (25 × 50 m grid with trap spacing of 12.5 m; traps checked daily for two weeks, then every two weeks) allowed maintaining rat numbers ca. 3 times lower (ca. 1 rat/100 trap.night) than the initial pre-removal state, and was shown to enhance the reproduction of an endangered endemic plant Cyanea superba subsp. superba released from rat predation pressure (Pender et al. 2013). In Australia, a rat removal experiment conducted with live traps (first intensively for two months; then with three-days-long capture sessions every 4–8 weeks) main-tained black rat densities 3.3 times lower (3.7 ind.ha-1) than untreated sites, and was associated with a substantial increase in the populations of native rat R. fuscipes (Stokes et al. 2009). These examples, with many others, show that rat control operations can be highly beneficial for native biodiversity (Duron et al. 2017), although the optimal level of management required to ensure the long-term persistence of vulnerable prey is often not known. Monitoring native biodiversity while supressing rat numbers would help identify rat density thresholds below which positive effects on biodiversity can be detect-ed, and test whether maintaining rat densities around 8 inds.ha-1 in the Mont Panié area would be enough to protect the most vulnerable native species. In addition to improv-ing the knowledge base, monitorimprov-ing how native systems respond to the removal of alien predators is crucial in order to detect unexpected outcomes (Ruscoe et al. 2011; Walsh et al. 2012) and may help convince both funding bodies and participating local com-munities of the relevance of continuing the operation (Ferraro and Pattanayak 2006).
Insights on rat reinvasion processes
A reduction in rodent abundance may be followed by a rapid reinvasion, induced by enhanced immigration and/or increased breeding and survival of remaining adults and juveniles (Innes et al. 1995; Gundersen et al. 2001; King et al. 2011; Hansen et al. 2020). In New Zealand, following the eradication of eight forest fragments averaging 5.3 ha in size, black rats were shown to travel up to 600 m in a few days and reinvade cleared areas very quickly despite large areas of intervening non-preferred habitat (King et al. 2011). In a Vietnamese farming system, the populations of Rattus argentiventer and R. losea were shown to respond to pest control mainly through an increase in re-cruitment, immigration and survival of residents, but not through enhanced breeding productivity (Brown and Tuan 2005). A recent study conducted on black rats in Aus-tralia showed that reinvasion of controlled areas was slow and occurred both through immigration and settlement by different categories of individuals: juveniles, adults or sub-adults without permanent home ranges, and individuals occupying neighboring areas expanding their home ranges (Hansen et al. 2020).
In our study, the level of control efforts applied (5–9 trapping days every 5–7 weeks) appeared to have prevented rapid, complete reinvasion of a 5.5-ha forest area. As our removal trapping only covered the austral winter, it is possible that reinvasion
rates would have been higher during the subsequent summer period. We found, how-ever, some evidence of rats travelling from the CMR area to the adjacent removal area already on the first removal trapping day, and then throughout the trapping pe-riod. Moreover, six weeks after the initial knock-down of the rat population, captures were mainly recorded along the edge of the removal area. Nevertheless, it remains unclear whether these scattered movements and spatio-temporal patterns of captures were driven by immigration, were a consequence of the expansion of existing home ranges in the adjacent CMR area, or simply reflect the higher capture probability of neighboring individuals dwelling in the near vicinity of the removal area. Our analyses of rat home range barrycenters and size (sigma) did not reveal any marked shift in space use nor any enlargement of home ranges within the trappable rat population of the CMR area in response to ongoing control efforts. Our data also suggest that some reestablishement may have been driven by density-dependent enhancement of breeding: a larger proportion of reproductively active males as well as young juveniles (R. rattus < 52 g) were detected at an earlier stage in the removal area (July 2015) compared to the CMR area. It is unlikely that these sex and age distribution patterns would have been explained by seasonal differences in trappabilities within individual rat groups since sex-and age-specific capture probabilities remained relatively constant over the course of the removal trapping experiment (see Suppl. material 2). Given the low numbers of rats captured in each of the three removal trapping sessions following the initial knock down, if enhanced breeding had occurred, it probably did not con-tribute to a substantial or sustained recovery of the controlled population.
Dispersal is commonly observed to be male-biased and principally realized by juve-niles in most rodent species, including Rattus spp. (Brown and Tuan 2005; King et al. 2011; Krebs et al. 2011). Had immigration occurred in our removal area, we did not find any evidence for male rats being involved in the recolonization process more than females: the sex ratio observed in the removal area remained fairly balanced and constant as control efforts progressed, except during the last removal trapping session, six months after the initial knock down, when males represented 60% of captures. In addition, we did not find any support for juvenile-driven dispersal: juvenile numbers were very low in the removal area during each of the four removal trapping sessions. Without further evidence on the movements and origins of the rats captured in controlled areas (inferred from e.g. genetic analyses, rhodamine-B marking experiments), it remains unclear as to what processes typically govern rat population reestablishment in such contexts.
Rat management recommendations
Our modelling exercise indicated that it is, in principle, realistic to control invasive rats over moderate-sized areas in challenging environments, using lethal trapping. For exam-ple, in the absence of local and economic constraints, a one-shot reduction in rat density of 93% was achievable over 200 ha on a 15 × 15 m grid in a total of 1585 work hours or 5 trapping days (and a 100% reduction in 3169 work hours or 10 trapping days) (see Fig. 4A). This represented 385 (if 93%) or 792 (if 100%) man-work-days for an approximate operational budget of 22.000–38.000 euros per trapping session,
assum-ing four workassum-ing hours per trapper per day. However, within the 150 man-work-days limit imposed by local workforces, none of the ten trapping grid layouts evaluated in this study could be practically implemented at the scale predefined by local stakeholders (200-ha pilot area). Treating the entire management area as smaller adjacent units that could be trapped in successive time stages was essential for achieving complete coverage. This strategy has been successfully implemented in the Scottish Outer Hebrides for the control of non-native American mink Mustela vison populations over large spatial scales (Macleod et al. 2019). While our simulations showed that splitting the entire manage-ment area would in theory enhance project feasibility, the limited workforce available in the Mont Panié wilderness reserve will inevitably hinder trapping effectiveness. Indeed, with 10 persons available for 15 days at a time, none of the grid layouts would achieve a cumulative rat capture probability higher than .30, which would probably not be sufficient to produce tangible benefits to native forest biodiversity. Alternative options to maximise removal efficiency may be to either reconsider the total size of the manage-ment area (e.g. 100 ha instead of 200 ha), if solely reliant on local workforces, or involve a few commited professional trappers to maintain a constant high trapping effort, al-though the latter would require additional financial resources over a protracted period of time. Other options include the use of self-resetting traps, which could be particular-ly useful in remote areas. The creation of “mainland islands” should also be considered as an alternative option to permanent rat removal, if and when resources to set up such an ambitious program are available. Ultimately, in areas where local workforce is limited and the use of aerial baiting is not accepted by the local communities, ensuring that the scale of management is fit for purpose is key to success. This decision should be based on the fine balance between maximising the use of available resources and achieving a cumulative capture probability that is meaningful for biodiversity targets.
With this study, we demonstrate that scenario modelling, informed by trapping experiments, is a flexible tool for informing the design of cost-effective control pro-grams of island-invasive rodent populations, under idiosyncratic local circumstances. Due to rats’ productivity and reinvasion rates, a one shot reduction in density is clearly not enough to produce tangible benefits to native biodiversity. Given the prospect of assessing optimal strategies for a sustainable rat control program, acquiring rat demo-graphic rates (productivity, survival, dispersal movements) will be helpful to explore finer components of trapping design (e.g. number of trapping sessions per season, year and habitat types) and inform on the most cost-effective trapping regime (how often to trap, for how long and where) in the long-term. While our modelling approach was developed for rats in the Mont Panié reserve, it could be easily adapted to other systems and invasive pest species that could be controlled by lethal trapping.
Acknowledgements
This study was funded by the Northern Province of New Caledonia to REFCOR pro-ject (Convention n° 12C240, 14C330 and 15C154). We are grateful to Josepho Bahor-mal, Hélène De Méringo, Oriana Garcia-Iriarte, Raphaël Gouyet, Matthieu Mativet,
Mathilde Méheut, Martin Thibault from IRD for their help in the fieldwork, and the University of Aberdeen for hosting a visit. We thank the team of Dayu Biik NGO, Alain Couhia, Ismaël Farino, Djaèk Folger, Ronald Tein, Aldo Tiempouène, Josine Tiavouane, Silvano Wanguène for field logistics and their help in the rat capture ex-periments. We also thank Frederic Rigault and Jérémy Anso for their help in preparing maps and figures, Murray Efford for support with the secr analyses, and Pablo Garcia Diaz for providing comments on a draft manuscript.
References
Armstrong DP, Gorman N, Pike R, Kreigenhofer B, Mcarthur N, Govella S, Barrett P, Richard Y (2014) Strategic rat control for restoring populations of native species in forest
frag-ments. Conservation Biology 28(3): 713–723. https://doi.org/10.1111/cobi.12256
Atkinson IAE (1985) The spread of commensal species of Rattus to oceanic islands and their effects on avifaunas. In: Moors PJ (Ed.) Conservation of island birds: Case studies for the management of threatened island species. Technical Bulletin No. 3. International Council of Bird Preservation, Cambridge, 35–81.
Beasley JC, Olson ZH, Beatty WS, Dharmarajan G, Rhodes OE (2013) Effects of culling
on mesopredator population dynamics. PLoS ONE 8: e58982. https://doi.org/10.1371/
journal.pone.0058982
Beauvais M-L, Coléno A, Jourdan H (2006) Invasive species in the New Caledonian archipelago.
IRD, Paris. http://www.documentation.ird.fr/hor/fdi:010039995 [Accessed 9 Nov 2015]
Blanc L, Marboutin E, Gatti S, Gimenez O (2013) Abundance of rare and elusive species: Empiri-cal investigation of closed versus spatially explicit capture-recapture models with lynx as a case
study. The Journal of Wildlife Management 77: 372–378. https://doi.org/10.1002/jwmg.453
Bomford M, O’Brien P (1995) Eradication or control for vertebrate pests? Wildlife society bulletin 23: 249–255.
Borchers DL, Efford MG (2008) Spatially explicit maximum likelihood methods for
capture-recap-ture studies. Biometrics 64: 377–385. https://doi.org/10.1111/j.1541-0420.2007.00927.x
Brescia F (2011) Ecology and population trends in new-Caledonian Placostylus snails (Mol-lusca: Gastropoda: Bulimulidae). PHD Thesis. Massey University, Palmerston North. Brown PR, Tuan NP (2005) Compensation of rodent pests after removal: control of two rat
species in an irrigated farming system in the Red River Delta, Vietnam. Acta Oecologica
28: 267–279. https://doi.org/10.1016/j.actao.2005.05.002
Chollet S, Martin JL (2013) Declining woodland birds in North America, should we blame
Bambi? Diversity and Distributions 19: 481–483. https://doi.org/10.1111/ddi.12003
Clapperton BK (2006) A review of the current knowledge of rodent behaviour in relation to control devices. Science for Conservation 263, 55 pp.
Doherty TS, Ritchie EG (2017) Stop jumping the gun: A call for evidence-based invasive
pred-ator management. Conservation Letters 10: 15–22. https://doi.org/10.1111/conl.12251
Duron Q, Shiels AB, Vidal E (2017) Control of invasive rats on islands and priorities for future
Duron Q, Bourguet E, Thibault M, Scussel S, Gouyet R, Méheut M, Vidal E (2019) Sympatric invasive rats show different diets in a tropical rainforest of an island biodiversity hotspot.
Pacific Science 73: 199–214. https://doi.org/10.2984/73.2.2
Efford M, Warburton B, Spencer N (2000) Home-range changes by brushtail possums in
re-sponse to control. Wildlife research 27: 117–127. https://doi.org/10.1071/WR99005
Efford M (2004) Density estimation in live‐trapping studies. Oikos 106: 598–610. https://doi.
org/10.1111/j.0030-1299.2004.13043.x
Efford MG, Borchers DL, Byrom AE (2009) Density estimation by Spatially Explicit Capture-Recapture: likelihood-based methods. In: Thomson DL, Cooch EG, Conroy MJ (Eds) Modeling Demographic Processes In Marked Populations. Environmental and
Ecologi-cal Statistics, vol 3. Springer Science and Business Media, Boston, 255–269. https://doi.
org/10.1007/978-0-387-78151-8_11
Efford M (2020) Package “secr”: Spatially Explicit Capture-Recapture. R-Cran project. https://
cran.r-project.org/web/packages/secr/secr.pdf [Accessed 10 November 2020]
Ferraro PJ, Pattanayak SK (2006) Money for nothing? A call for empirical evaluation of
biodi-versity conservation investments. PLoS Biology 4: e105. https://doi.org/10.1371/journal.
pbio.0040105
Fletcher K, Aebischer NJ, Baines D, Foster R, Hoodless AN (2010) Changes in breeding suc-cess and abundance of ground-nesting moorland birds in relation to the experimental
de-ployment of legal predator control. Journal of Applied Ecology 47: 263–272. https://doi.
org/10.1111/j.1365-2664.2010.01793.x
Garrott RA, White PJ, Vanderbilt White CA (1993) Overabundance: an issue for
conserva-tion biologists. Conservaconserva-tion Biology 7(4): 946–949.
https://doi.org/10.1046/j.1523-1739.1993.740946.x
Goodrich JM, Buskirk SW (1995) Control of abundant native vertebrates for conservation of
endangered species. Conservation Biology 9: 1357–1364.
https://doi.org/10.1046/j.1523-1739.1995.09061357.x
Groseil C (2010) French Overseas Territories – New Caledonia: An island restoration contro-versy. In ‘PII News, Pacific Invasives Initiative: Auckland.
Gundersen G, Johannesen E, Andreassen HP, Ims RA (2001) Source–sink dynamics: how sinks
affect demography of sources. Ecology Letters 4: 14–21.
https://doi.org/10.1046/j.1461-0248.2001.00182.x
Hansen N, Hughes NK, Byrom AE, Banks PB (2020) Population recovery of alien black
rats Rattus rattus: A test of reinvasion theory. Austral Ecology 45: 291–304. https://doi.
org/10.1111/aec.12855
Harper GA, Bunbury N (2015) Invasive rats on tropical islands: Their population biology
and impacts on native species. Global Ecology and Conservation 3: 607–627. https://doi.
org/10.1016/j.gecco.2015.02.010
Harper GA, van Dinther M, Russell JC, Bunbury N (2015) The response of black rats (Rattus
rattus) to evergreen and seasonally arid habitats: Informing eradication planning on a tropical
island. Biological Conservation 185: 66–74. https://doi.org/10.1016/j.biocon.2014.11.044
Harris DB, Macdonald DW (2007) Interference competition between introduced black rats and
Hoare JM, Hare KM (2006) The impact of brodifacoum on non-target wildlife: gaps in knowl-edge. New Zealand Journal of Ecology 30: 157–167.
Hooker S, Innes J (1995) Ranging behaviour of forest-dwelling ship rats, Rattus rattus, and effects of poisoning with brodifacoum. New Zealand Journal of Zoology 22: 291–304.
https://doi.org/10.1080/03014223.1995.9518044
Hurvich CM, Tsai C-L (1989) Regression and time series model selection in small samples.
Biometrika 76: 297–307. https://doi.org/10.1093/biomet/76.2.297
Innes J, Warburton B, Williams D, Speed H, Bradfield P (1995) Large-scale poisoning of ship rats (Rattus rattus) in indigenous forests of the North Island, New Zealand. New Zealand Journal of Ecology 19: 5–17.
Ivan JS, White GC, Shenk TM (2013) Using simulation to compare methods for estimating
den-sity from capture-recapture data. Ecology 94: 817–826. https://doi.org/10.1890/12-0102.1
Jones HP, Holmes ND, Butchart SHM, Tershy BR, Kappes PJ, Corkery I, Aguirre-Muñoz A, Armstrong DP, Bonnaud E, Burbidge AA, Campbell K, Courchamp F, Cowan PE, Cuthbert RJ, Ebbert S, Genovesi P, Howald GR, Keitt BS, Kress SW, Miskelly CM, Op-pel S, Poncet S, Rauzon MJ, Rocamora G, Russell JC, Samaniego-Herrera A, Seddon PJ, Spatz DR, Towns DR, Croll DA (2016) Invasive mammal eradication on islands results in substantial conservation gains. Proceedings of the National Academy of Sciences 113:
4033–4038. https://doi.org/10.1073/pnas.1521179113
King CM, Innes JG, Gleeson D, Fitzgerald N, Winstanley T, O’Brien B, Bridgman L, Cox N (2011) Reinvasion by ship rats (Rattus rattus) of forest fragments after eradication.
Biologi-cal Invasions 13: 2391–2408. https://doi.org/10.1007/s10530-011-0051-6
Krebs CJ, Boonstra R, Gilbert S, Reid D, Kenney AJ, Hofer EJ (2011) Density estimation for small mammals from livetrapping grids: rodents in northern Canada. Journal of
Mammal-ogy 92: 974–981. https://doi.org/10.1644/10-MAMM-A-313.1
Lambin X, Burslem D, Caplat P, Cornulier T, Gabriella D, Fasola L, Fidelis A, García-Díaz P, Langdon B, Linardaki E, Montti L (2020) CONTAIN: Optimising the long-term man-agement of invasive alien species using adaptive manman-agement. NeoBiota 59: 119–138.
https://doi.org/10.3897/neobiota.59.52022
Lieury N, Ruette S, Devillard S, Albaret M, Drouyer F, Baudoux B, Millon A (2015) Compen-satory immigration challenges predator control: An experimental evidence-based approach
improves management. The Journal of Wildlife Management 79: 425–434. https://doi.
org/10.1002/jwmg.850
Macleod IA, Maclennan D, Raynor R, Thompson DBA, Whitaker S (2019) Large scale eradi-cation of non-native invasive American mink (Neovison vison) from the Outer Hebrides of Scotland. In: Veitch CR, Clout MN, Martin AR, Russell JC, West CJ (Eds) Island invasives: scaling up to meet the challenge. Occasional Paper of the IUCN Species Survival Commission N62. Gland, Switzerland, 261–266.
Medina FM, Bonnaud E, Vidal E, Nogales M (2014) Underlying impacts of invasive cats on islands: not only a question of predation. Biodiversity and Conservation 23: 327–342.
https://doi.org/10.1007/s10531-013-0603-4
Nathan H (2016) Detection probability of invasive ship rats: biological causation and manage-ment implications. PHD Thesis. University of Auckland, New Zealand.
Ogden J, Gilbert J (2008) Prospects for the eradication of rats from a large inhabited island: community based ecosystem studies on Great Barrier Island, New Zealand. Biological
In-vasions 11: 1705–1717. https://doi.org/10.1007/s10530-008-9398-8
Ogle D (2016) Package “FSA”: Simple Fisheries Stock Assessment Methods. R-Cran project.
http://archneur.jamanetwork.com/data/Journals/PSYCH/12561/archpsyc_51_1_002.pdf
[Accessed 9 June 2016]
Pender RJ, Shiels AB, Bialic-Murphy L, Mosher SM (2013) Large-scale rodent control re-duces pre-and post-dispersal seed predation of the endangered Hawaiian lobeliad, Cyanea
superba subsp. superba (Campanulaceae). Biological Invasions 15: 213–223. https://doi. org/10.1007/s10530-012-0280-3
Pitt WC, Berentsen AR, Shiels AB, Volker SF, Eisemann JD, Wegmann AS, Howald GR (2015) Non-target species mortality and the measurement of brodifacoum rodenticide residues after a rat (Rattus rattus) eradication on Palmyra Atoll, tropical Pacific. Biological
Conservation 185: 36–46. https://doi.org/10.1016/j.biocon.2015.01.008
Ringler D, Russell J, Jaeger A, Pinet P, Bastien M, Le Corre M (2014) Invasive rat space use on tropical islands: Implications for bait broadcast. Basic and Applied Ecology 15: 179–186.
https://doi.org/10.1016/j.baae.2014.01.005
Rouys S, Theuerkauf J (2003) Factors determining the distribution of introduced mammals in nature reserves of the southern province, New Caledonia. Wildlife Research 30: 187–191.
https://doi.org/10.1071/WR01116
Ruscoe WA, Ramsey DSL, Pech RP, Sweetapple PJ, Yockney I, Barron MC, Perry M, Nugent G, Carran R, Warne R, Brausch C, Duncan RP (2011) Unexpected conse-quences of control: competitive vs. predator release in a four-species assemblage of
in-vasive mammals. Ecology Letters 14(10): 1035–1042.
https://doi.org/10.1111/j.1461-0248.2011.01673.x
Russell JC, Towns DR, Clout MN (2008) Review of rat invasion biology: implications for island biosecurity. Wellington, Science & Technical Publishing [Dept. of Conservation. Russell JC, Ringler D, Trombini A, Corre M (2011) The island syndrome and population
dynam-ics of introduced rats. Oecologia 167: 667–676. https://doi.org/10.1007/s00442-011-2031-z
Shiels AB (2010) Ecology and impacts of introduced rodents (Rattus spp. and Mus musculus) in the Hawaiian islands. PHD Thesis. University of Hawai’i.
Smith RK, Pullin AS, Stewart GB, Sutherland WJ (2010) Effectiveness of predator removal for
enhancing bird populations. Conservation Biology 24: 820–829. https://doi.org/10.1111/
j.1523-1739.2009.01421.x
Stokes VL, Banks PB, Pech RP, Spratt DM (2009) Competition in an invaded rodent community re-veals black rats as a threat to native bush rats in littoral rainforest of south-eastern Australia.
Jour-nal of Applied Ecology 46: 1239–1247. https://doi.org/10.1111/j.1365-2664.2009.01735.x
Thibault M, Brescia F, Jourdan H, Vidal E (2017) Invasive rodents, an overlooked threat for skinks in a tropical island hotspot of biodiversity. New Zealand Journal of Ecology 41:
74–83. https://doi.org/10.20417/nzjecol.41.9
Thoresen JJ, Towns D, Leuzinger S, Durrett M, Mulder CPH, Wardle DA (2017) Invasive rodents have multiple indirect effects on seabird island invertebrate food web structure.
Towns DR, Atkinson IAE, Daugherty CH (2006) Have the harmful effects of introduced rats
on islands been exaggerated? Biological Invasions 8: 863–891. https://doi.org/10.1007/
s10530-005-0421-z
Tron FM, Franquet R, Larsen TH, Cassan JJ (2013) Evaluation rapide de la biodiversité du massif du Panié et des Roches de la Ouaième, province Nord, Nouvelle-Calédonie. Con-servation International. Arlington, VA.
Vitousek PM, Mooney HA, Lubchenco J, Melillo JM (1997) Human domination of Earth’s
ecosystems. Science 277: 494–499. https://doi.org/10.1126/science.277.5325.494
Wäber K, Spencer J, Dolman PM (2013) Achieving landscape-scale deer management for bio-diversity conservation: The need to consider sources and sinks. The Journal of Wildlife
Management 77: 726–736. https://doi.org/10.1002/jwmg.530
Walsh JC, Wilson KA, Benshemesh J, Possingham HP (2012) Unexpected outcomes of in-vasive predator control: the importance of evaluating conservation management actions.
Animal Conservation 15: 319–328. https://doi.org/10.1111/j.1469-1795.2012.00537.x
Zippin C (1958) The removal method of population estimation. The Journal of Wildlife
Man-agement 22: 82–90. https://doi.org/10.2307/3797301
Supplementary material 1
Density of rats
Authors: Quiterie Duron, Thomas Cornulier, Eric Vidal, Edouard Bourguet, Lise Ruffino Data type: Statistics
Explanation note: Density of rats (ind.ha-1) according to capture session, species, sex and age. Density was estimated with SECR model : D ~ 1, g0 ~ indgr + session, σ ~ indgr. Copyright notice: This dataset is made available under the Open Database License
(http://opendatacommons.org/licenses/odbl/1.0/). The Open Database License (ODbL) is a license agreement intended to allow users to freely share, modify, and use this Dataset while maintaining this same freedom for others, provided that the original source and author(s) are credited.
Link: https://doi.org/10.3897/neobiota.63.53811.suppl1
Supplementary material 2
Rat abundance and density, rat capture probabilities
Authors: Quiterie Duron, Thomas Cornulier, Eric Vidal, Edouard Bourguet, Lise Ruffino Data type: Statistics
Explanation note: A) Rat abundance and density (ind.ha-1) before and after rat re-moval for the four sessions of rat rere-moval trapping. The total number of individuals in the removal area was estimated with the “Zippin removal” method. Densities were estimated based on the rat removal grid size plus a boundary strip of 9 ha. B) Rat capture probabilities (± SE) estimated from removal trapping with the Zippin removal method by sex, age and session.