Absolute Quantification of Matrix Metabolites
Reveals the Dynamics of Mitochondrial Metabolism
The MIT Faculty has made this article openly available.
Please share
how this access benefits you. Your story matters.
Citation
Chen, Walter W. et al. “Absolute Quantification of Matrix Metabolites
Reveals the Dynamics of Mitochondrial Metabolism.” Cell 166, 5
(August 2016): 1324–1337 © 2016 Elsevier Inc
As Published
http://dx.doi.org/10.1016/J.CELL.2016.07.040
Publisher
Elsevier
Version
Author's final manuscript
Citable link
http://hdl.handle.net/1721.1/116785
Terms of Use
Creative Commons Attribution-NonCommercial-NoDerivs License
Absolute quantification of matrix metabolites reveals the
dynamics of mitochondrial metabolism
Walter W. Chen1,2,3,4, Elizaveta Freinkman1, Tim Wang1,2,3,4, Kıvanç Birsoy5, and David M.
Sabatini1,2,3,4
1Whitehead Institute for Biomedical Research and Massachusetts Institute of Technology,
Department of Biology, 9 Cambridge Center, Cambridge, MA 02142, USA
2Howard Hughes Medical Institute, Department of Biology, Massachusetts Institute of Technology,
Cambridge, MA 02139, USA
3Koch Institute for Integrative Cancer Research, 77 Massachusetts Avenue, Cambridge, MA
02139, USA
4Broad Institute of Harvard and Massachusetts Institute of Technology, 7 Cambridge Center,
Cambridge, MA 02142, USA
5Laboratory of Metabolic Regulation and Genetics, The Rockefeller University, New York City, NY
10065, USA
SUMMARY
Mitochondria house metabolic pathways that impact most aspects of cellular physiology. While metabolite profiling by mass spectrometry is widely applied at the whole-cell level, it is not routinely possible to measure the concentrations of small molecules in mammalian organelles. We describe a method for the rapid and specific isolation of mitochondria, which we use in tandem with a database of predicted mitochondrial metabolites (“MITObolome”) to measure the matrix concentrations of greater than 100 metabolites across various states of respiratory chain (RC) function. Disruption of the RC revealed extensive compartmentalization of mitochondrial metabolism and signatures unique to the inhibition of each RC complex. Pyruvate enables the proliferation of RC-deficient cells, but had surprisingly limited effects on matrix contents. Interestingly, despite failing to restore matrix NADH/NAD balance, pyruvate did increase
aspartate, likely through the exchange of matrix glutamate for cytosolic aspartate. We demonstrate the value of mitochondrial metabolite profiling and describe a strategy applicable to other
organelles.
Correspondence should be addressed to: D.M.S., Tel: 617-258-6407; Fax: 617-452-3566; sabatini@wi.mit.edu.
AUTHOR CONTRIBUTIONS
W.W.C. and D.M.S. initiated the project and designed the research. E.F. played a critical role in establishing the LC/MS platform, assembling the library of metabolite standards, operating the LC/MS equipment, and performing the absolute quantification of samples. T.W. helped with the generation of the MITObolome and provided computational expertise. K.B. helped with experiments. W.W.C. and D.M.S. wrote and edited the manuscript.
Publisher's Disclaimer: This is a PDF file of an unedited manuscript that has been accepted for publication. As a service to our
customers we are providing this early version of the manuscript. The manuscript will undergo copyediting, typesetting, and review of
HHS Public Access
Author manuscript
Cell
. Author manuscript; available in PMC 2017 August 25.Published in final edited form as:
Cell. 2016 August 25; 166(5): 1324–1337.e11. doi:10.1016/j.cell.2016.07.040.
A
uthor Man
uscr
ipt
A
uthor Man
uscr
ipt
A
uthor Man
uscr
ipt
A
uthor Man
uscr
ipt
eToc Blurb
Metabolite profiling of intact mammalian mitochondria captures dynamics of mitochondrial metabolism not revealed by whole cell analysis.
INTRODUCTION
A hallmark of eukaryotic life is the membrane-bound organelles that compartmentalize specialized biochemical pathways within the cell. Enclosed by both outer and inner membranes, mitochondria carry out many essential metabolic processes, such as ATP generation by the respiratory chain (RC) (Wallace, 2013), aspartate synthesis by matrix aminotransferases (Birsoy et al., 2015; Cardaci et al., 2015; Safer, 1975; Sullivan et al., 2015), and long-chain fatty acid catabolism by the beta-oxidation pathway (Vianey-Liaud et al., 1987). Consistent with the critical role of mitochondria in maintaining cellular
homeostasis, dysfunction of mitochondrial enzymes often leads to disease (Wallace, 2013). Despite the importance of mitochondrial metabolism to cellular physiology, methods for systematically interrogating the polar metabolite contents of mitochondria in mammalian cells are limited. In recent years, metabolite profiling of entire cells and tissues by mass spectrometry (MS) has greatly improved our understanding of metabolism by allowing for the simultaneous analysis of hundreds of metabolites from one sample. Such large-scale assessments enable the characterization of entire metabolic networks, which is often necessary to understand the effects of a perturbation on cellular metabolism (Cacciatore and Loda, 2015). Because mitochondria constitute a small fraction of cellular contents, whole-cell profiling is likely inadequate for monitoring changes within the mitochondrial matrix. Several challenges hamper the application of metabolite profiling to subcellular organelles, such as mitochondria. Standard techniques for purifying mitochondria can take hours to complete, leading to the significant loss of metabolites because solute transporters and enzymes can have residual activity even at low temperatures (Bowsher and Tobin, 2001;
A
uthor Man
uscr
ipt
A
uthor Man
uscr
ipt
A
uthor Man
uscr
ipt
A
uthor Man
uscr
ipt
Matuszczyk et al., 2015; Ross-Inta et al., 2008). Commercially available kits for antibody-based isolation of mitochondria are technically less cumbersome than other methods but utilize long immunopurification and wash steps (Miltenyi, 2011). Abbreviated centrifugation protocols, selective membrane permeabilization, and non-aqueous fractionation all improve the speed of the workflow and have provided important insights into the metabolism of subcellular compartments, but the resulting mitochondrial preparations can be contaminated with cytosolic material, as well as other organelles, such as endoplasmic reticuli and lysosomes (Berry et al., 1991; Berthet and Baudhuin, 1967; Bestwick et al., 1982; Fly et al., 2015; Linskens et al., 2012; Matuszczyk et al., 2015; Roede et al., 2012; Tischler et al., 1977). Furthermore, components of traditional organellar isolation buffers (e.g., sucrose) can severely interfere with MS-based metabolite profiling (Roede et al., 2012). Thus, the interrogation of matrix metabolites in a straightforward, robust, and specific manner remains a significant challenge to the study of mitochondrial physiology.
To address this, we developed a new method that combines rapid immunocapture of epitope-tagged mitochondria with metabolite profiling by liquid chromatography and mass
spectrometry (LC/MS). The isolation of mitochondria and extraction of their metabolites occurs within minutes of cellular homogenization and has greatly improved speed and specificity over prior approaches. Using this technique, we generated a quantitative resource containing the matrix concentrations of more than 100 polar metabolites in cells under various states of RC function. This resource enabled us to study the biology of pyruvate, which can reprogram cellular metabolism and mitigate the anti-proliferative effects of RC dysfunction in a manner that is poorly understood at the level of the mitochondrial matrix. Our work exemplifies the power of this quantitative resource for studying mitochondrial biology and provides a methodological framework for interrogating the metabolite contents of other subcellular compartments.
RESULTS AND DISCUSSION
A method for the rapid and specific isolation of intact mitochondria
To faithfully profile matrix metabolites, one needs a technique that is both rapid and capable of effectively separating mitochondria from other subcellular components. Existing methods do not adequately address both of these requirements. In addition, traditional mitochondrial isolation buffers contain high concentrations of solutes (e.g., sucrose) that are not suitable for LC/MS-based metabolomics because of the sensitivity of LC/MS instruments to small molecule contaminants.
To isolate mitochondria rapidly and specifically, we developed an immunopurification (IP) strategy utilizing outer mitochondrial membrane proteins as handles for immunocapture, which enabled metabolite extraction from mitochondria in less than 12 minutes following cellular homogenization. Instead of using an endogenous outer membrane protein, we chose an epitope-tagged recombinant protein to be the IP handle because of the high sensitivity and specificity of various epitope-tags and their cognate antibodies. Three epitope tags were placed in tandem on the N-terminus of EGFP fused to the well-characterized, outer
mitochondrial membrane localization sequence of OMP25 (Figure S1A) (Nemoto and Camilli, 1999), and different tagging systems were tested for their ability to immunocapture
A
uthor Man
uscr
ipt
A
uthor Man
uscr
ipt
A
uthor Man
uscr
ipt
A
uthor Man
uscr
ipt
mitochondria within 3.5 minutes. In HeLa cells, the epitope-tagged protein properly localized to mitochondria, as detected by the complete overlap of the EGFP signal with the established mitochondrial marker MitoTracker Deep Red FM (Figure 1A). Initial attempts to isolate mitochondria using a FLAG-based magnetic bead system commonly employed for protein IPs led to extremely poor yields (Figure S1B). As the FLAG epitope-antibody pairing is relatively high-affinity, we suspected that the major issue was the nature of the beads rather than the epitope tag itself. FLAG antibody-conjugated beads are relatively large (~50 μm in diameter) but are made of a porous agarose matrix, which enables them to circumvent the reduced surface area associated with increased bead size. However, as the average diameter of the agarose pores and mitochondria are ~30 nm and ~500 nm,
respectively, the majority of mitochondrial capture was probably limited to the surface of the beads, in which case reducing bead size would lead to improved yields. Consistent with this, switching to a 3XHA-EGFP-OMP25 construct (HA-MITO) and the smaller cognate beads (non-porous, ~1 μm in diameter) led to dramatically improved yields in both protein (Figure S1B) and metabolite content (Figure S1C), while also preventing extra-mitochondrial metabolites from becoming trapped within the bead matrix.
In addition to the challenges of capturing mitochondria, the sensitivity of LC/MS
instruments to small molecule contaminants necessitated extensive optimization of isolation conditions. In initial experiments, we found that many components of traditional
mitochondrial isolation buffers (e.g., sucrose, HEPES) significantly distorted LC/MS-based analyses, often leading to the complete loss of the signal for certain metabolites (Figure S1D). Prior work has demonstrated that KCl-based buffers can allow for the isolation of coupled mitochondria capable of supporting a membrane potential (Corcelli et al., 2010). As such, we developed an LC/MS-compatible buffer consisting only of KCl and KH2PO4
(“KPBS”), which had significantly improved performance (Figure S1E).
Utilizing our LC/MS-compatible isolation conditions and cells expressing 3XMyc- EGFP-OMP25 (Control-MITO) or HA-MITO, we developed a workflow for the quantitative interrogation of matrix metabolite concentrations (Figure 1B), the complete details of which are described in the Methods and Resources. In brief, we quantified the moles of a matrix metabolite in the IP material by LC/MS-based metabolomics, and the total matrix volume per cell by confocal microscopy. Immunoblot analyses of a mitochondrial marker in whole-cell lysates and the IP material gave the number of whole-whole-cell equivalents present in the latter, which we combined with our microscopy-based measurements to determine the matrix volume of the isolated mitochondria. It is important to note that defining the true free space in the mitochondrial matrix is difficult because of its physical properties and so we used the traditional estimate of matrix space determined by electron microscopy (Gerencser et al., 2012; Srere and Sumegi, 1986). Thus, using both the moles of a metabolite and the associated matrix volume, we could derive a corresponding concentration.
Importantly, mitochondria isolated using our workflow exhibited good integrity and purity. Following isolation from cells incubated with MitoTracker Deep Red FM, mitochondria attached to beads still retained the dye, suggesting that the organelles were intact (Figure 1C). Immunoblot analyses of markers for mitochondria and other subcellular compartments revealed that our approach had significantly less contamination compared to differential
A
uthor Man
uscr
ipt
A
uthor Man
uscr
ipt
A
uthor Man
uscr
ipt
A
uthor Man
uscr
ipt
centrifugation methods that are optimized for speed (Figure 1D) (Bestwick et al., 1982; Bogenhagen and Clayton, 1974). The residual LAMP2 signal in the IP material from both Control-MITO and HA-MITO cells likely reflects binding of free, non-lysosomal LAMP2 protein and not binding of lysosomes, as we did not detect cathepsin C, a protein found in the lysosomal lumen, in the IP material (unpublished data) or cystine, a lysosomal metabolite, in isolated mitochondria (Table S1).
To quantitatively assess the integrity of purified mitochondria, we used a protein and metabolite marker to calculate how much of the mitochondrial material present in whole-cells was captured in each IP (e.g., yield) (Figure 1E). Both the enzyme citrate synthase (CS) and the metabolite coenzyme A (CoA) predominantly reside in the mitochondrial matrix, with only 10–20% of cellular CoA being extra-mitochondrial (Idell-Wenger et al., 1978; Williamson and Corkey, 1979). Consistent with this, measurements of yield using either CS or CoA gave similar results, again demonstrating that the isolated mitochondria were intact, retaining both the protein and small molecule markers to equal degrees (Figure 1E). The isolated mitochondria also retained a significant amount of the membrane-potential sensitive dye, TMRM, as well as its de-esterified intracellular form, TMR (Figure S1F). Importantly, treatment of cells with the uncoupler FCCP led to substantial loss of the dyes in
mitochondria, demonstrating that the TMRM and TMR in isolated mitochondria were indeed membrane-potential responsive. Collectively, these data show that our method enables rapid and specific isolation of intact mitochondria for metabolite profiling.
Identities and concentrations of matrix metabolites in human mitochondria
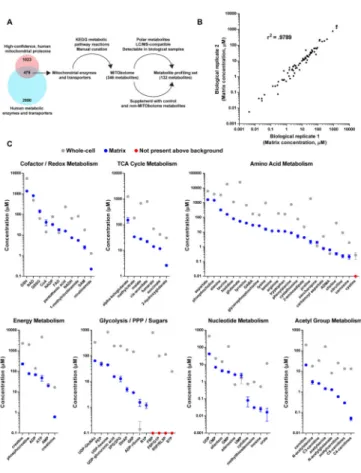
Because of the technical limitations of prior techniques, the identities and concentrations of polar, matrix metabolites in human mitochondria remain largely unknown. To address this, we began by generating a list of all predicted mitochondrial metabolites (the
“MITObolome”) by taking the known substrates, products, and cofactors of all mitochondrial enzymes and small molecule transporters (Figure 2A). Using the MITObolome, we assembled a library of 132 chemical standards for the absolute
quantification of metabolites within the mitochondrial matrix and whole-cells (Figure 2A, Table S1). The Methods and Resources section describes in detail how the MITObolome and the final profiling set were assembled.
We quantified the concentrations of both whole-cell and mitochondrial samples using standard curves of every metabolite in the final profiling set (Table S1). Only total concentrations of metabolites were measured as distinguishing between free and bound populations remains a challenge in metabolomics. Reassuringly, comparisons of matrix concentrations of biological replicates demonstrated a high degree of correlation (Figure 2B). In addition, there was an excellent correlation between samples prepared using the normal workflow and a workflow lengthened by 4 minutes, suggesting that there was not substantial distortion of the matrix metabolite profile in the time frame of our isolations, although it is difficult to know how mitochondria behave at time points earlier than our shortest isolations (Figure S2A). Various cofactors and redox pairs critical for mitochondrial reactions, such as NAD, NADH, FAD, NADP, GSH, GSSG, and SAM, were all found in mitochondria (Figure 2C). Metabolites involved in other mitochondrial processes, such as
A
uthor Man
uscr
ipt
A
uthor Man
uscr
ipt
A
uthor Man
uscr
ipt
A
uthor Man
uscr
ipt
the TCA cycle, energy production, and fatty-acid metabolism, were present as well. Importantly, we did not observe signs of significant contamination from other subcellular compartments because various metabolites not expected to be abundant in mitochondria, such as cystine (lysosomes), sedoheptulose 7-phosphate, and fructose 1,6-bisphosphate (cytosol) were not present at levels above background. With regards to the accuracy of our measurements, our quantification of the matrix NADH/NAD ratio (0.009) agrees with prior studies that indirectly estimated matrix NADH/NAD ratios to span 0.006–0.125, depending on the cell type examined (Erecinska et al., 1978; Nishiki et al., 1978). Taken together, these data indicate that our LC/MS-based workflow can be used to quantitatively study the metabolic landscape of the mitochondrial matrix.
Concentrations of most metabolites within the mitochondrial matrix were generally lower than corresponding measurements made at the whole-cell level (Figure 2C and Figure S2B). The most abundant metabolites were aspartate (1600 μM), phosphocholine (1471 μM), GSH (1374 μM) and NAD (818 μM), each of which participate in distinct metabolic processes (Figure 2C). In contrast, the least abundant were methylthioadenosine (31 nM), inosine (26 nM), and urate (17 nM), all metabolites involved in nucleotide metabolism. As a whole, matrix concentrations spanned a wide range of values, even within the same family of metabolites, underscoring the diversity of the metabolic space within mitochondria.
One particularly diverse class of matrix metabolites is amino acids, which participate in both metabolic reactions and the synthesis of the 13 mitochondrially-encoded proteins required for RC activity (Elo et al., 2012). The majority of proteinogenic amino acids were found in mitochondria (Figure 2C and Tables S1–S3), with the most abundant being aspartate (1600 μM), alanine (327 μM), and histidine (82 μM) (Figure 2C). Although the mitochondrial abundance of different amino acids will likely vary between different cell types, the high concentration of aspartate agrees with recent findings demonstrating that a critical role for mitochondria in supporting cell proliferation is aspartate synthesis (Birsoy et al., 2015; Sullivan et al., 2015).
We also examined the relationships between the KMAmino acid values of different
mitochondrial aminoacyl-tRNA synthetases and the concentrations of their cognate amino acids. For example, the KMAsp of human mitochondrial aspartyl-tRNA synthetase is 1.5 μM
(Messmer et al., 2009), while the average, baseline matrix concentration of aspartate across all experiments was 1113 μM (Tables S1–S3). In the case of aspartate, the matrix
concentration is maintained well above the KMAsp of the aspartyl-tRNA synthetase, likely
ensuring that fluctuations in the abundance of aspartate do not affect charging of the cognate tRNAs. Yet one interesting instance where this was not the case is phenylalanine. The average, baseline matrix concentration of phenylalanine across all experiments was 24.2 μM (Tables S1–S3). However, the KMPhe of the mitochondrial phenylalanyl-tRNA synthetase
(FARS2) is 7.3 μM. Mutations in FARS2 can reduce levels of mitochondrially-encoded proteins and cause fatal epileptic mitochondrial encephalopathy by decreasing the affinity of the FARS2 enzyme for its various substrates (e.g., ATP, tRNA, phenylalanine). In contrast to other pathogenic mutations, a D391V substitution in FARS2 does not substantially alter KMATP and KMtRNA, but increases the KMPhe of FARS2 from 7.3 μM to 20.9 μM (Elo et al.,
2012). Based on our measurements of matrix phenylalanine concentrations, this could lead
A
uthor Man
uscr
ipt
A
uthor Man
uscr
ipt
A
uthor Man
uscr
ipt
A
uthor Man
uscr
ipt
to inefficient charging of mitochondrial tRNAPhe and reduced mitochondrial protein synthesis. These findings thus provide additional insight into the pathogenic basis of the D391V form of FARS2 and exemplify how our quantitative profile of mitochondria can be used with in vitro characterizations of mitochondrial proteins.
To complement our MITObolome-based approach of profiling mitochondria, we also performed highly-targeted and untargeted LC/MS-based metabolomics. Using a tSIM (targeted selected ion monitoring) scan, we quantified additional nucleotide species in mitochondria that were difficult to detect using a standard full scan (Table S1). In addition, using untargeted metabolomics, we uncovered numerous molecules not predicted to be mitochondrial based on the MITObolome (Table S1). As untargeted metabolomics does not provide definitive metabolite identification, validation of peaks is critical for proper data analysis. By matching the characteristics of the peak from our untargeted analysis with those of the corresponding chemical standard, we identified ADP-ribose as a metabolite not previously assigned to the mitochondria based on the databases we have examined (Table S1). ADP-ribose is a substrate for poly(ADP-ribosylating) enzymes, which localize to mitochondria and may maintain the integrity of mitochondrial DNA (Scovassi, 2004). Taken together, these results demonstrate the utility of our targeted and untargeted approaches for studying the metabolite contents of mitochondria.
Whole-cell analyses do not capture the dynamics of mitochondrial metabolism
Comprised of Complexes I–V, the RC oxidizes NADH and FADH2 to generate a proton
gradient that drives the rotation of Complex V and the synthesis of ATP (Figure 3A). Inherited defects in RC complexes cause various forms of mitochondrial disease (Wallace, 2013). However, our understanding of the metabolic consequences of RC pathology is incomplete, especially at the mitochondrial level.
To model different disease states, we treated cells with penetrant doses of piericidin (Complex I inhibitor), antimycin (Complex III inhibitor), and oligomycin (Complex V inhibitor) (Figure 3A and Table S2). While the whole-cell responses to these inhibitors have been previously studied (Birsoy et al., 2015; Chen et al., 2014; Mullen et al., 2012; Shaham et al., 2010; Sullivan et al., 2015), the alterations in matrix metabolites have not. Because of the compartmentalized nature of mitochondria, matrix metabolites can be regulated in unique ways and be present at levels much lower than those in other sub-cellular
compartments. For these reasons, we hypothesized that whole-cell studies do not accurately capture the dynamics of matrix metabolites during RC dysfunction.
In cells treated with each of the three inhibitors, the metabolite profiles of whole-cells and the mitochondrial matrix were highly different (Figures 3B and 3C). For some metabolites, such as aspartate, we observed similar trends in both, but the extent of the change was generally greater in the matrix (Figure 3B). For other metabolites, such as
phosphoenolpyruvate (PEP) and saccharopine, the differences between whole-cells and the matrix were dramatic (Figures 3D and 3E). In these cases, direct interrogation of
mitochondria uncovered alterations in critical metabolic processes that would have gone undetected using whole-cell metabolomics.
A
uthor Man
uscr
ipt
A
uthor Man
uscr
ipt
A
uthor Man
uscr
ipt
A
uthor Man
uscr
ipt
Two distinct pathways, glycolysis and gluconeogenesis, generate PEP in mammalian cells. Enolase catalyzes the formation of PEP from 2-phosphoglycerate in the cytosol, and PEP carboxykinase (PEPCK) generates PEP from oxaloacetate in the matrix and cytosol. The mitochondrial PEPCK (m-PEPCK) reaction is a rate-limiting step in the gluconeogenic pathway. However, it has been difficult to study mitochondrial PEPCK due to the substantial contribution of cytosolic pools of PEP to the whole-cell signal (Stark et al., 2014). Matrix PEP levels dropped significantly across all three forms of RC dysfunction, with the severity of the phenotype correlating well with the relative change in matrix aspartate, a proxy for the m-PEPCK substrate, oxaloacetate (Ke et al., 2015) (Figures 3B and 3D). Underscoring the importance of directly profiling mitochondria, whole-cell PEP levels did not significantly change during inhibition of the RC (Figure 3D). Collectively, these data demonstrate that RC dysfunction leads to reduced oxaloacetate, a TCA cycle metabolite, and consequently a dramatic impairment of m-PEPCK activity, an important step in gluconeogenesis. These findings are in line with prior work arguing that m-PEPCK also links TCA cycle activity to gluconeogenesis through the enzyme’s dependence on GTP, which is formed by the TCA cycle member, succinate thiokinase (Stark et al., 2009).
A similarly compartmentalized defect occurred in the lysine degradation pathway during all forms of RC dysfunction, as evidenced by the accumulation of matrix saccharopine (Figure 3E). The matrix enzyme, aminoadipate-semialdehyde synthase (AASS) metabolizes saccharopine, a breakdown product of lysine, in an NAD-dependent manner (Markovitz et al., 1984). Accumulation of NADH within the matrix likely leads to inhibition of AASS activity during RC dysfunction (Figure 3B). Similar to PEP, saccharopine did not
significantly change on the whole-cell level, likely due to the cytosolic pool of saccharopine being larger than the matrix pool (Figure 3E). However, in contrast to the production of PEP in multiple subcellular compartments, only mitochondria generate saccharopine (Kanehisa and Goto, 2000). Thus, whole-cell studies can fail to detect a change in matrix metabolism even when the participating metabolite has a purely mitochondrial origin. Taken together, these data demonstrate that there is substantial compartmentalization of metabolic changes during RC dysfunction that necessitates profiling at the matrix level.
Extensive compartmentalization of core redox and anti-oxidant metabolism in cells with RC inhibition
Redox balance and anti-oxidant defense are two core mitochondrial processes critical for maintaining matrix homeostasis and regulated by the ratios of NADH/NAD and GSH/ GSSG, respectively (Wheaton et al., 2014). We were particularly interested in the behavior of these processes as it has been speculated that during RC dysfunction the mitochondrial changes in NADH/NAD and GSH/GSSG are likely distinct from those seen in whole-cells (Van Vranken and Rutter, 2015; Wheaton et al., 2014). Consistent with this, there were dramatic differences in the degree of NADH/NAD imbalance in whole-cells and the mitochondrial matrix during RC dysfunction (Figure 3F). Whole-cell NADH/NAD ratios increased during RC dysfunction by a maximum of 2.3-fold upon Complex III inhibition and did not increase at all during Complex V inhibition. In contrast, all three inhibitors significantly elevated matrix NADH/NAD ratios, with Complex I inhibition increasing the NADH/NAD ratio ~77-fold. The smaller changes in whole-cell NADH/NAD ratios during
A
uthor Man
uscr
ipt
A
uthor Man
uscr
ipt
A
uthor Man
uscr
ipt
A
uthor Man
uscr
ipt
RC blockade are consistent with matrix NADH being a small portion of the whole-cell pool (Table S2). In addition, while RC dysfunction largely cripples the mitochondrial axis of NAD regeneration, lactate dehydrogenase can still replenish cytosolic NAD, thereby mitigating cytosolic NADH/NAD imbalance.
A major consequence of RC dysfunction is a decreased level of aspartate, which
mitochondria produce primarily through a series of NAD-dependent reactions (Birsoy et al., 2015; Safer, 1975; Sullivan et al., 2015). As such, we hypothesized that there should be a relationship between matrix NADH/NAD ratios and aspartate concentrations across different states of RC function. Indeed, there was an excellent correlation between the log10
-transformed values of matrix aspartate and NADH/NAD, which demonstrates that the relationship between aspartate and the NADH/NAD ratio can be modeled as a power function (Figure 3G). Consistent with this, even a relatively mild increase in the
NADH/NAD ratio (e.g., oligomycin treatment) could account for the majority of the loss in matrix aspartate, suggesting that aspartate synthesis is quite sensitive to changes in matrix NADH/NAD redox balance.
In addition to NAD and NADH, we also examined the behavior of GSH and GSSG, another redox pair critical for mitochondrial function and one often used as a metric for oxidative stress. In contrast to whole-cells, inhibition of either Complex I or III significantly increased the matrix GSH/GSSG ratio (Figure 3H), demonstrating that disruption of RC function can lead to a state in which there is less oxidative stress in the matrix. These data agree with models in which RC activity generates a significant amount of reactive oxygen species in mitochondria (Wheaton et al., 2014), but may also reflect a relationship between
NADH/NAD and GSH/GSSG ratios that is mediated through mitochondrial
transhydrogenases, which can utilize NADH to generate NADPH, a redox molecule critical for driving GSH formation (Mullen et al., 2012). Collectively, these results reveal how profiling the metabolite contents of mitochondria can even uncover new information about well-studied core processes, such as redox balance and anti-oxidant defense.
Mitobolomics reveals unique signatures of Complex I, III, and V inhibition
Complexes I, III, and V have non-redundant functions in the RC and defects in each can lead to distinct forms of mitochondrial disease (Wallace, 2013). While general features of RC dysfunction, such as NADH/NAD imbalance, are well-appreciated, our understanding of the metabolic consequences of inhibiting specific RC complexes remains incomplete,
particularly at the mitochondrial level. To that end, we identified metabolic alterations in the matrix that are unique to the inhibition of Complex I, III, or V.
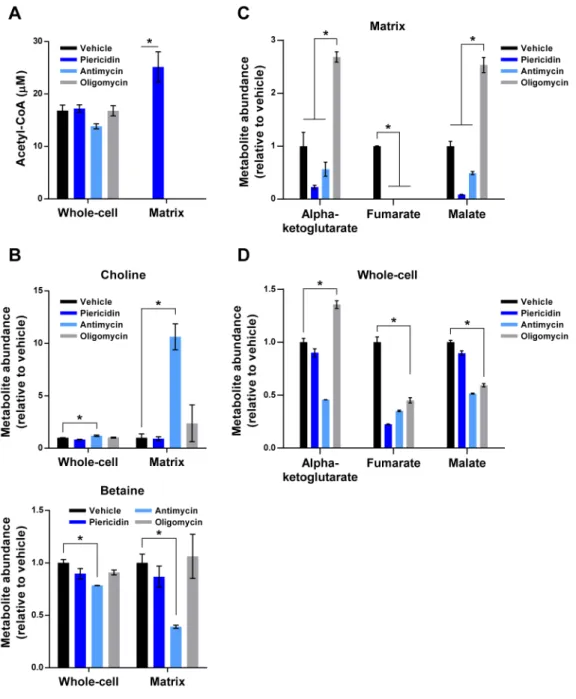
A striking example of such a metabolic signature is the accumulation of acetyl-CoA in the matrix of cells with Complex I inhibition, which we did not observe in any other form of RC dysfunction (Figure 4A). Whole-cell acetyl-CoA did not recapitulate the changes in matrix acetyl-CoA, likely due to the larger extra-mitochondrial pools of acetyl-CoA. Acetyl-CoA normally enters the TCA cycle through the action of citrate synthase, an enzyme that decreases in activity when the NADH/NAD ratio is high. Although the reason that Complex V blockade does not lead to acetyl-CoA accumulation is likely the smaller degree of NADH/NAD imbalance, the same cannot be said for Complex III inhibition, which
A
uthor Man
uscr
ipt
A
uthor Man
uscr
ipt
A
uthor Man
uscr
ipt
A
uthor Man
uscr
ipt
increased the matrix NADH/NAD ratio substantially (Figure 3F). Consistent with Complexes I and III altering the matrix NADH/NAD ratio to a comparable degree, both forms of RC dysfunction reduced matrix aspartate to a similar extent (Figure 3G). However, one of the distinguishing features of Complex III blockade is that it also impairs the
regeneration of FAD. The first step of fatty acid oxidation, which contributes significantly to matrix acetyl-CoA pools, requires FAD (Vianey-Liaud et al., 1987). As such, acetyl-CoA likely does not accumulate upon Complex III inhibition because it cannot be generated in sufficient amounts. While fatty acid oxidation also requires NAD to generate acetyl-CoA (Vianey-Liaud et al., 1987), it is possible that residual flux through the NAD-dependent step during Complex I inhibition can still lead to acetyl-CoA accumulation. There is precedent for this as succinate accumulates during Complex III inhibition despite reduced activity of the upstream enzyme, alpha-ketoglutarate dehydrogenase (Mullen et al., 2012). Interestingly, prior work has shown that excess acetyl-CoA can lead to non-enzymatic acetylation of mitochondrial proteins, a pathological process countered by the mitochondrial deacetylase, SIRT3 (Wagner and Payne, 2013). Our findings thus suggest that Complex I inhibition may impose a greater burden on the SIRT3 system than other forms of RC dysfunction.
It is well appreciated that Complex III inhibition leads to the accumulation of succinate in cells (Mullen et al., 2012). Interestingly, while succinate behaved as expected at the whole-cell level, it did not accumulate appreciably in the matrix, suggesting that excess succinate is rapidly exported into the cytosol (Figure 3B). We did however observe a substantial
accumulation of choline and loss of betaine in the mitochondrial matrix, which was unique to Complex III inhibition (Figure 4B). Similar trends were observed in whole-cells, although to much lesser degrees. This pattern of metabolic changes likely reflects a decrease in the activity of choline dehydrogenase, a matrix enzyme dependent on FAD. These data demonstrate that only Complex III inhibition decreases mitochondrial synthesis of betaine, which can play an important role in the cellular maintenance of the SAM-SAH cycle of methylation (Kanehisa and Goto, 2000).
Inhibition of Complex V led to mitochondrial abnormalities also seen with inhibition of Complexes I and III (e.g., loss of matrix aspartate) but generated a distinctive distribution of TCA cycle metabolites within the matrix that was not seen on the whole-cell level (Figures 4C and 4D). Indeed, matrix metabolites on opposite ends of the cycle accumulated (e.g., alpha-ketoglutarate, malate) and decreased dramatically (e.g., fumarate). This is in contrast to inhibition of Complexes I and III, which caused a general decrease of TCA cycle components from alpha-ketoglutarate onwards (Figures 4C and 3B) and suggests that there is greater oxidative TCA cycle activity during Complex V inhibition.
Although we have highlighted a few notable examples to exemplify the utility of our approach, there were many other interesting phenomena specific to certain forms of RC dysfunction. For example, Complex I inhibition led to a massive increase in the matrix acetylcarnitine/carnitine ratio (> 250-fold), compared to the other forms of RC blockade (< 20-fold), whereas only Complex III inhibition significantly increased levels of carbamoyl aspartate (Figures S3A and S3B). Future work will be needed to fully appreciate the impacts of these metabolic changes during RC pathology. More generally though, these studies reveal that specific states of RC dysfunction lead to unique alterations in matrix metabolites.
A
uthor Man
uscr
ipt
A
uthor Man
uscr
ipt
A
uthor Man
uscr
ipt
A
uthor Man
uscr
ipt
Amelioration of RC dysfunction with pyruvate increases matrix aspartate without restoration of the matrix NADH/NAD ratio
Pyruvate has been known for decades to suppress the anti-proliferative effects of RC dysfunction (Harris, 1980; King and Attardi, 1989). Recent work shows that pyruvate supplementation during RC dysfunction leads to regeneration of NAD and induction of aspartate synthesis in the cytosol (Birsoy et al., 2015; Sullivan et al., 2015). Given the ability of pyruvate to substantially alter cytosolic metabolism, we asked whether it could similarly reverse the mitochondrial defects associated with RC dysfunction.
Inhibition of Complex I, III, or V has been shown to reduce aspartate at the whole-cell level (Birsoy et al., 2015; Sullivan et al., 2015). To improve our chances of seeing pyruvate-mediated rescue during the time frame of our treatment conditions, we examined Complex V blockade with oligomycin, which causes significant but relatively modest NADH/NAD imbalance in the mitochondrial matrix (Figure 3F). Inhibition of Complex V did not increase the whole-cell NADH/NAD ratio, but pyruvate did lower NADH/NAD ratios regardless of treatment conditions, demonstrating that pyruvate was driving NAD regeneration (Figure S4). Consistent with this, pyruvate supplementation significantly rescued whole-cell aspartate during Complex V inhibition, but also led to a significant improvement in matrix aspartate as well (Figure 5A).
Interestingly, despite the ability of pyruvate to increase NAD regeneration in the cytosol, the matrix NADH/NAD ratio did not improve with pyruvate supplementation during Complex V inhibition (Figure 5B). In contrast to the relationship between matrix NADH/NAD ratios and aspartate in the absence of pyruvate (Figure 3G), this was a unique example in which the behavior of aspartate did not correlate well with changes in NADH/NAD balance (Figures 5A and 5B). Thus, pyruvate can increase matrix aspartate without ameliorating the NADH/NAD imbalance caused by RC dysfunction.
Consistent with its inability to correct the matrix NADH/NAD ratio, pyruvate did not significantly alter the behavior of metabolites that were substantially changed during oligomycin treatment (Figure 5C and Table S3). Indeed, there were good correlations between the metabolic profiles of cells treated with oligomycin in the presence and absence of pyruvate at the matrix level, as well as the whole-cell level (Figure 5D).
Interestingly, pyruvate supplementation led to reduced glutamate accumulation during Complex V blockade (Table S3). Matrix glutamate accumulated in all forms of RC dysfunction tested (Figure 3B), likely due to inhibition of the NAD-dependent,
mitochondrial glutamate dehydrogenases. However, because pyruvate did not restore the matrix NADH/NAD ratio (Figure 5B), it is unlikely that redox changes reduced the accumulation of glutamate. Taking advantage of our absolute quantification of metabolites, we compared the matrix levels of glutamate and aspartate. Interestingly, upon pyruvate supplementation, the decrease in the concentration of matrix glutamate was very similar in magnitude to the increase in the concentration of matrix aspartate (Figure 5E, Table S3, and Methods and Resources for calculations). These findings are consistent with the behavior of mitochondrial aspartate-glutamate transporters, which exchange aspartate for glutamate (Palmieri, 2013). During RC inhibition in the presence of pyruvate, the accumulation of
A
uthor Man
uscr
ipt
A
uthor Man
uscr
ipt
A
uthor Man
uscr
ipt
A
uthor Man
uscr
ipt
cytosolic aspartate and mitochondrial glutamate could potentially drive the antiport activity of these transporters. We thus suggest that pyruvate improves cytosolic and matrix aspartate through two distinct metabolic routes, with the mitochondrial axis not even dependent on restoration of the matrix NADH/NAD ratio (Figure 5F).
CONCLUSIONS
The speed and specificity of existing isolation protocols have made it challenging to profile the polar metabolite contents of mitochondria in mammalian systems. To address this, we developed a new technique that combines high-affinity capture of epitope-tagged
mitochondria and LC/MS-based metabolomics. This allowed us to generate a quantitative resource containing matrix concentrations of more than 100 metabolites under different states of RC function, revealing the compartmentalized dynamics of numerous metabolic processes. From this work, we find that pyruvate has limited effects on matrix metabolites during RC pathology, but can increase matrix aspartate without ameliorating matrix NADH/NAD imbalance.
Increasing matrix aspartate is important during RC pathology because mitochondria require aspartate to synthesize critical RC components. In states of partial RC dysfunction (e.g., Complex I inhibition), residual RC activity preserves key cellular processes, such as de novo pyrimidine synthesis (King and Attardi, 1989) and mitochondrial membrane potential (Birsoy et al., 2015; Chen et al., 2014). Thus, if pyruvate increased aspartate solely in the cytosolic compartment of cells with partial RC dysfunction, then it is possible that the existing deficiency in matrix aspartate could lead to decreased mitochondrial protein synthesis and further cellular pathology.
Taken together, we believe that this work demonstrates the power of our methodology for studying mitochondrial metabolism. The use of epitope-tags to isolate mitochondria allows for spatiotemporal control over which cell type one purifies from, a particularly useful feature for in vivo metabolic studies. More generally, the relative ease of designing epitope-tagged handles for different organelles suggests that our strategy can be extended to other subcellular compartments, thus allowing for in-depth characterization of organellar metabolites in mammalian systems.
METHODS AND RESOURCES
CONTACT FOR REAGENT AND RESOURCE SHARING
Further information and requests for reagents may be directed to, and will be fulfilled by the corresponding author David M. Sabatini (sabatini@wi.mit.edu).
EXPERIMENTAL MODEL AND SUBJECT DETAILS
Generation of cells with epitope-tagged mitochondria—HeLa cells, an established human cell line, were originally purchased from ATCC. Their identity was confirmed prior to the start of this work through cell line authentication (Duke University DNA Analysis Facility).
A
uthor Man
uscr
ipt
A
uthor Man
uscr
ipt
A
uthor Man
uscr
ipt
A
uthor Man
uscr
ipt
Various epitope-tagged constructs were transfected with the retroviral packaging vectors Gag-Pol and CMV VSV-G into HEK-293T cells. Media was changed 24 hours after transfection. The virus-containing supernatant was collected 48 hours after transfection and passed through a 0.45 μm filter to eliminate cells. HeLa cells were infected in media containing 8 μg/mL of polybrene and a spin infection was performed by centrifugation at ~1,100 g for 1 hour. Post-infection, virus was removed and cells were selected with blasticidin (10 μg/mL), before being FACS-sorted twice for GFP positivity.
Cell culture conditions—HeLa cells were grown in DME base media containing 10% heat inactivated fetal bovine serum, 4 mM glutamine, penicillin, and streptomycin. For all experiments, cells were cultured in DME base media, DMEM lacking pyruvate (Sigma), or DMEM lacking pyruvate supplemented with 1 mM pyruvate. For each experiment, cells were washed once with PBS (-) before being cultured with the indicated media. For experiments measuring TMRM and TMR, cells were first cultured for 45 minutes in DME base media with TMRM (25 nM) and verapamil (10 μM), which facilitates loading of TMRM into cells. Cells were then treated with 100% ethanol (1/1000) or FCCP (10 μM) for an additional 30 minutes before processing. For all other experiments using DME base media, cells were cultured in normal base media for one hour before processing. For experiments comparing the effects of different RC inhibitors, cells were treated for two hours with 100% DMSO (1/1000), piericidin (5 μM), antimycin (10 μM), or oligomycin (5 μM) in DMEM lacking pyruvate. For experiments studying the effects of pyruvate on mitochondrial metabolites during Complex V inhibition, cells were treated for two hours with 100% DMSO (1/1000) or oligomycin (5 μM) in DMEM lacking pyruvate or DMEM lacking pyruvate and supplemented with 1 mM pyruvate.
METHOD DETAILS
Magnetic beads, antibodies, reagents, and constructs—aterials were obtained from the following sources: Anti-FLAG M2 magnetic beads (M8823) from Sigma-Aldrich; anti-HA magnetic beads (88837) from Thermo Fisher Scientific; antibodies to VDAC (4661), CS (14309), RPS6KB1 (2708), GOLGA1 (13192), and CALR (12238) from Cell Signaling Technology; antibody to SHMT2 (HPA-020549) from Sigma-Aldrich; antibodies to LAMP2 (sc-18822) and LMNA (sc-20680) from Santa Cruz Biotechnology; antibody to PEX19 (ab137072) from Abcam; HRP-conjugated anti-mouse and anti-rabbit antibodies from Santa Cruz Biotechnology; piericidin A from Enzo Life Sciences; sodium pyruvate, polybrene, antimycin A, oligomycin A, FCCP, and verapamil from Sigma-Aldrich;
blasticidin from Invivogen; and MitoTracker Deep Red FM and TMRM from Thermo Fisher Scientific.
Retroviral 3XFLAG-EGFP-OMP25, 3XMyc-EGFP-OMP25, 3XHA-EGFP-OMP25 vectors were generated via ligation of fragments PCR-amplified from an EGFP-OMP25 construct (Addgene, #38249) (Yoshii et al., 2011) into a pMXs-IRES-blasticidin retroviral vector (Cell Biolabs) digested with XhoI and NotI.
Immunoblotting—Protein from lysates were prepared for and resolved by 12% SDS-PAGE at 100 V, transferred for 2.5 hours at 50 V onto 0.45 μm PVDF membranes, and
A
uthor Man
uscr
ipt
A
uthor Man
uscr
ipt
A
uthor Man
uscr
ipt
A
uthor Man
uscr
ipt
analyzed by immunoblotting as described previously (Chantranupong et al., 2014). Membranes were blocked with 5% nonfat dry milk prepared in TBST (tris-buffered saline with Tween 20) for 45 minutes at room temperature, then incubated with primary antibodies in 5% milk overnight at 4°C. Primary antibodies to the followi ng proteins were used at the indicated dilutions: VDAC (1/1000), CS (1/1000), RPS6KB1 (1/1000), GOLGA1 (1/1000), CALR (1/1000), SHMT2 (1/1000), LAMP2 (1/2000), LMNA (1/1000), and PEX19 (1/1000). Membranes were then washed three times, 5 minutes each, with TBST and incubated with the corresponding secondary antibodies in 5% milk (1/5000) for 45 minutes at room temperature. Membranes were then washed three more times, 5 minutes each, with TBST before being visualized using enhanced chemiluminescence (Thermo Fisher
Scientific).
Confocal microscopy—For experiments confirming proper localization of the epitope-tagged protein to mitochondria, ~60,000 HeLa cells expressing different 3XTag-EGFP-OMP25 constructs were incubated with 6.25 nM – 25 nM MitoTracker Deep Red FM (MTDR) (Thermo Fisher Scientific) for one hour. Cells were then fixed with 4% PFA in PBS, mounted with anti-fade mounting medium containing DAPI (Vectashield), and imaged on an RPI spinning disk confocal microscope (Zeiss) using EGFP, MTDR, and DAPI channels. For imaging mitochondria on beads, 4% PFA in PBS was used instead of 80% methanol during the mitochondrial IP workflow (see below). Images of mitochondria were acquired as described for whole-cells, except that the DAPI channel was not used.
MITObolome and assembly of metabolite library for absolute quantification—
The high-confidence list of 1,023 human mitochondrial proteins from MitoCarta (Pagliarini et al., 2008) was cross-referenced with a list of 2,990 known metabolic enzymes and transporters (Birsoy et al., 2015) to give a set of 479 mitochondrial enzymes and
transporters. For these 479 proteins, KEGG (Kanehisa and Goto, 2000) and manual curation was used to identify their cognate substrates, products, and cofactors, which formed a draft list of predicted mitochondrial metabolites. Metabolites not listed in KEGG but involved in critical mitochondrial processes were added to the draft list as well (e.g., certain
proteinogenic amino acids are not acted upon by any known enzyme or transporter but are needed for mRNA translation in mitochondria). Finally, certain molecules were removed because they are not actually metabolites (e.g., carrier proteins conjugated to small molecules). Additional modifications, such as removal of metals and non-endogenous compounds, were also made to generate the final list of 346 metabolites predicted to be present in human mitochondria, which was termed the “MITObolome” (see Table S1 for complete list of the added/removed metabolites). Using the MITObolome, a library of 132 metabolites was assembled to generate standard curves for absolute quantification of samples (see Table S1 for complete details).
LC/MS-based metabolomics and quantification of metabolite abundance within samples—LC/MS was used to profile and quantify the polar metabolite contents of both whole-cell and IP samples. Acetonitrile was Hypergrade and was purchased from EMD Millipore. All other solvents were Optima LC/MS grade and were purchased from Thermo Fisher Scientific. The metabolite extraction mix was composed of 80% methanol in water,
A
uthor Man
uscr
ipt
A
uthor Man
uscr
ipt
A
uthor Man
uscr
ipt
A
uthor Man
uscr
ipt
supplemented with a mixture of 17 isotope-labeled amino acids at 90.9 nM each, used as internal standards (Cambridge Isotope Laboratories, MSK-A2-1.2).
A library of metabolite chemical standards was curated as described above. Metabolites were commercially available and grouped into five pools (see Table S1 for the composition of each pool), except that C4- and C5-carnitines were a kind gift of R. Pragani and M. Boxer (NCATS, NIH, Rockville, MD) and were synthesized via a published procedure (Goel, Om P., SSV Therapeutics, Inc., USA; U.S. Patent Number 7777071, B2; Aug. 17, 2010). Standards were validated by using LC/MS to confirm that they contained a robust peak at the correct m/z ratio. Stock solutions of each pool, containing 1 mM of each metabolite standard in water, were stored at −80°C. On the day of each LC/MS run, these 1 mM stocks were used to prepare fresh standard curves diluted with 80% methanol in water containing the 17 isotope-labeled internal standards. These standard curves of metabolites within the five pools were then analyzed in parallel with each batch of biological samples.
LC/MS-based analyses were performed as described previously (Birsoy et al., 2015) on a QExactive benchtop orbitrap mass spectrometer equipped with an Ion Max source and a HESI II probe, which was coupled to a Dionex UltiMate 3000 UPLC system (Thermo Fisher Scientific). External mass calibration was performed using the standard calibration mixture every 7 days. 5 μL of each metabolite sample was injected onto a ZIC-pHILIC 2.1 × 150 mm (5 μm particle size) column (EMD Millipore). Buffer A was 20 mM ammonium carbonate, 0.1% ammonium hydroxide; buffer B was acetonitrile. The chromatographic gradient was run at a flow rate of 0.150 mL/minute as follows: 0–20 minutes: linear gradient from 80% to 20% B; 20–20.5 minutes: linear gradient from 20% to 80% B; 20.5–28
minutes: hold at 80% B. The mass spectrometer was operated in full-scan, polarity switching mode with the spray voltage set to 3.0 kV, the heated capillary held at 275°C, and the HESI probe held at 350°C. The sheath gas flow was set to 40 units, the auxiliary gas flow was set to 15 units, and the sweep gas flow was set to 1 unit. The MS data acquisition was
performed in a range of 70–1000 m/z, with the resolution set at 70,000, the AGC target at 106, and the maximum injection time at 80 milliseconds.
Metabolite identification and quantification were performed with XCalibur QuanBrowser 2.2 (Thermo Fisher Scientific) using a 10 ppm mass accuracy window and 0.5 minute retention time window. To confirm metabolite identities and to enable quantification, the aforementioned pools of authentic metabolite standards were used. Within-batch mass deviation was typically < 0.0005 Da, and retention time deviation was < 0.25 minutes. Typically, the final concentrations of standards were 1 nM, 10 nM, 100 nM, 1 μM, 10 μM, and 30 μM, but pool 4 was run at concentrations of 1 nM, 3 nM, 10 nM, 30 nM, 100 nM, 300 nM, 1 μM, 3 μM, 10 μM, and 30 μM to more accurately quantify certain metabolites. In each sample, the raw peak area for each metabolite was divided by the raw peak area of the relevant isotope-labeled internal standard to calculate the relative abundance (see Table S1 for the internal standard used for each metabolite). Leucine, isoleucine, methionine, proline, tyrosine, threonine, histidine, aspartate, glutamate, arginine, phenylalanine, and valine were normalized with their isotope-labeled counterparts. All other isotope-labeled amino acids were not abundant enough to give robust peaks in every biological sample and were thus not used. For determining the relative abundances of all other metabolites, the peak areas were
A
uthor Man
uscr
ipt
A
uthor Man
uscr
ipt
A
uthor Man
uscr
ipt
A
uthor Man
uscr
ipt
normalized to either isotope-labeled phenylalanine or isotope-labeled valine, depending on which isotope-labeled standard had the closer retention time to the metabolite being examined. The relative abundances obtained from the standard curve samples were fit to a quadratic log-log equation, typically with r2 > 0.99, which was then used to calculate the concentration of the metabolite in each metabolite extract. The total number of moles of a metabolite in a given whole-cell or IP extract was then calculated from the sample concentration and the corresponding sample volume. For undetectable metabolites, concentrations were set to 0.
LC/MS matrix effects (e.g., the effects of KPBS on the behavior of metabolites) were controlled for by comparing the performance of all 132 metabolites in the quantitative profiling library in the presence and absence of KPBS. To model the residual wet volume left over after the IP, a surrogate matrix composition of 2 μL of KPBS for every 48 μL of 80% methanol extraction buffer was used (1/25 dilution). Standard curves were generated using either normal 80% methanol/20% water with internal standards (80/20) or 80% methanol/20% water with internal standards and with KPBS spiked in at a 1/25 dilution (80/20K). Importantly, KPBS did not affect our ability to confidently assign a peak to a particular metabolite, as KPBS did not alter the retention time of the metabolites that were examined. The standard curves derived from 80/20 samples were then used to calculate the concentrations of the 80/20 and 80/20K samples to determine how much deviation there was between the two. Based on the median deviation across multiple concentrations of standards prepared in 80/20 or 80/20K, a list of correction factors was generated for adjusting the quantification of each metabolite within a given IP extract (see Table S1 for correction factors).
Measurement of whole-cell concentrations of metabolites—All whole-cell metabolite profiling was performed on ice or at 4°C with pre-chilled buffers. Following the appropriate treatment, ~2 million HeLa cells expressing HA-MITO were quickly washed twice with PBS prepared in Optima LC/MS water and then scraped into 500 μL of 80% methanol in water containing the 17 isotope-labeled internal standards. Samples were vortexed vigorously for 10 minutes, spun down at 17,000 x g for 10 minutes, and the supernatants analyzed with LC/MS as described above to determine the total moles of a metabolite in each whole-cell sample.
For each experiment, a replicate set of cells was treated identically and used for measuring cell number and volume. The contents of each well were trypsinized and cell number and volume measured using a Beckman Z2 Coulter Counter with a size setting of 8–30 μm. Whole-cell concentrations were calculated using the total moles of a metabolite in a whole-cell sample, the total number of whole-cells per sample, and the volume of each whole-cell.
Rapid isolation of mitochondria from cells and measurement of matrix
concentrations of metabolites—Traditional mitochondrial isolation buffer was made of 75 mM sucrose, 225 mM mannitol, 20 mM HEPES, 0.5 mM EDTA, pH 7.4, cOmplete EDTA-free protease inhibitor (Roche) in deionized water. LC/MS-compatible mitochondrial isolation buffer, KPBS, was comprised of 136 mM KCl, 10 mM KH2PO4, pH 7.25 in
A
uthor Man
uscr
ipt
A
uthor Man
uscr
ipt
A
uthor Man
uscr
ipt
A
uthor Man
uscr
ipt
Optima LC/MS water and was prepared using clean equipment and glassware. The pH of the buffer was adjusted with KOH because of the sensitivity of isolated mitochondria to sodium. After passage through a 0.22 μm filter (Corning), the buffer was kept at 4°C.
For each experiment, an anti-HA IP was performed on HeLa cells expressing Control-MITO or HA-MITO. The entire workflow was done on ice in a 4°C cold room with pre-chilled buffers and equipment. Only one sample (e.g., Control-MITO or HA-MITO-expressing cells) was processed at a time to increase the speed of isolation. 200 μL of anti-HA magnetic beads were pre-washed three times with KPBS. All washes were done by gentle pipetting using a wide-bore pipette tip and collecting beads using a DynaMag Spin Magnet (Thermo Fisher Scientific).
~30 million cells were rapidly washed twice with PBS prepared in Optima LC/MS water and then gently scraped into 1 mL KPBS. The cell suspension was spun down at 1000 x g for 2 minutes, supernatant was discarded, and cell pellet gently resuspended in 1 mL KPBS. Cells were homogenized with 25 strokes of a 2 mL dounce homogenizer containing a pure PTFE head (VWR International), taking care not to introduce air bubbles into the solution. The homogenate was spun down at 1000 x g for 2 minutes and the supernatant incubated with 200 μL of prewashed beads on an end-over-end rotator for 3.5 minutes. Afterwards, the IP was quickly washed twice with 1 mL KPBS, resuspended in 1 mL KPBS, and transferred to a new tube. 250 μL of the suspension was taken for detergent lysis and the remainder for metabolite extraction. Metabolites were always extracted before detergent lysis. For metabolite extraction, beads were collected and incubated for 5 minutes with 50 μL of 80% methanol in water containing internal standards. For detergent lysis, beads were collected and incubated for 10 minutes with 50 μL of lysis buffer comprised of 50 mM Tris-HCl, pH 7.4, 150 mM NaCl, 1 mM EDTA, 1% Triton X-100, and cOmplete EDTA-free protease inhibitor. Afterwards, the detergent lysate and metabolite extract were transferred to new tubes, spun down at 17,000 x g for 10 minutes, and the supernatants kept.
In experiments examining the effects of a lengthened workflow on matrix metabolite profiles, all steps were identical except that IP samples sat on ice for an additional 4 minutes before the final wash solution was aspirated and samples were processed further.
The metabolite extract was analyzed with LC/MS as described earlier to determine the total moles of a metabolite in each IP sample. For a metabolite to be considered present at levels above background (e.g., to be considered mitochondrial), it had to be at least 1.5-fold more abundant in the HA-MITO IP than in the Control-MITO IP across three biological
replicates. The background-corrected abundance was obtained by subtracting the moles present in the Control-MITO IP from those present in the HA-MITO IP.
To determine the corresponding matrix volume for a given HA-MITO IP, a two-part strategy was used. First, ~60,000 HA-MITO-expressing cells were cultured under the same
conditions used for all metabolite profiling experiments, and then fixed, mounted, and imaged using the EGFP and DAPI channels. Z-stacks of at least 100 cells per condition were generated using a step size of 0.25 μm. The three-dimensional surface of the EGFP signal (surface area detail = 0.05 μm, diameter of largest sphere that will fit into object = 0.25 μm)
A
uthor Man
uscr
ipt
A
uthor Man
uscr
ipt
A
uthor Man
uscr
ipt
A
uthor Man
uscr
ipt
was created with the IMARIS software (Bitplane) and the total mitochondrial volume per cell calculated with the built-in volumetric analysis. The mean mitochondrial volume per cell in each condition was used for subsequent calculations.
For the second part of our approach, a defined number of HA-MITO-expressing cells were lysed as described above. A series of dilutions of this cell lysate was analyzed in parallel with HA-MITO IP samples by blotting for citrate synthase, a protein that is predominantly localized to the mitochondria within cells (Wiegand and Remington, 1986). Using
densitometry analysis, the total number of whole-cell equivalents present in each HA-MITO IP could be determined. The dilution series behaved linearly with r2 ~ 0.97.
The final matrix volume associated with each HA-MITO IP was then calculated using the total mitochondrial volume per cell, the number of whole-cell equivalents present in each HA-MITO IP, and the proportion of mitochondrial volume occupied by an orthodox configuration of the matrix (~63.16% of mitochondrial volume = matrix) (Gerencser et al., 2012). Matrix concentrations of metabolites were determined by combining the background-corrected moles of a metabolite in the HA-MITO IP with the corresponding matrix volume.
Highly-targeted metabolomics—For the highly-targeted analyses of TMRM and TMR and certain nucleotide species, the instrument was run as described above, but with the following modifications. For TMRM and TMR, an additional tSIM (targeted selected ion monitoring) scan in positive ionization mode was done, with the resolution set to 70,000, an AGC target of 105, and a maximum integration time of 250 milliseconds. The target masses were 401.1860 (corresponding to TMRM) and 387.1703 (corresponding to de-esterified TMRM, i.e., TMR). The isolation window around each target mass was set to 1.0 m/z. Only relative quantification was done for TMRM and TMR. For the nucleotide analysis, MS data was collected in negative ionization mode only, in a mass range of 285–550 m/z, with the resolution set to 70,000, an AGC target of 106, and a maximum integration time of 250 milliseconds.
Untargeted metabolomics—Positive and negative ionization data from LC/MS-based analysis of control and HA-MITO IP samples was interrogated with Progenesis CoMet software (Nonlinear Dynamics). See Table S1 for complete list of criteria used to determine if a metabolite was present at levels above background (e.g., if a metabolite was
mitochondrial).
Rapid differential centrifugation for isolating mitochondria—For experiments isolating mitochondria using rapid differential centrifugation, a modified workflow based on existing protocols was used (Bestwick et al., 1982; Bogenhagen and Clayton, 1974). All experiments were performed using KPBS to make the isolation conditions of the differential centrifugation consistent with those of the IP method. All steps of the centrifugation workflow leading up to the post-homogenization spin were identical to those of the IP method described above. The homogenate was spun down at 1000 x g for 2 minutes and the supernatant taken and spun down at 10,000 x g for 10 minutes. After aspirating the
supernatant, the pellet was washed with 1 mL of KPBS by gentle resuspension, and then transferred to a new tube. The suspension was spun again at 10,000 x g for 10 minutes, after
A
uthor Man
uscr
ipt
A
uthor Man
uscr
ipt
A
uthor Man
uscr
ipt
A
uthor Man
uscr
ipt
which the supernatant was aspirated and the pellet was incubated with 100 μL lysis buffer (see above) for 10 minutes on ice. Afterwards, the detergent lysate was transferred to a new tube, spun down at 17,000 x g for 10 minutes, and the supernatant kept. For experiments comparing the specificity of differential centrifugation to the IP method, 100 μL of lysis buffer was also used to lyse mitochondria isolated by the anti-HA beads.
Calculations for matrix glutamate and aspartate during RC dysfunction in the presence and absence of pyruvate—Matrix concentrations from Table S3 were used for all calculations. To streamline the explanation of the calculations, the following abbreviations will be used: V = treated; O = oligomycin-treated; VP = vehicle-treated, pyruvate-supplemented; OP = oligomycin-vehicle-treated, pyruvate-supplemented. To calculate the pyruvate-driven changes in matrix aspartate during RC dysfunction, the following steps were done. Because the concentration of matrix aspartate in VP cells was significantly lower than that of V cells (p < 0.05, n = 3), the expected matrix concentration of aspartate in OP cells was first calculated by multiplying each replicate of matrix aspartate concentrations from VP cells by 0.3014, the average fractional abundance of matrix
aspartate in O cells relative to V cells. The resulting triplicate set of expected matrix concentrations of aspartate in OP cells was significantly different from the measured matrix concentrations of aspartate in OP cells (p < 0.05, n = 3). As such, the average expected matrix concentration of aspartate (141.85 μM) was subtracted from each replicate of the measured matrix concentrations of aspartate in OP cells to obtain a triplicate set of changes in matrix aspartate upon pyruvate supplementation during RC dysfunction.
To calculate the pyruvate-driven changes in matrix glutamate during RC dysfunction, the following steps were done. The matrix concentrations of glutamate in V and VP cells were not significantly different, so it was unnecessary to calculate an expected matrix
concentration of glutamate for OP cells. Because the matrix glutamate concentrations of O and OP cells were significantly different (p < 0.05, n = 3), the average matrix glutamate concentration of O cells was subtracted from each replicate of the matrix glutamate concentrations of OP cells to give a triplicate set of changes in matrix glutamate upon pyruvate supplementation during RC dysfunction.
Heat maps—Heat maps were generated using Java TreeView (Saldanha, 2004). See Tables S2 and S3 for complete lists of criteria used to assemble heat maps.
Experimental design—Experiments were not done in a blinded fashion. All instances where n replicates are reported had n biological replicates.
QUANTIFICATION AND STATISTICAL ANALYSIS
P-values in the Table S1 panels, “Untargeted pos-measurements” and “Untargeted neg-measurements,” were calculated using an unpaired, one-tailed, heteroscedastic student’s t-test in Microsoft Excel. All other p-values were calculated using an unpaired, two-tailed, parametric student’s t-test in GraphPad Prism 6, except for the Table S3 panel “Pyruvate’s effects – stat. sig.,” for which an identical t-test was performed but in Microsoft Excel rather than GraphPad Prism 6. All r2 values were derived from Pearson correlation coefficients
A
uthor Man
uscr
ipt
A
uthor Man
uscr
ipt
A
uthor Man
uscr
ipt
A
uthor Man
uscr
ipt
calculated in either GraphPad Prism 6 or Microsoft Excel. Principal components analysis (Figure 3) and a Pearson correlation matrix of fold-changes in metabolite abundance (Figure 5) were performed and visualized using R. The exact value of n, the definition of center and precision measures, and p-values are provided in all figure legends. The exact values of n and p-values for data analyses can also be found in Tables S1 and S3 and certain portions of the Methods and Resources. All instances where n replicates are reported had n biological replicates.
Measurements of urate are not included in Table S2 “Whole-cell, piericidin” and Table S2 “Matrix, piericidin” because r2 < 0.99 for the standard curve. Measurements of lactate in IP samples are not included in Tables S1–S3 because of the low abundance and resulting poor peak quality of lactate in those samples. These exclusions are also detailed in the relevant panels of Tables S1–S3.
DATA AND SOFTWARE AVAILABILITY
Data resources—Datasets can be found in Tables S1–S3.
Supplementary Material
Refer to Web version on PubMed Central for supplementary material.
Acknowledgments
We thank all members of the Sabatini Lab and Hoi See Tsao for helpful suggestions. C4- and C5-carnitines were kindly synthesized by Rajan Pragani and provided by Jared Mayers. This work was supported by grants from the US NIH (R01CA103866, R01CA129105, and R37AI047389) and the Department of Defense
(W81XWH-15-1-0230) to D.M.S; and from the Department of Defense (W81XWH-15-1-0337) to E.F. Fellowship support was provided by the NIH to W.W.C. (F30 AG046047); to T.W. (F31 CA189437); to K.B. (K22 CA193660). D.M.S is an investigator of the Howard Hughes Medical Institute.
References
Berry, MN.; Barritt, GJ.; Edwards, AM.; Burdon, RH. Isolated Hepatocytes: Preparation, Properties and Applications: Preparation, Properties and Applications. Elsevier Science; 1991.
Berthet J, Baudhuin P. A REMARK ABOUT THE DETERMINATION OF THE WATER CONTENT OF MITOCHONDRIA. The Journal of Cell Biology. 1967; 34:701–702. [PubMed: 6035656] Bestwick RK, Moffett GL, Mathews CK. Selective expansion of mitochondrial nucleoside
triphosphate pools in antimetabolite-treated HeLa cells. Journal of Biological Chemistry. 1982; 257:9300–9304. [PubMed: 6213605]
Birsoy K, Wang T, Chen Walter W, Freinkman E, Abu-Remaileh M, Sabatini David M. An Essential Role of the Mitochondrial Electron Transport Chain in Cell Proliferation Is to Enable Aspartate Synthesis. Cell. 2015; 162:540–551. [PubMed: 26232224]
Bogenhagen D, Clayton DA. The Number of Mitochondrial Deoxyribonucleic Acid Genomes in Mouse L and Human HeLa Cells: QUANTITATIVE ISOLATION OF MITOCHONDRIAL DEOXYRIBONUCLEIC ACID. Journal of Biological Chemistry. 1974; 249:7991–7995. [PubMed: 4473454]
Bowsher CG, Tobin AK. Compartmentation of metabolism within mitochondria and plastids. Journal of Experimental Botany. 2001; 52:513–527. [PubMed: 11373301]
Cacciatore S, Loda M. Innovation in metabolomics to improve personalized healthcare. Annals of the New York Academy of Sciences. 2015; 1346:57–62. [PubMed: 26014591]