HAL Id: hal-01517760
https://hal.archives-ouvertes.fr/hal-01517760
Submitted on 17 May 2018HAL is a multi-disciplinary open access archive for the deposit and dissemination of sci-entific research documents, whether they are pub-lished or not. The documents may come from teaching and research institutions in France or abroad, or from public or private research centers.
L’archive ouverte pluridisciplinaire HAL, est destinée au dépôt et à la diffusion de documents scientifiques de niveau recherche, publiés ou non, émanant des établissements d’enseignement et de recherche français ou étrangers, des laboratoires publics ou privés.
Charirat Kusonwiriyawong, Moritz Bigalke, Sophie Cornu, David Montagne,
Zuzana Fekiacova, Marina Lazarov, Wolfgang Wilcke
To cite this version:
Charirat Kusonwiriyawong, Moritz Bigalke, Sophie Cornu, David Montagne, Zuzana Fekiacova, et al.. Response of copper concentrations and stable isotope ratios to artificial drainage in a French Retisol. Geoderma, Elsevier, 2017, 300, pp.44-54. �10.1016/j.geoderma.2017.04.003�. �hal-01517760�
Response of copper concentrations and stable isotope ratios to artificial
1
drainage in a French Retisol
2
Charirat Kusonwiriyawonga, Moritz Bigalkea*, Sophie Cornub,c, David Montagnec,d,
3
Zuzana Fekiacovab, Marina Lazarove, Wolfgang Wilckef
4
aGeographic Institute, University of Berne, Hallerstrasse 12, 3012 Berne, Switzerland
5
b1Aix Marseille Univ, CNRS, IRD, Coll France, INRA, CEREGE, Aix-en-Provence, France
6
cINRA, UMR 1402 ECOSYS F-78850 Thiverval Grignon, France
7
dAgroParisTech, UMR 1402 ECOSYS F-78850 Thiverval Grignon, France
8
eInstitute of Mineralogie, Leibniz University Hannover, Callinstr. 3 9
30167 Hannover, Germany 10
fInstitute of Geography and Geoecology, Karlsruhe Institute of Technology (KIT),
Reinhard-11
Baumeister-Platz 1, 76131 Karlsruhe, Germany. 12
*Corresponding author: Moritz Bigalke, phone: +41(0)316314055,
13 moritz.bigalke@giub.unibe.ch 14 15 Abstract 16 17
Copper is a redox-sensitive trace element, which can be both, an essential micronutrient and a 18
pollutant. We therefore analyzed Cu concentrations and stable isotope ratios (δ65Cu values) in a
19
drained Retisol to trace the response of Cu to a changing hydrological regime and enhanced clay 20
eluviation. The study soil was artificially drained 16 years before sampling resulting in 21
macroscopically visible pedogenetic changes and is thus a suitable site to investigate the influence 22
of pedogenetic processes on the fate of Cu. Samples were collected from all horizons along a 23
trench at four distances from the drain: 0.6 m, 1.1 m, 2.1 m and 4.0 m. In the E&Bt horizon, four 24
different soil volumes (ochre, pale brown, white-grey and black) were sampled at all four distances 25
from the drain. Furthermore, we analyzed soil solutions sampled with piezometer, porous cups, 26
and at the drain outlet. The Cu concentrations were lowest in the surface (Ap) horizons (6.5-8.5 27
µg g-1) and increased with depth to the clay-rich Bt horizons (10.5-12 µg g-1), because of clay
28
eluviation and associated Cu transport. The δ65Cu values significantly decreased from the surface
29
(Ap = -0.25±0.07 ‰) to the deeper horizons, but show no significant variation among the deeper 30
horizons (-0.41±0.28 ‰) and no correlation with the clay content, indicating that clay eluviation 31
does not significantly affect d65Cu values. The isotopically heavier d65Cu values in the Ap horizons
32
can probably be explained by agricultural management practises like sludge application and 33
fertilization. Close to the drain (position 0.6 m), Cu concentrations were depleted and the lighter 34
Cu isotope was enriched (-0.91±0.15‰) in the uppermost part of the E&Bt horizon. We attribute 35
this to the changing redox conditions, caused to lowering of the water level close to the drain. 36
Copper concentrations in black and ochre volumes were significantly higher than in pale-brown 37
and white-grey volumes. The black volume had significantly higher δ65Cu values than the ochre
38
volume indicating preferential sorption/occlusion of the heavy Cu isotope by Fe oxides. Enhanced 39
clay eluviation in bulk soil close to the drain and in specific soil volumes did not affect d65Cu
40
values. Cu concentrations (2.1 - 14 µg L-1) and δ65Cu (0.04 - 0.42‰) values in water samples
41
showed no clear relation with redox changes along the trench perpendicular to the drain. The 42
enrichment of the heavy Cu isotope in the solution samples (D65Cu(soil-solution)= -0.61±0.41)
43
indicates that reductive Cu mobilization is not the main driver of Cu leaching, because this would 44
preferentially mobilize isotopically light Cu. We conclude that the eluviation of the <2µm fraction, 45
strongly controlled Cu concentrations, but had no discernible effect on δ65Cu values. The changing
redox conditions did not seem to control Cu concentrations and the stable isotope distribution in 47
most of the bulk soil, soil volumes and soil water. Instead, weathering, complexation of leached 48
Cu, Cu application with fertilizers and sorption processes within the soil controlled its δ65Cu
49
values. 50
51
Keywords: Copper isotopes; Lessivation; Redox conditions; Retisol; Soil volumes; drainage; soil 52 water. 53 54 1. Introduction 55
In temporal or permanently water-saturated soils, episodic anoxic redox conditions couple 56
back to many soil chemical properties and may cause mobilization and redistribution of redox-57
sensitive elements like Cu. Copper is of interest because of its nutritional importance as well as 58
pollution risk. Furthermore, the redox behavior of Cu is assumed to play an important role in 59
colloidal mobilization of a number of toxic elements like Ag, Cd, Hg and Pb (Abgottspon et al., 60
2015; Hofacker et al., 2013; Weber et al., 2009a). Thus, information about Cu behavior in 61
temporarily water-saturated soils and the response of Cu to changes in the soil water regime might 62
help to understand the release mechanisms of redox-sensitive trace elements. 63
When soils get waterlogged, the redox potential drops and Fe and Mn (oxyhydr)oxides are 64
dissolved releasing associated trace elements (e.g., As, Ba, Co, Cr, V; Abgottspon et al., 2015; Du 65
Laing et al., 2009; Sipos et al., 2011). Changes to anoxic conditions may cause microbial formation 66
of reduced metal (Cu+ and Cu[0]) colloids (Weber et al., 2009b). When the redox potential drops
67
sufficiently, microbial sulfate reduction is initialized and the mobility of Cu can be limited by the 68
formation of or co-precipitation with sulfides (Weber et al., 2009b; Borch et al., 2010). However, 69
sulfate reduction may also favor the release of Cu-sulfide colloids into soil solution, resulting in 70
enhanced mobility during several days after flooding (Abgottspon et al., 2015; Hofacker et al., 71
2013; Weber et al., 2009a). When the conditions in the soil change to oxic, Cu(0) is rapidly 72
oxidized to Cu2+, while Cu+-S
org or CuxS is only slowly oxidized limiting Cu solubility in soil
73
(Fulda et al., 2013b). Balint et al. (2014) confirmed that Cu leaching decreased over four redox 74
cycles, which they attributed to the redistribution of Cu from labile to more recalcitrant chemical 75
fractions in soil. 76
Several soil processes result in fractionation of Cu isotopes (Fig. 1, Bigalke et al., 2010a; 77
c; 2011; 2013). Sorption of Cu to Al and Fe (oxyhydr)oxides caused an enrichment of heavy Cu 78
on the surface of the Fe (oxyhydr)oxides (Balistrieri et al., 2008; Pokrovsky et al., 2008). Sorption 79
to organic ligands shows different fractionation factors depending on the type of organic ligand 80
and pH (Bigalke et al., 2010b; Ryan et al., 2014). Lighter Cu isotopes are preferentially adsorbed 81
on clay mineral surfaces (Li et al., 2015). Redox reactions cause pronounced fractionation, leaving 82
the reduced Cu species enriched in lighter Cu isotopes (Ehrlich et al., 2004; Zhu et al., 2002). 83
Babcsányi et al. (2014) and Bigalke et al. (2010a; 2011; 2013) found temporally water-saturated 84
soil horizons and wetlands to be enriched in heavy Cu isotopes, which they attributed to the loss 85
of light Cu by leaching of reduced colloidal Cu forms. Liu et al. (2014a) studied weathering and 86
soil formation under different climatic conditions and attributed variations in the isotopic 87
composition to sorption of Cu to organic carbon in soils and leaching of heavy Cu, while also 88
different redox conditions in the soils may have caused significant fractionation. In oxic weathered 89
soils, leaching of heavy Cu because of complexation and downward transport with humic acids 90
was also described by Bigalke et al. (2011). Fekiacova et al. (2015) recently compiled data from 91
contaminated and uncontaminated soils and found that contaminated soils tended to show heavier 92
d65Cu values. In addition, fractionations associated with plant uptake of Cu (Jouvin et al., 2012;
93
Navarrete et al., 2011; Ryan et al., 2013; Weinstein et al., 2011) might affect Cu isotope 94
distribution in the organic and surface horizons (Bigalke et al., 2011). The literature reveals that 95
the determination of Cu stable isotope ratios may be a valuable additional tool to mass budgeting 96
approaches for the identification of the processes by which Cu responds to pedogenesis (e. g., clay 97
redistribution and redox changes). To study the interaction of the latter two processes, Retisols are 98
a model soil type. 99
Retisols are characterized by the eluviation of clay from the surface horizons (E horizon) 100
and transport and accumulation of the clay in deeper horizons (Bt horizon). The subsoil clay 101
accumulation impedes drainage and leads to temporary water saturation in winter. In such soils, 102
the combination of eluviation and redox processes is responsible for the morphological 103
degradation of the soil and the formation of the E&Bt-horizon, characterized by the juxtaposition 104
of four soil volumes differing in texture and color. To improve agricultural suitability, many 105
Retisols have been drained (FAO, 2001; IUSS Working Group WRB, 2014). Artificial drainage 106
was demonstrated to induce i) an increasing intensity of the eluviation process in the immediate 107
vicinity of the drains and ii) the transport of dissolved Fe and Mn towards the drain lines where 108
more oxidative conditions favored the precipitation of Fe and Mn oxides in various forms of black 109
concretions and impregnations (Montagne et al., 2008). 110
We focus on the Cu isotopic composition of soil samples collected from four soil profiles 111
located at increasing distance from a drain and the evolution of the δ65Cu values of four soil
112
volumes in the E&Bt horizon as response to the drainage. We aim to answer the following 113
questions: 114
1) What is the effect of clay eluviation and accumulation in the Bt horizons on Cu 115
concentrations and d65Cu values?
116
2) What is the effect of drainage and associated changes in soil chemistry on Cu 117
concentrations and d65Cu values?
118
3) How do redox and eluviation processes effect Cu concentrations and d65Cu values of
119
soil solutions? 120
121
2. Materials and methods
122
2.1. Site description and soil sampling 123
The study site is located on the crest of Yonne plateau in France where Retisols developed 124
on quaternary loamy deposits overlying an Eocene clay layer. The deposit contains 70-90% of silt 125
and 5-20% of clay. The soil was extensively cultivated for at least 200 years. Since 1988, an 126
artificial subsurface drainage was installed at 1 m depth. The drain spacing was 15 m between 127
parallel drainage pipes. The soil water regime fluctuates seasonally with saturation from December 128
or January to February or March depending on the year. The temporary water table possibly 129
reaches to the A horizon and is lowered close to the drain (Fig. 2; Montagne et al., 2008). 130
Details of the soil sampling procedure are available in Montagne et al. (2008). Briefly, in 131
2004, i.e. 16 yr after installation of the drainage, soil profiles were sampled from a trench 132
perpendicular to one drain at four different positions with increasing distance to the drain (0.6, 1.1, 133
2.1 and 4.0 m, respectively). At each position, bulk soil samples were collected from three soil 134
horizons (Ap/E&Bt/Bt). The Ap horizon (0 to ~ 30-35 cm depth) has a silty texture and is enriched 135
with organic matter (7.3±0.3 g kg-1 organic C; Montagne et al., 2008). The E&Bt horizon (~35 to
136
60 cm depth), shows pronounced eluviation and redoximorphic features resulting in the 137
juxtaposition of four volumes differing in texture and color. The four soil volumes include white-138
grey, brown, ochre and black volumes (Montagne et al. 2008). The white-grey and the pale-139
brown volumes are most abundant in the E&Bt-horizon, while in the underlying clay-enriched Bt 140
horizon of yellowish brown color (~55 to ~105 cm depth), the ochre soil volume is by far most 141
abundant. Soil pH increased with depth from 7.6±0.1 in the Ap horizon to 8.0±0.8 in the Bt 142
horizon. In addition to the bulk soil samples, soil monoliths (approximately 27x15x12 cm) were 143
extracted from the E&Bt horizons at all four distances to the drain. In these monoliths, the white-144
grey, pale-brown and ochre soil volumes were manually separated from each other, while black 145
concretions and impregnations were sorted by wet sieving and the help of a magnetic separation 146
technique (Montagne et al., 2008). 147
Piezometers were installed at three positions (at 0.7, 1.5 and 4.0 m, respectively, from the 148
drain) in the E&Bt horizons and porous cups (1 x 2 cm-large) were placed in both, the ochre and 149
white-grey volumes. In addition, water was collected at the outlet of the main drain of the plot with 150
an automatic collector. Water samples were collected once a week during the years 2005 and 2006, 151
and once every two weeks during the two following years. The Eh, pH and temperature were 152
measured in the field. In the lab, all soil water samples were filtered through a 0.2-µm cellulose 153
filter, acidified with suprapur HNO3 and stored at 4°C for Fe analysis. Soil water samples were
154
bulked to obtain a sufficient mass of Cu for isotope analysis. Bulking was done for the three 155
different water types separately (piezometer, porous cup, and drain water samples) for two 156
different time periods (2005/06 and 2007/08) resulting in seven different soil water samples. The 157
water samples were classified according to their Fe concentrations as indicator of redox conditions 158
in the soil. The Fe concentrations under oxic condition (Eh > 300 mV) were always lower than 40 159
µg L-1. Therefore, 40 µg L-1 Fe was used as a threshold to separate between oxic and anoxic soil 160 solution samples. 161 162
2.2. Sample preparation and analysis 163
Approximately, 0.25-0.40 g of soil samples were digested in a mixture of concentrated 164
HNO3, HF and H2O2 (ratio 3:2:1) in PFA beakers (Savillex@ MN, USA) for 24-36 h on a hotplate
165
at 120°C. The digests were evaporated until dryness on a hot plate at 70oC. To remove excess HF,
166
the dried residues were redigested with a mixture of concentrated HCl and HNO3 for at least 3-4
167
hours, refluxed several times and evaporated to dryness on a hot plate. Samples were finally 168
dissolved in 7 mol L-1 HCl and 0.001% H
2O2. The water samples (approximately 300 mL) were
169
evaporated yielding >300 ng of Cu for isotope analysis. The samples were refluxed in HNO3 and
170
H2O2 (ratio 1:1) and finally dissolved in 7 mol L-1 HCl and 0.001% H2O2 for Cu purification.
171
All samples were purified using Poly-Prep Chromatography columns (Bio-Rad, CA, USA) 172
filled with 2 mL of pre-cleaned 100-200 mesh AG MP-1 (Bio-Rad, CA, USA) anion exchange 173
resin following an established method (Bigalke et al., 2010a). For soil samples, the column 174
purification was repeated once to gain matrix-clean Cu fractions (Bigalke et al., 2011; Petit et al., 175
2012). After complete separation, the purified fractions were evaporated to dryness and digested 176
with concentrated HNO3 and H2O2. The samples were evaporated and then dissolved in 2% HNO3
177
for Cu isotope analysis. All samples were analyzed by ICP-MS (7700x, Agilent, CA, USA) for 178
matrix elements and Cu recovery. Column eluates, in which Cu was not completely recovered 179
(100±6%) or in which matrix elements were present, were discarded and sample purification was 180
repeated. 181
All reagents used were of suprapur quality (Merck, Darmstadt, Germany). Hydrochloric 182
and nitric acid were purified by sub-boiling distillation. Sample preparation and chemical 183
purification were performed in the clean chemistry laboratory at the Institute of Geology, 184
University of Bern. Total procedural Cu blanks averaged 1.9±0.9 ng (n=3) and 3.4±1.5 ng (n=3) 185
for the first and second runs of column purification, respectively. The quality of the method was 186
evaluated by using USGS basalt BCR-2 (Basalt Columbia River 2, USGS, Reston, VA, USA) 187
reference materials. The mean total Cu concentration we determined in BCR-2 was 18.6±0.3 µg 188
g-1 (mean ± SD, n=11) in good agreement with the certified value of 19±2 µg g-1.
189 190
2.3. Isotope analysis 191
Copper isotope ratios were analyzed by MC-ICP-MS (Thermo-Finnigan Neptune, Thermo 192
Scientific, Waltham, MA, USA) at the Leibniz University Hannover, Germany. Instrument was 193
operating in the low mass resolution mode. Samples and standards were diluted to 300 µg L-1 Cu
194
with 2% HNO3 and introduced in to the MC-ICP-MS by a glass spray chamber (double pass Scott
195
design). Nickel (NIST 986, National Institute of Standards and Technology, Gaithersburg, MD, 196
USA) at concentration of 1000 µg L-1 was used for the instrumental mass-bias correction in
197
combination with standard-sample bracketing. Every sample was at least analyzed twice. The 198
average Cu isotope ratio was reported in the δ65Cu notation in ‰ relative to NIST 976. The
199
accuracy of the resin purification method was validated by using spiked Cu-free matrix samples. 200
The Cu-free matrix samples were prepared from the matrix fraction derived from the purification 201
of the original samples and spiked with the ERM@-AE633 Cu isotope standards (Institute for
202
Reference Materials and Measurements, Geel, Belgium), which is isotopically identical with NIST 203
976 (Moeller et al., 2012). The spiked matrices were treated and purified in the same manner as 204
the original samples. The δ65Cu value of the matrix samples was -0.03±0.04‰ (mean±2SD, n=5)
205
and undistinguishable from ERM@-AE633 (-0.01±0.05‰, Moeller et al., 2012). Reproducibility
and accuracy of δ65Cu measurements were monitored with the help of certified reference materials
207
BCR-2 and NBS C 125-2 (SRM C1252, National Institute of Standards and Technology, 208
Gaithersburg, MD, USA). The NBS C 125-2 was used as an in-house Cu standard to check the 209
MC-ICP-MS stability yielding a δ65Cu value of 0.36±0.06‰ (mean±2SD, n=10). BCR-2 yielded
210
a δ65CuNIST976 = 0.15±0.08‰ (mean±2SD, n=11) comparable to the previously published data
211
ranging from 0.14±0.05‰ to 0.22±0.06‰ (e.g., Bigalke et al., 2010a; 2013; Liu et al., 2014b; 212
Moeller et al., 2012). 213
214
2.4. Calculations and statistics 215
The overall mass flux for any soil volume mj;flux in g cm−2 was then calculated for each element j
216
using Eq. (1) proposed by Brimhall et al. (1991) and modified by Egli and Fitze (2000): 217
!";$%&' = )**) ×,-./×01;-./8 ×23 ×51.7
9;7:) (1)
218
in which ρ is the bulk density, Cj is the concentration of j in weight percent, Th (cm) is the 219
thickness of the considered soil horizon. The subscripts ref and w referto the soil taken as a 220
reference and to the weathered product, respectively. We used positions 60 and 110 m as 221
representing the weathered product (because drainage changes the soil composition at these 222
distances) and positions 210 and 400 m as reference (because here the effect of drainage is very 223
low, Montagne et al., 2008). This is different to the classical approach of comparing soil horizons 224
with parent material. The εi;w and τj;w values are the strain and the open-system mass-transport
225
functions, respectively, calculated according to Eqs. 2 and 3 (Brimhall et al., 1991). The εi;w is a 226
measure for the change of the soil volume over time using an immobile element i and τj;w; is the 227
mass fraction of element j gained or lost from the weathered product with respect to the mass 228
originally present in the reference material (i.e. the soil at positions 210 and 400 m). We used 229
quartz as an immobile compound. 230 ;<;= = ,-./09;-./ ,709;7 − 1 (2) 231 @<;" = ,709;1 ,-./01;-./A;<;=+ 1C − 1 (3) 232
After checking the data for homoscedasticity with the Levené test, an analysis of variance 233
(ANOVA) followed by a Tukey’s Honestly Significant Difference (HSD) post hoc test was 234
conducted to compare the mean Cu concentrations and isotopic compositions among soil volumes. 235
Normal distribution of residuals was checked by visual inspection. Significance was set at p < 236 0.05. 237 238 3. Results 239
Copper concentrations in the bulk horizons increased with depth at three of the four 240
positions (1.1, 2.1 and 4.0 m). Copper concentrations were closely related with those of the clay 241
fraction (Fig. 3a). The Cu concentrations in the surface (Ap) horizon and clay-rich Bt horizons 242
varied only little along the trench. In contrast, in the E&Bt-horizon, there was a large lateral 243
variation in the Cu concentrations, with the lowest value at position 0.6 m (Tab. 1, Fig. 4a). The 244
δ65Cu values tended to decrease from the Ap horizon to the deeper horizons (Fig. 4b), but showed
245
no relation to Cu concentrations or the clay fraction (Fig. 3b). However, the δ65Cu values at
246
different depths in the E&Bt and Bt horizons and at the different positions along the trench were 247
not different. We only detected a single much lower δ65Cu value compared to all other samples in
248
the 35-45 cm depth layer (E&Bt horizon) at position 0.6 m (Tab. 1, Fig. 3b, 4b). 249
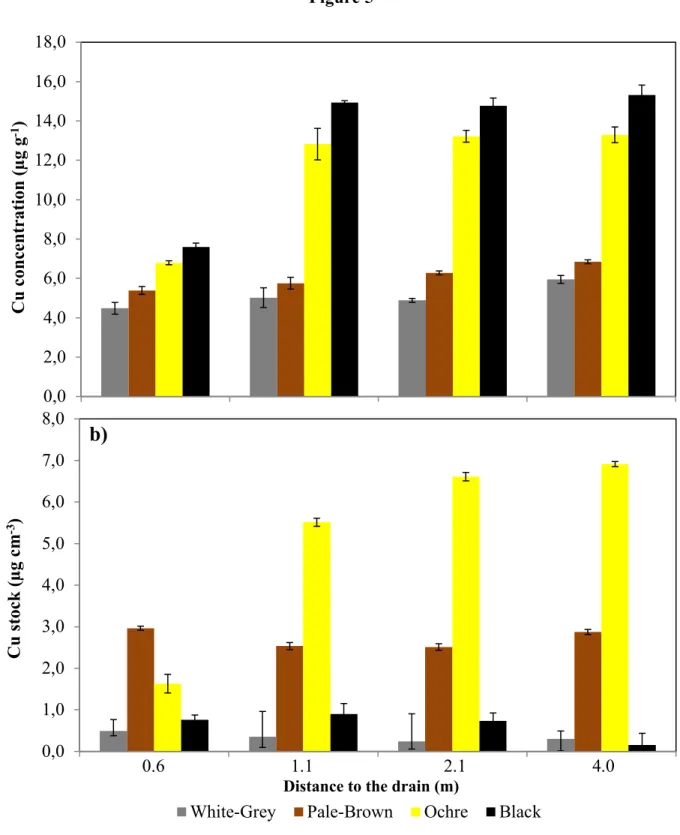
The Cu concentrations were significantly higher in the black and ochre volumes than in the 250
pale-brown and white-grey volumes, respectively. Copper concentrations were not related with 251
distance to the drain in pale-brown and white-grey volumes but were lower in the black and ochre 252
volumes at position 0.6 m than at all other positions (Fig. 5a, Tukeys HSD test, p < 0.05). Overall 253
the black volumes had the significantly highest and the ochre volumes the significantly lowest 254
d65Cu values, while the δ65Cu values of the pale-brown and white-grey volumes were not
255
significantly different from those of the ochre and black volumes (Fig. 6). The bulk δ65Cu value
256
calculated from the mass-balanced sum of the individual soil volumes (ranging from -0.36±0.04‰ 257
to -0.41±0.04‰) showed good agreement with the δ65Cu value of the bulk soil in the E&Bt horizon
258
at the different distances from the drain (ranging from -0.38±0.03‰ to -0.41±0.02). At position 259
0.6 m, this is true for the lower bulk sample (45-55 cm depth), which overlaps with the depth where 260
soil volumes were sampled (Fig. 2), while for the upper 35-45 cm depth layer of the E&Bt horizon 261
with the low d65Cu value (-0.91±0.15‰) we did not have samples of individual soil volumes for
262
comparison. 263
The dissolved Cu concentrations in the porous cup sample were highest of all analyzed soil 264
solutions. The Cu concentrations of drain water were consistently lower than those of the 265
piezometer sample in all three studied samples (Tab. 2). While in the hydrological year 2005/2006 266
the δ65Cu values in the piezometer and drain waters seemed to be lower in the anoxic samples (Fe
267
> 40 µg L-1); compared to the oxic samples, the δ65Cu values of the anoxic samples were similar
268
to those in the oxic samples from the Piezometer in the following hydrological year 2007/08. 269
Consequently, the variations in d65Cu values among the various solution types and sampling dates
270
could neither be clearly assigned to redox conditions nor to the way of sampling. There was no 271
clear difference in Cu concentrations in waters taken under anoxic conditions (Fe > 40µg L-1)
compared with oxic conditions (Fe < 40µg L-1). There were no clear differences in δ65Cu values
273
among the water samples from the piezometers and the drain in 2005/2006, but small variations in 274
2007/08. The single porous cup sample showed the lowest δ65Cu value. Overall, the water samples
275
showed higher δ65Cu values than the solid soil samples, with D65Cu(soil-solution)= -0.61±0.41.
276 277
4. Discussion
278
4.1. Depth distribution of Cu concentrations and d65Cu values 279
The vertical distribution of Cu in the study soil is influenced by (1) the amendment of limed sludge 280
from 1998 to 2001 resulting in a Cu input of approx. 0.9 g m-2 (Montagne et al., 2007), (2) regular
281
fertilization e.g., with mineral fertilizer (no manure application) and (3) pedogenetic processes 282
including lessivation and hydromorphy (Montagne et al., 2008). The Cu input with sludge and 283
fertilizer has increased Cu concentrations in the Ap horizons and also might have changed the 284
δ65Cu value. In the deeper horizons, clay eluviated from the Ap horizons which accumulated in
285
the Bt horizons likely explains the increase in Cu concentrations because the clay fraction usually 286
contains higher Cu concentrations than the coarser particle sizes (Minkina et al., 2011). The latter 287
is also confirmed by the close correlation between the clay and the Cu concentrations (r = 0.80; p 288
< 0.001). This correlation even became closer, when Ap horizons (with anthropogenic Cu input) 289
were removed (Fig. 3a). No d65Cu values for agriculturally used sludge or mineral fertilizers have
290
up to now been reported. However, in case that these additions carry a heavier d65Cu value than
291
the soilthey might be responsible for the higher d65Cu values in the Ap horizons. The different soil
292
depths in E&Bt and Bt horizons show no significant d65Cu changes, despite the significant changes
293
in Cu concentrations linked to the clay eluviation. We explain this finding by the fact that Cu 294
bound to clay controls the concentration and the d65Cu value of total soil Cu. Our findings suggests
that lessivation does not change d65Cu values of the bulk soils, because the eluviated and illuviated
296
horizons have the same Cu isotopic composition. The lacking influence of clay concentrations on 297
d65Cu values is reflected by the absence of a correlation between these two variables (r < 0.001, p
298
= 0.95). Furthermore, soil volumes with different clay concentrations (Montagne et al, 2008) did 299
not show a significant difference in d65Cu values, again indicating that other soil processes than
300
the clay concentration (e.g. sludge application, weathering; Fig. 7) controlled Cu isotope ratios. 301
302
4.2. Response of Cu concentrations and d65Cu values to drainage 303
The low Cu concentration in the E&Bt at position 0.6 m, suggests that the drainage induced Cu 304
leaching (Table 1, Fig. 4a). Mass flux calculations indicated that Cu mass flux (mCuflux) at position
305
0.6 m was, on average, three times higher than at positions 2.1 and 4.0 m (43.8 and 15.3 mg cm-2,
306
respectively). This loss of Cu from the E&Bt horizon at position 0.6 m is linked with substantial 307
loss of Fe and clay at positions 0.6 m and 1.1 m, (6.5 and 2.3 kg m-2 Fe and 75.8 and 25.6 kg m-2
308
clay, respectively; Montagne and Cornu, 2010). The loss has been explained by strongly enhanced 309
eluviation caused by drainage-induced higher water fluxes, and is most pronounced in the upper 310
part of the E&Bt horizon at position 0.6 m (Montagne and Cornu, 2010). These findings agree 311
with the close correlation between the clay and the Cu concentrations (Fig. 3a), which furthermore 312
suggests that clay is the dominant Cu pool in this soil. In contrast, the observed eluviation had no 313
significant effect on the d65Cu value of the drained soil, as illustrated by the lack of a correlation
314
between d65Cu values and clay concentrations (Fig. 3b).
315
At 0.6 m distance, the E&Bt horizon showed a strong negative δ65Cu value in its upper part
316
(35-45cm), while its lower part (45-55cm) with similar properties (clay and Cu concentrations) 317
did not show differences in d65Cu values from the soil at other distances (Fig. 3b). This strongly
negative value was ascertained by three replicate analyses including separate digestion, 319
purification and analysis of each replicate. We suggest that the light d65Cu value in the upper part
320
of the E&Bt horizon at position 0.6 m might be attributable to the change in redox conditions 321
following drainage. Redox changes can cause a comparatively large fractionation of d65Cu values
322
with the reduced Cu(I) enriched in the light isotopes (Fig. 1; Zhu et al., 2002). Under anoxic 323
conditions, the reduced Cu fraction may account for a major part of total soil Cu and may carry a 324
heavy isotope signal to balance that of a Cu-isotopically light residual fraction (Kusonwiriyawong 325
et al., 2015). This Cu-isotopically heavy reduced fraction might be lost by oxidation (Fulda et al., 326
2013b) attributable to drainage, leaving the residual Cu isotopically lighter. The reason for the 327
absence of this isotope effect in the deeper E&Bt Horizon (45-55cm), might be its closer proximity 328
to the soil water table and thus less pronounced episodic oxidation. Fekiacova et al. (2015) reported 329
a similar negative value (-0.89 ‰) for a Retisol at approximately the same depth, which they 330
interpreted as light Cu enrichment linked to Fe oxide precipitation and sorption of light Cu leached 331
from the surface horizons. However, Fekiacova et al. (2015) observed an increase in Cu 332
concentrations in contrast to our study soil where the low d65Cu value was related with a decrease
333
in Cu concentrations. Consequently, the low d65Cu values in the study of Fekiacova et al. (2015)
334
and ours must have different reasons. 335
Additionally to analyzing the bulk soil samples, we partitioned the soil in the E&Bt horizon 336
into four different soil volumes. The differentiation starts from the ochre volume, developing 337
successive pale-brown and white-grey soil volumes by increasing eluviation and redox-induced 338
bleaching (Montagne et al., 2008). Within the ochre volume, the black volume forms because of 339
the precipitation of Mn oxides. With increasing proximity to the drain the ochre volumes decreased 340
and the black, pale-brown and white-grey volumes increased (Montagne et al., 2008). The black 341
volumes always had the highest Cu concentrations, probably because of precipitation with and 342
sorption of Cu on Mn oxides (Negra et al., 2005). The ochre volume always showed higher Cu 343
concentrations than the pale-brown and white grey volumes because of eluviation and reductive 344
leaching of clay minerals and (oxyhydr)oxides in the latter two volumes (Fig. 5a, Montagne et al., 345
2008).Because of the drainage, Cu concentrations in the black and ochre volumes decreased by 346
approx. 50% in the direct vicinity (position 0.6 m) of the drain, which is consistent with the 347
decrease in the bulk soil. The decrease in the Cu concentrations of the ochre and black volumes at 348
position 0.6 m is driven by the strong clay loss by eluviation. In contrast, the more oxidizing 349
conditions near the drain caused an increase in the abundance of the ochre and black volumes, 350
attributable to the precipitation of Mn and Fe oxi(hydr)oxides. Because ochre and black volumes 351
formed in a soil, which was already depleted in Cu, they showed lower Cu concentrations.. 352
Independent of the distance to the drain, the contributions of the Cu stocks in the black, pale-brown 353
and white-grey volumes to the total Cu stock of the bulk E&Bt horizon did not change, while the 354
contribution of the Cu stock in the ochre volume to the total Cu stock of the bulk horizon decreased 355
(Fig. 5b). 356
There were no clear variations in the d65Cu values of the individual volumes with distance
357
to the drain (p < 0.05) indicating that the drainage-induced morphological changes at position 0.6 358
m did not cause a Cu isotope fractionation among the soil volumes. At position 0.6 m, the soil 359
volumes were taken from the lower depth layer (45-55 cm), which had a similar d65Cu value as all
360
other bulk soil samples (Fig. 2). The black volumes showed always significantly higher d65Cu
361
values than the ochre volumes they develop from. This might be attributable to variable redox at 362
the small spatial scale at which the differentiation into the four soil volumes occurred and related 363
Cu isotope fractionation or by the sorption on Fe and Mn oxy(hydr)oxides in the black volumes. 364
As redox variation usually causes a strong isotope fractionation (Fig. 1) we consider more likely 365
that the limited changes observed in the d65Cu values of the different soil volumes depended on
366
the adsorption to Fe and Mn (oxyhydr)oxides (which preferentially adsorb heavy isotopes, Fig. 1b, 367
Pokrovsky et al., 2008; Balistrieri et al., 2008). 368
The overall lack of a correlation between the clay concentration and d65Cu values, the
369
differences in d65Cu values between the 35-45 and 45-55cm depth layers despite a similar degree
370
of eluviation and the absence of significant variations between the ochre and the white-grey soil 371
volumes (Fig. 5, the white grey volume is clay-depleted) imply limited importance of clay 372
eluviation for the d65Cu values of the soil, despite the marked effect of lessivation on Cu 373
concentrations in bulk horizons (Fig. 3). 374
375
4.3. Cu in soil water 376
The Cu concentrations in our soil water samples were similar to the previously published 377
range of Cu concentrations in soil pore water during weathering of black shale of 1-16 µg L-1
378
(Mathur et al., 2012), dissolved Cu in river of 0-3 µg L-1 (Vance et al., 2008) and dissolved Cu in
379
wetlands 1-12 µg L-1 (Babcsányi et al., 2014). The low concentrations in the drain water may be
380
caused by co-precipitation with or sorption to Mn and/or Fe (oxyhydr)oxides precipitating near 381
the drain pipe where the reduced Mn and Fe comes into contact with oxygen. Samples with low 382
(<40 µg L-1) and high (>40 µg L-1) Fe concentrations (indicative for oxic and reducing conditions,
383
respectively) did not show systematically different Cu concentrations, indicating that the redox 384
potential was not sufficiently low to reduce Cu. 385
The d65Cu values in our water samples are well within the range reported for soil, river,
386
and wetland water ranging from 0.02-1.45‰ (Vance et al., 2008; Mathur et al., 2012; Babcsányi 387
et al., 2014). The d65Cu values during anoxic conditions in 2005/06 overlapped with those during
388
oxic conditions in 2007/08, showing no clear relationship with the redox potential in the 389
piezometer. In the drain water, the d65Cu values seemed to be lower under anoxic conditions, but
390
were similar to the oxic sample from the piezometer in 2007/08. The uniform Cu concentrations 391
and d65Cu values indicate that there was no redox-induced change in Cu mobility, agreeing well
392
with the findings from the bulk soils, where we also did not observe an indication for redox 393
mobilization of Cu. The δ65Cu value of dissolved Cu was heavier than that of the bulk solid soil
394
(D65Cu
(soil-solution)= -0.61±0.41), but fractionation was less pronounced than reported for
redox-395
induced fractionations in field and laboratory experiments (Fig. 1). The pattern of Cu isotopically 396
light solid soils and heavy dissolved Cu fits well into the findings of a weathering experiments 397
with basalts at pH 5 (Li et al. 2016) and results of the analysis of soil solutions from oxic 398
weathering of black shales, which both always showed an enrichment of the isotopoically heavy 399
Cu in the dissolved phase (Mathur et al., 2012). 400
Independent of the redox conditions, the d65Cu values of the dissolved fraction in rivers,
401
wetlands and soils always showed a heavy δ65Cu value, while the particulate and colloidal fraction
402
showed light d65Cu values and a strong response to redox changes (Babcsányi et al, 2014; Vance
403
et al., 2008). The lack of a relationship of the d65Cu values of dissolved Cu with the redox potential
404
might be explained by the fact that the Cu isotope ratio of dissolved Cu in soils and rivers is more 405
strongly controlled by complexation with strong dissolved ligands (Vance et al., 2008, Vance et 406
al., 2016) than by redox changes. The responsible ligands were identified by cathode-stripping 407
voltametry and are subdivided in the ligand classes L1 and L2 (Muller et al., 2001). Both ligand 408
classes have high stability constants up to 1016 and often occur in excess compared to Cu
concentrations in solution (Vance et al., 2008). Therefore, it can be assumed that almost all 410
dissolved Cu occurs in complexed form in environmental solutions (Muller et al., 2001). 411
412
5. Conclusions
413
1) The slightly decreasing d65Cu values with increasing depth in the bulk soils might be
414
caused by addition of heavy Cu (e.g., fertilizer and sewage sludge) to the surface soil. 415
2) Drainage did not change d65Cu values in bulk soil and soil volumes, despite Cu
416
redistribution by enhanced clay eluviation, with the exception of one point. A low 417
δ65Cu value and Cu concentration in the upper E&Bt horizon near to the drain may
418
indicate oxidative weathering and leaching of heavy Cu isotopes formerly stored in the 419
reduced Cu pool and is the only d65Cu value which we could link to redox changes.
420
The drainage caused changes in the Cu distribution among the soil volumes indicative 421
of locally changed pedogenetic processes. The δ65Cu values showed significant
422
differences among the soil volumes but did not change with distance to the drain, 423
indicating that the Cu isotope signals are dominated by sorption processes but little by 424
redox changes. 425
3) The Cu concentrations and δ65Cu values in the solution samples did not respond to
426
changes in soil redox conditions, indicating that short-term changes in redox conditions 427
in the soil have a small or no effect on the isotope signals of dissolved Cu. The overall 428
δ65Cu value of dissolved Cu was heavier than that of bulk solid soil (D65Cu
(soil-solution)=
429
-0.61±0.41), which we attribute to weathering and sorption of dissolved Cu to strong 430
ligands in solution in line with several reports of soils solutions and river waters in the 431
literature. 432
433
A conceptual model of the effect of the different processes on Cu distribution and d65Cu
434
values in the soil is displayed in Fig. 7. In summary, the two dominant pedogenetic processes in 435
the study soils (lessivation and hydromorphy) seem to have limited influence on the Cu stable 436
isotope ratios although lessivation strongly controls Cu concentrations. The effect of drainage on 437
δ65Cu is visible only at one position close to the drain, which probably showed the strongest change
438
in redox conditions. Our results illustrate that redox induced Cu leaching is only visible where the 439
soil is most oxidized. Instead, in the Retisol clay eluviation and leaching of organically complexed 440
Cu, drive Cu mobility. In general the d65Cu approach on bulk soils is helpful to investigate the
441
influence of redox and sorption processes on Cu mobility in the soil system, but does not help for 442
clay eluviation were two pools (e.g. clay and soil) are isotopically not discernible. The application 443
of d65Cu values to investigate into redox controlled Cu mobility might be of high importance as
444
reductive Cu mobilisation is driving the mobilisation of a number highly relevant pollutant 445
elements (Ag, Cd, Hg, Pb; Abgottspon et al., 2015; Hofacker et al., 2013b; Weber et al., 2009b). 446
447
Acknowledgments
448
We thank the group of Isotope Geology of the University of Berne, Klaus Mezger, Thomas Nägler, 449
Igor Villa and Gabriela Balzer for access to the clean room and support. The authors are grateful 450
to L. Prud’Homme, B. Renault, G. Giot, N. Chigot from URSol (INRA, Orléans, France) for field 451
sampling and monitoring. We thank the AE Edward Nater, and Ryan Mathur as well as two 452
anonymous reviewers for their constructive comments, which significantly improved the 453
manuscript. We thank the Agricultural Research Development Agency (Public Organization), 454
ARDA, Thailand, for funding Charirat Kusonwiriyawong. 455
456
References
457
Abgottspon, F., Bigalke, M., Wilcke, W., 2015. Fast colloidal and dissolved release of trace 458
elements in a carbonatic soil after experimental flooding. Geoderma 259-260, 156-163. 459
Babcsányi, I., Imfeld, G., Granet, M., Chabaux, F. 2014., Copper stable isotopes to trace copper 460
behavior in wetland systems. Environ. Sci. Technol. 48, 5520-5529. 461
Balint, R., Nechifor, G., Ajmone-Marsan, F., 2014. Leaching potential of metallic elements from 462
contaminated soil under anoxia. Environ. Sci. Process Impacts 16, 211-219. 463
Balistrieri, L.S., Borrok, D.M., Wanty, R.B., Ridley, W.I., 2008. Fractionation of Cu and Zn 464
isotopes during adsorption onto amorhous Fe(III) oxyhydroxide: experimental mixing of 465
acid rock drainage and ambient river water. Geochim. Cosmochim. Acta 72, 311–328. 466
Bigalke, M., Weyer, S., Wilcke, W., 2010a. Stable copper isotopes: A novel tool to trace copper 467
behavior in hydromorphic soils. Soil Sci. Soc. Am. J. 74, 60-73. 468
Bigalke, M., Weyer, S., Wilcke, W., 2010b. Copper isotope fractionation during complexation 469
with insolubilized humic acid. Environ. Sci. Technol. 44, 5496–5502. 470
Bigalke, M., Weyer, S., Kobza, J., Wilcke, W., 2010c. Stable Cu and Zn isotope ratios as tracers 471
of sources and transport of Cu and Zn in contaminated soil. Geochim. Cosmochim. Acta 472
74, 6801–6813. 473
Bigalke, M., Weyer, S., Wilcke, W. 2011., Stable Cu isotope fractionation in soils during oxic 474
weatheringand podsolization. Geochim. Cosmochim. Acta 75, 3119–3134. 475
Bigalke, M., Kersten M., Weyer, S., Wilcke, W. 2013., Isotopes trace biogeochemistry and 476
sources of Cu and Zn in an intertidal soil. . Soil Sci. Soc. Am. J. 77, 680-691. 477
Borch, T., Kretzschmar, R., Kappler, A., Van Cappellen, P., Ginder-Vogel, M., Voegelin, A., 478
Campbell, K., 2010. Biogeochemical redox processes and their impact on contaminant 479
dynamics. Environ. Sci. Technol. 44, 15-23. 480
Brimhall, G.H., Chadwick, O.A., Lewis, C.J., Compston, W., Williams, I.S., Danti, K.J., 481
Dietrich, W.E., Power, M.E., Hendricks, D., Bratt, J., 1992. Deformational mass-482
transport and invasive processes in soil evolution. Science 255, 695-702. 483
Clayton, R.E., Hudson-Edwards, K.A., Houghton, S.L., 2005. Isotopic effects during Cu sorption 484
onto goethite. Geochim. Cosmochim. Acta, 69(10) , A216-a216. 485
Cornu, S., Montagne, D., Daroussin, J., Cousin, I., 2012. Image-analytically derived conceptual 486
model of Albeluvisol morphological degradation induced by artificial drainage in France. 487
Geoderma 189-190, 296-303. 488
Du Laing, G., Rinklebe, J., Vandecasteele, B., Meers, E., Tack, F. M. G., 2009. Trace metal 489
behaviour in estuarine and riverine floodplain soils and sediments: A review. Sci.Total 490
Environ. 407, 3972-3985. 491
Egli, M. and Fitze, P. (2000) Formulation of pedologic mass balance based on immobile 492
elements: A revision. Soil Sci. 165, 437-443. 493
Ehrlich, S., Butler, I., Halicz, L., Rickard, D., Oldroyd, A., Matthews, A., 2004. Experimental 494
study of the copper isotope fractionation between aqueous Cu(II) and covellite, CuS. 495
Chem. Geol. 209,259-269. 496
FAO., 2001. Lecture notes on the major soils of the world. In World Soil Resources Report No. 497
94. Driessen, P., Deckers J., Spaargaren, O., and Nachtergaele, F., Eds., Rome. 498
Fekiacova, Z., Cornu, S., Pichat, S., 2015. Tracing contamination sources in soils with Cu and 499
Zn isotope ratios. Sci. Total Environ. 517, 96-105. 500
Fulda, B., Voegelin, A., Maurer, F., Christl, I., Kretzschmar, R., 2013a. Copper redox 501
transformation and complexation by reduced and oxidized soil humic acid. 1. X-ray 502
absorption spectroscopy study. Environ. Sci. Technol. 47, 10903-10911. 503
Fulda, B., Voegelin, A., Ehlert, K., Kretzschmar, R., 2013b. Redox transformation, solid phase 504
speciation and solution dynamics of copper during soil reduction and reoxidation as 505
affected by sulfate availability, Geochim. Cosmochim. Acta 123, 385-402. 506
Hofacker, A.F., Voegelin, A., Kaegi, R., Weber F.-A., Kretzschmar, R., 2013a. Temperature-507
dependent formation of metallic copper and metal sulfide nanoparticles during flooding 508
of a contaminated soil. Geochim. Cosmochim. Acta 103, 316-322. 509
Hofacker, A.F., Voegelin, A., Kaegi, R., Kretzschmar, R., 2013b. Mercury Mobilization in a 510
Flooded Soil by Incorporation into Metallic Copper and Metal Sulfide Nanoparticles. 511
Environmental Science & Technology, 47(14): 7739-7746. 512
Ilina, S.M., Viers, J., Lapitsky, S.A., Mialle, S., Mavromatis, V., Chmeleff, J., Brunet, P., 513
Alekhin, Y.V., Isnard, H., Pokrovsky, O.S., 2013. Stable (Cu, Mg) and radiogenic (Sr, 514
Nd) isotope fractionation in colloids of boreal organic-rich waters. Chem. Geol. 342: 63-515
75. 516
IUSS Working Group WRB. 2014. World Reference Base for Soil Resources 2014. International 517
soil classification system for naming soils and creating legends for soil maps. World Soil 518
Resources Reports No. 106. FAOM Rome. 519
Jouvin, D., Weiss, D.J., Mason, T.F.M., Bravin, M.N., Louvat, P., Zhao, F., Ferec, F., 520
Hinsinger, P., Benedetti, M.F., 2012. Stable isotope of Cu and Zn in higher plants: 521
Evidence for Cu reduction at the root surface and two conceptual models for isotopic 522
fractionation processes. Environ. Sci. Technol. 46, 2652-2660. 523
Kusonwiriyawong, C., Bigalke, M., Abgottspon, F., Lazarov, M., Wilcke, W., (2016) Response 524
of Cu partitioning to flooding: A δ65Cu approach in a carbonatic alluvial soil. Chemical 525
Geology 420, 69-76. 526
Li, D., Liu, S.-A., Li, S., 2015. Copper isotope fractionation during adsorption onto kaolinite: 527
Experimental approach and applications. Chem. Geol. 396, 74-82. 528
Li, D., Liu, S.-A., Li, S., 2016. Copper isotope fractionation during basalt weathering at pH = 529
0.3, 2, 5 and T = 25°C. Goldschmidt Abstracts: 1743. 530
Liu, S.-A., Teng, F.-Z., Li, S., Wei, G.-J., Ma, J.-L., Li, D., 2014a. Copper and iron isotope 531
fractionatin during weathering and pedogenesis: Insights from saprolite profiles. 532
Geochim. Cosmochim. Acta 146, 59-75. 533
Liu, S.-A., Li, D., Li, S., Teng, F.-Z., Ke, S., He, Y., Lu, Y., 2014b. High-Precision copper and 534
iron isotope analysis of igneous rock standards by MC-ICP-MS. J. Anal. At. Spectrom. 535
29, 122-133. 536
Mathur, R., Fantle, M.S., 2015. Copper Isotopic Perspectives on Supergene Processes: 537
Implications for the Global Cu Cycle. Elements, 11(5): 323-329. 538
Mathur, R., Jin, L., Prush, V., Paul, J., Ebersole, C., Fornadel, A., Williams, J.Z., Brantley, S., 539
2012. Cu isotopes and concentrations during weathering of black shale of the Marcellus 540
Formation, Huntingdon County, Pennsylvania (USA). Chem. Geol. 304, 175-184. 541
Mathur, R., Ruiz, J., Titley, S., Liermann, L., Buss, H., Brantley, S., 2005. Cu isotopic 542
fractionation in the supergene environment with and without bacteria. Geochim. 543
Cosmochim. Acta, 69(22): 5233-5246. 544
Minkina, T.M., Pinskii, D.L., Mandzhieva, S.S., Antonenko, E.M., Sushkova, S.N., 2011. Effect 545
of the particle-size distribution on the adsorption of Copper, Lead and Zinc by 546
Chernozemic soil of Rostov Oblast. Eurasian Soil Sci. 44, 1193-1200. 547
Moeller, K., Schoenberg, R., Pedersen R.B., Weiss, D., Dong S., 2012. Calibration of the new 548
certified reference materials ERM-AE633 and ERM-AE647 for copper and IRMM-3702 549
for zinc isotope amount ratio determinations. Geostand. Geoanal. Res. 36, 177-199. 550
Montagne, D., Cornu, S., Bourennane, H., Baize, D., Ratié, C., King D., 2007. Effect of 551
agricultural practices on trace-element distribution in soil. Commun. Soil Sci. Plan. 38, 552
473-491. 553
Montagne, D., Cornu, S., Forestier, L.L., Hardy, M., Josière, O., Caner, L., Cousin, I., 2008. 554
Impact of drainage on soil-forming mechanisms in a French Albeluvisol: Input of 555
mineralogical data in mass-balance modeling. Geoderma 145, 426-438. 556
Montagne, D., Cornu, S., 2010. Do we need to include soil evolution module in models for 557
prediction of future climate change. Climatic Change 98, 75-86. 558
Muller, F.L.L., Gulin, S.B., Kalvoy, A., 2001. Chemical speciation of copper and zinc in surface 559
waters of the western Black Sea. Mar. Chem., 76(4): 233-251. 560
Navarrete, J.U, Viveros, M., Ellzey, J.T., Borrok, D.M., 2011. Copper isotope fractionation by 561
desert shrubs. Appl. Geochem. 26, 5319-5321. 562
Negra, C., Ross, D.S., Lanzirotti, A., 2005. Soil manganese oxides and trace metals: Competitive 563
sorption and microfocused synchrotron X-ray fluorescence mapping. Soil Sci. Soc. Am. 564
J. 69, 353-361. 565
Petit, J.C.J., Taillez, A., Mattielli, N., 2012. A case study of spectral and non-spectral 566
interferences on copper isotope measurements by multi-collector ICP-MS (Wet plasma). 567
Geostand. Geoanal. Res. 37, 319-335. 568
Petit, J.C.J., Schafer, J., Coynel, A., Blanc, G., Deycard, V.N., Derriennic, H., Lanceleur, L., 569
Dutruch, L., Bossy, C., Mattielli, N., 2013. Anthropogenic sources and biogeochemical 570
reactivity of particulate and dissolved Cu isotopes in the turbidity gradient of the Garonne 571
River (France). Chem. Geol., 359: 125-135. 572
Pokrovsky, O. S., Viers, J., Emnova, E. E., Kompantseva, E. I., Freydier, R., 2008. Copper 573
isotope fractionation during its interaction with soil and aquatic microorganisms and 574
metal oxy(hydr)oxides: Possible structural control. Geochim. Cosmochim. Acta 72, 575
1742-1757. 576
Ponnamperuma, F. N., 1972. The chemistry of submerged soils. Adv. Agron. 24, 29-94. 577
Ryan, B.M., Kirby, J.K., Degryse, F., Harris, H., McLaughlin, M.J., Scheiderich, K., 2013. 578
Copper speciation and isotopic fractination in plants: uptake and translocation 579
mechanisms. New Phytol. 199, 367-378. 580
Ryan, B.M., Kirby, J.K., Degryse, F., Scheiderich K., McLaughlin, M.J., 2014. Copper isotope 581
fractionation during equilibration with natural and synthetic ligands. Environ. Sci. 582
Technol. 48, 8620-8626. 583
Sipos, P., Nemeth, T., May, Z., Szalai, Z., 2011. Accumulation of Trace Elements in Fe-Rich 584
Nodules in a Neutral-Slightly Alkaline Floodplain Soil. Carpath. J. Earth Env. 6, 13-22. 585
Vance, D., Archer, C., Bermin, J., Perkins, J., Staham, P.J., Lohan, M.C., Ellwood, M.J., Mills, 586
R.A., 2008. The copper isotope geochemistry of rivers and the oceans. Earth. Planet.Sc. 587
Lett. 274, 204-213. 588
Vance, D., Matthews, A., Keech, A., Archer, C., Hudson, G., Pett-Ridge, J., Chadwick, O.A., 589
2016. The behaviour of Cu and Zn isotopes during soil development: Controls on the 590
dissolved load of rivers. Chemical Geology, 445: 36-53. 591
Weber, F. -A., Voegelin, A., Kretzschmar, R., 2009a. Multi-metal contaminant dynamics in 592
temporarily flooded soil under sulfate limitation. Environ. Sci. Technol. 73, 5513-5527. 593
Weber, F.-A., Voegelin A., Kaegi, R., Kretzschmar, R., 2009b. Contaminant mobilization by 594
metallic copper and metal sulphide colloids in flooded soil. Nat. Geosc. 2, 267-271. 595
Weinstein, C., Moynier, F., Wang, K., Paniello, R., Foriel, J., Catalano, J., Pichat, S., 2011. 596
Isotopic fractionation of Cu in plants. Chem. Geol. 286, 266-271. 597
Zhu, X. K., Guo, Y., Williams, R. J. P., O'Nions, R. K., Matthews, A., Belshaw, N. S.,Canters, 598
G. W., de Waal, E. C., Weser, U., Burgess, B. K., Salvato, B., 2002. Mass fractionation 599
processes of transition metal isotopes. Earth. Planet.Sc. Lett. 200, 47-62. 600
Table 1
601
Copper concentrations and δ65Cu values of the different soil horizons as a function of distance to
602 the drain. 603 604 Horizon Depth Cu SD δ65Cu 2SD na (cm) (µg g-1) (‰) position 0.6 m Ap 10-20 7.3 0.1 -0.25 0.01 1 E&Bt 35-45 5.7 0.1 -0.91 0.15 3 45-55 5.6 0.1 -0.40 0.02 1 Bt 55-65 9.1 0.2 -0.39 0.06 2 65-75 10.8 0.4 -0.40 0.09 2 position 1.1 m Ap 10-20 8.1 0.6 -0.28 0.01 1 E&Bt 40-55 8.2 0.7 -0.39 0.03 1 Bt 55-65 10.7 0.2 -0.40 0.06 2 65-80 10.5 0.3 -0.31 0.03 1 position 2.1 m Ap 10-20 6.5 0.1 -0.27 0.01 1 E&Bt 40-50 10.6 0.9 -0.41 0.02 2 50-60 10.8 0.7 -0.39 0.01 2 Bt 70-83 11.4 0.3 -0.37 0.04 2 position 4.0 m Ap 10-20 8.5 0.2 -0.20 0.01 2 E&Bt 35-45 8.4 0.2 -0.38 0.03 1 45-55 10.2 0.6 -0.39 0.03 1 Bt 55-65 11.7 0.8 -0.33 0.02 3 65-75 12.0 1.1 -0.35 0.01 3
a n is the number of independent digestions and purifications for isotope analysis 605
Table 2
607
Copper concentration and δ65Cu values of piezometer, drain water and porous cup samples in the
608
hydrological years 2005/06 and 2007/08. 609 610 611 612 613 614 615 Sample name 2005/06 2007/08 Fe < 40 µg L-1 Fe > 40 µg L-1 Fe < 40 µg L-1 Cu δ65Cu 2SD Cu δ65Cu 2SD Cu δ65Cu 2SD µg L-1 (‰) µg L-1 (‰) µg L-1 (‰) Piezometer 5.5 0.40 0.08 5.3 0.10 0.09 6.5 0.11 0.03 Drain water 2.5 0.42 0.18 2.9 0.17 0.01 2.1 0.36 0.02 Porous cup 14.1 0.04 0.05
Figure captions
616
Fig. 1 Compilation of a) d65Cu values found in soils, soil and river waters and b) D65Cu values
617
reported for different processes, which might be of relevance in the Retisol. 1Bigalke et al.
618
(2011), 2Bigalke et al. (2010a), 3Bigalke et al. (2010c), 4 Vance et al. (2016), 5Bigalke et al.
619
(2013), 6Fekiacova et al. (2015), 7 Mathur et al. (2012), 8 Ilina et al. (2013), 9Petit et al. 2013),
620
10Vance et al. (2008), 11Balistrieri et al. (2008), 12Clayton et al. (2005), 13Pokrovsky et al. (2008),
621
14Li et al. (2015), 15Bigalke et al. 2010b), 16Ryan et al. 2014), 17Ehrlich et al. (2004), 18Zhu et al.
622
(2002), 19Asael (2006), 20Mathur et al. (2005), 21Mathur and Fantle (2015), 22Mathur et al.
623
(2012). 624
Fig. 2 Schematic diagram of the study design showing the drain, the disturbed zoned caused by
625
subsurface drainage installation, the soil sampling depth at positions 0.6, 1.1, 2.1 and 4.0 m, 626
respectively, the sampling area of individual soil volumes and the sampling position of water 627
samples extracted from positions 0.7, 1.5 and 4.0 m, respectively and the variation of the soil water 628
table as registered in a piezometer. 629
Fig. 3. Relationship between a) the ,clay and Cu concentrations among all soil samples (solid line,
630
upper equation). If the Ap horizons (which received anthropogenic Cu) were removed, the 631
relationship would become stronger (dotted line, lower equation). In b), the relationship between 632
clay and Cu concentrations (black diamonds) and clay concentrations and d65Cu values (open
633
triangles) of the E&Bt horizons are displayed separately because these horizons should initially have 634
a homogeneous Cu isotope signal, which is then affected by the drainage. While clay and Cu 635
concentrations show a strong linear correlation (solid line, equation), there was correlation between 636
the clay concentrations and the δ65Cu values. The red arrow illustrates the shift between the δ65Cu
values of the uppermost sample at position 60 and the other Bt horizon samples which show identical 638
δ65Cu values.
639
Fig. 4. Vertical distribution of a) Cu concentrations, b) δ65Cu values of the different bulk soil
640
horizons as a function of the distance to the drain. Horizontal bars indicate sampling depth. Vertical 641
bars indicate a) SD of concentrations and b) 2SD of Cu isotope ratios. Vertical error bars indicate 642
the depth interval the sample was taken from. The letters at the right site of the figure are pedogenetic 643
horizon designations. 644
Fig. 5. Copper concentrations in the soil volumes at different distances from the drain (a) and Cu
645
stock of a given soil volume (b). Horizontal error bars indicate a) SD of concentration analysis and 646
b) error propagation based on the standard deviation of concentrations, volumes and bulk densities. 647
Fig. 6. Mean δ65Cu values of the four soil volumes indicative of the dominating pedogenetic
648
processes combined from all four distances from the drain. Error bars indicate 2SD between the 649
four positions. Different superscript letters indicate significant differences in δ65Cu values among
650
soil volumes according to ANOVA with Tukey’s HSD taking the four distances from the drain 651
as replicates. 652
Fig. 7. Mechanistic model of the fate of Cu in the drained Retisol. The size of the arrows indicate 653
the dimension of Cu mass fluxes and the ‰ values refer to D65Cu
process-bulk soil values caused by
654
the various processes. 655
656
657
659
Figure 1
660
662 Figure 2 663 664 0 10 20 30 40 50 60 70 80 90 100 0 50 100 150 200 250 300 350 400
distance from the drain (cm)
Piezometer Porous cup Piezometer
Figure 3
665 666
0 10 20 30 40 50 60 70 80 90 -1,10 -0,90 -0,70 -0,50 -0,30 D ep th ( cm ) δ65Cu (‰) 60 cm 110 cm 210 cm 400 cm Figure 4 668 669 670 671 672 673 674 675 676 677 678 679 680 0 10 20 30 40 50 60 70 80 90 5,0 6,0 7,0 8,0 9,0 10,0 11,0 12,0 13,0 Dep th ( cm ) Cu concentrations (µg g-1) Ap E&Bt Bt Ap E&Bt Bt
Figure 5 681 682 683 684 0,0 2,0 4,0 6,0 8,0 10,0 12,0 14,0 16,0 18,0 C u c on ce n tr at ion ( µ g g -1)
b)
0,0 1,0 2,0 3,0 4,0 5,0 6,0 7,0 8,0 C u s toc k ( µ g c m -3)Distance to the drain (m)
White-Grey Pale-Brown Ochre Black
Figure 6 685 686 687 688 689 -0,60 -0,50 -0,40 -0,30 -0,20 -0,10 0,00
White-Grey Pale-Brown Ochre Black
δ 65 C u ( ‰) Soil volume
ab
ab
b
a
Figure 7
690
691 692